Report


See how LogicMonitor, Dynatrace, Splunk and other top vendors stack up in this comprehensive report by G2, the world’s largest B2B software review platform.
This third-party comparison of enterprise monitoring software is based on real customer reviews and dives into customer satisfaction ratings related to:
- Ease of implementation (ease of setup, implementation time, and more).
- Feature comparison (functionality and management).
- Relationship ratings (ease of doing business, quality of support, and more).
Here’s what’s inside the report:
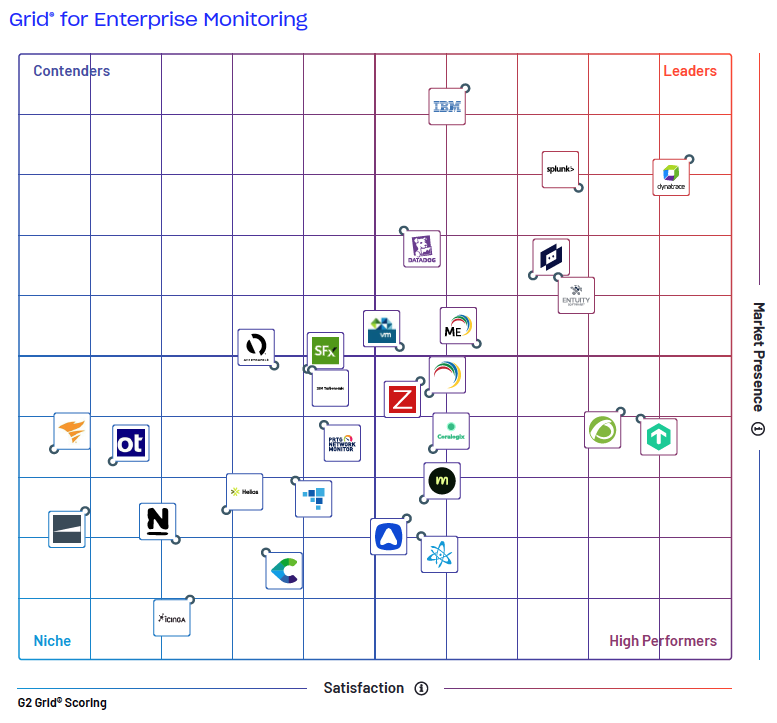
- G2 Grid® for Enterprise Monitoring: A comprehensive overview of the Enterprise Monitoring Software landscape from validated, third-party data.
- Head-to-Head Product Comparisons: How the enterprise monitoring softwares stack up in terms of customer segments, implementation, user adoption and ROI.
- Real User Testimonials: Don’t take it from us. Find out why other IT Pros are turning to LogicMonitor.
Download report
Solution brief
LM Infrastructure Product Brief
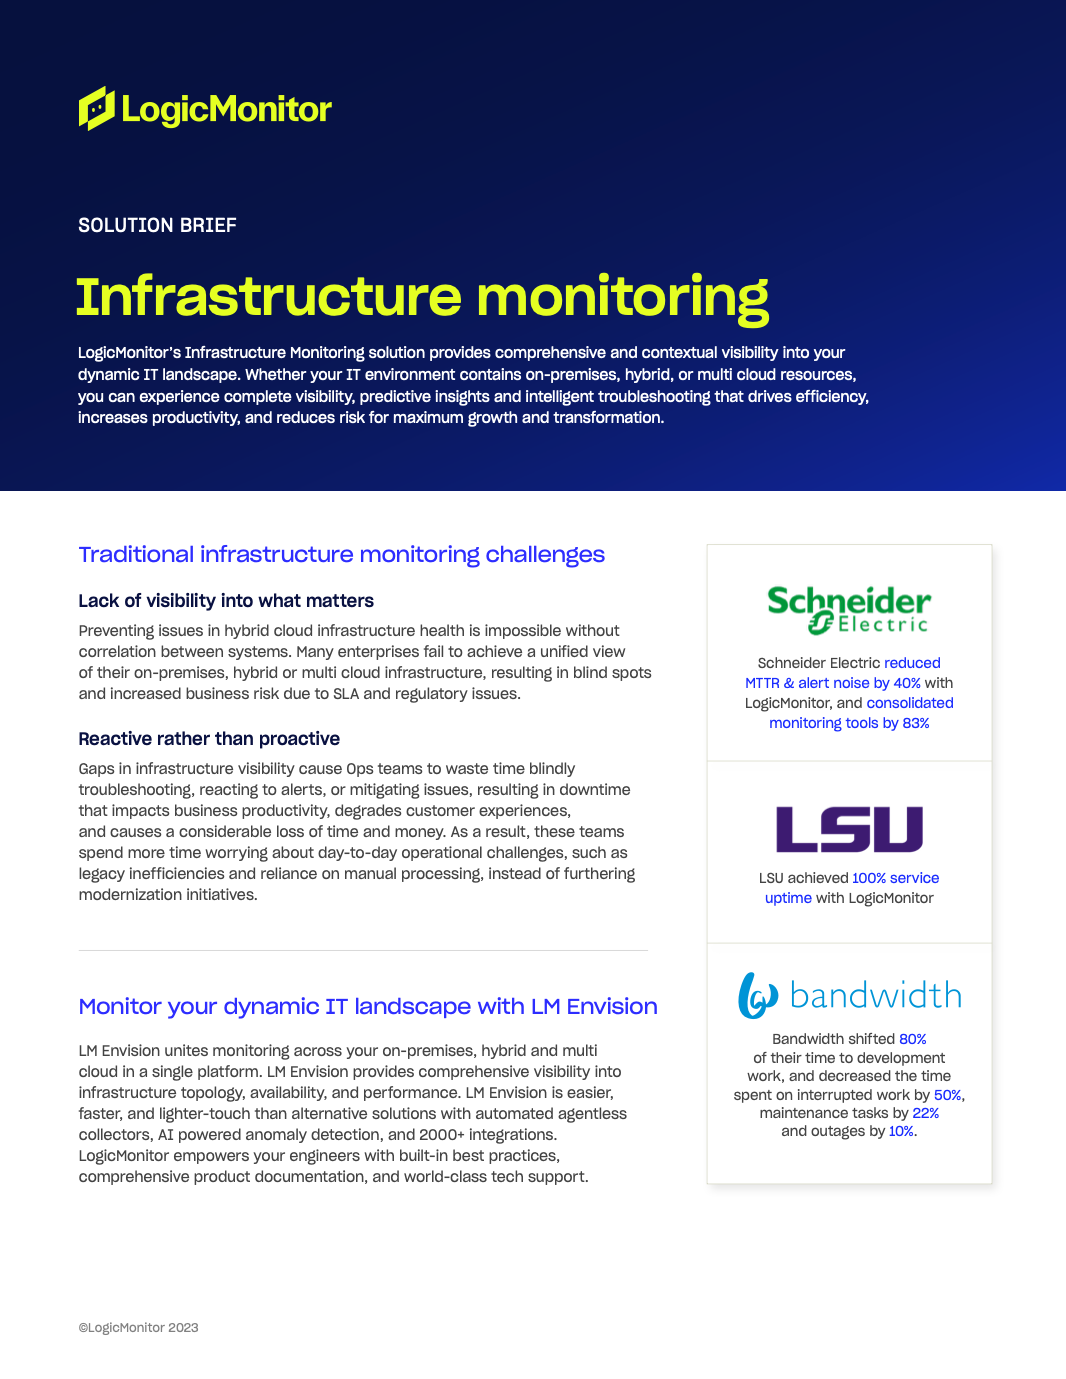
LM Infrastructure
LogicMonitor’s SaaS-based infrastructure monitoring provides comprehensive visibility into infrastructure topology, availability, and performance with correlation across dynamic IT infrastructure devices and resources. From data centers to public/private clouds; experience predictive insights and intelligent troubleshooting to scale, optimize costs, and innovate for maximum enterprise productivity. Read the product brief to learn more!
Download the solution brief
Hain Celestial Group, a leader in organic and healthy food products, marks its 30th anniversary with a robust portfolio of over 20 distinguished brands. Operating in North America, Europe, and the UK, Hain Celestial is committed to fostering a healthier lifestyle through its diverse range of products. Despite their success, their IT infrastructure needed a significant upgrade to keep pace with their expansive product lineup and global reach.
The existing monitoring system was unreliable and difficult for the team to utilize effectively. It often produced inconsistent alerts, leading to uncertainty and operational inefficiencies, especially during critical situations like server outages. To address these challenges, Hain Celestial needed a solution that was robust, comprehensive, user-friendly, and adaptable to their diverse technological ecosystem.
Overcoming IT Monitoring Challenges with LogicMonitor
The introduction of LogicMonitor was a game-changer for Hain. It provided rapid, detailed insights, allowing swift identification and resolution of IT issues. The platform’s versatility and comprehensive data storage capabilities significantly reduced troubleshooting time and helped avoid high-priority incidents. This proactive management of potential issues was critical in maintaining uninterrupted operations and adhering to Service Level Agreements (SLAs).
Substantial Financial Benefits and Enhanced Operational Efficiency
Integrating LogicMonitor’s cloud monitoring capabilities into Hain’s infrastructure led to more than just technical improvements. It offered real-time visibility into their IT spending and resource utilization, resulting in a remarkable reduction of over 60% in monthly IT expenditures. The platform’s logging capabilities simplified complex troubleshooting processes, enhancing operational agility.
Charting a Future of Optimized Monitoring and Growth
Looking forward, Hain aims to expand their use of LogicMonitor to standardize monitoring across their global organization. This will involve capturing operational expense information and maximizing the platform’s logging capabilities for greater insight and efficiency.
This strategic partnership with LogicMonitor has also been pivotal in their ongoing journey towards organizational excellence and innovation. Through LogicMonitor’s support, Hain Celestial Group has reinforced its commitment to maintaining a sustainable, cost-effective business model while paving the way for future growth and technological advancements.
Solution brief
LogicMonitor vs Solarwinds Solution Brief
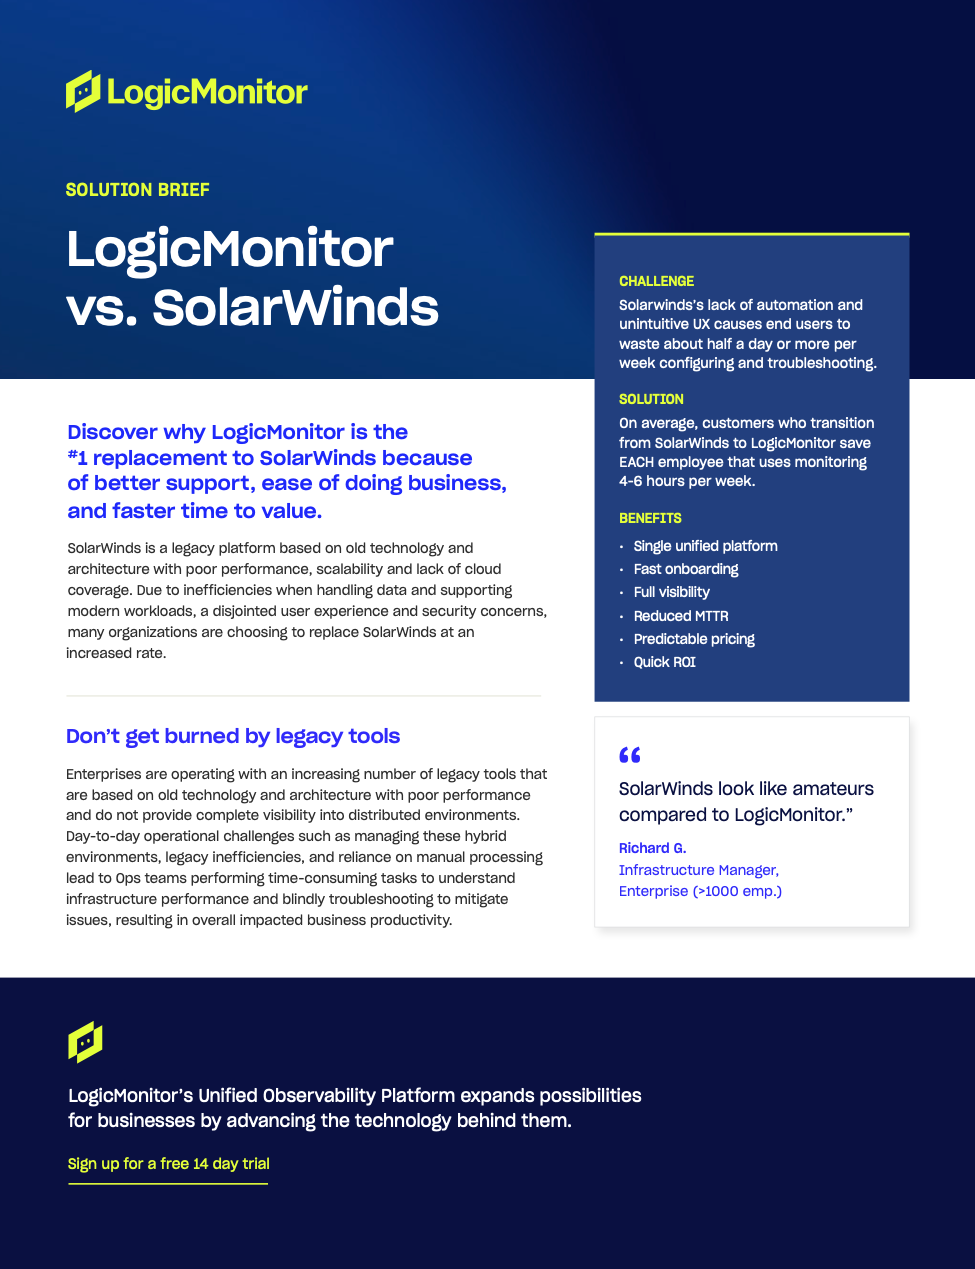
Discover why LogicMonitor is the #1 replacement to SolarWinds because of better support, ease of doing business, and faster time to value.
SolarWinds is a legacy platform based on old technology and architecture with poor performance, scalability and lack of cloud coverage. Due to inefficiencies when handling data and supporting modern workloads, a disjointed user experience and security concerns, many organizations are choosing to replace SolarWinds at an increased rate.
Download the solution brief
Infographic
4 tips to accelerate time to value
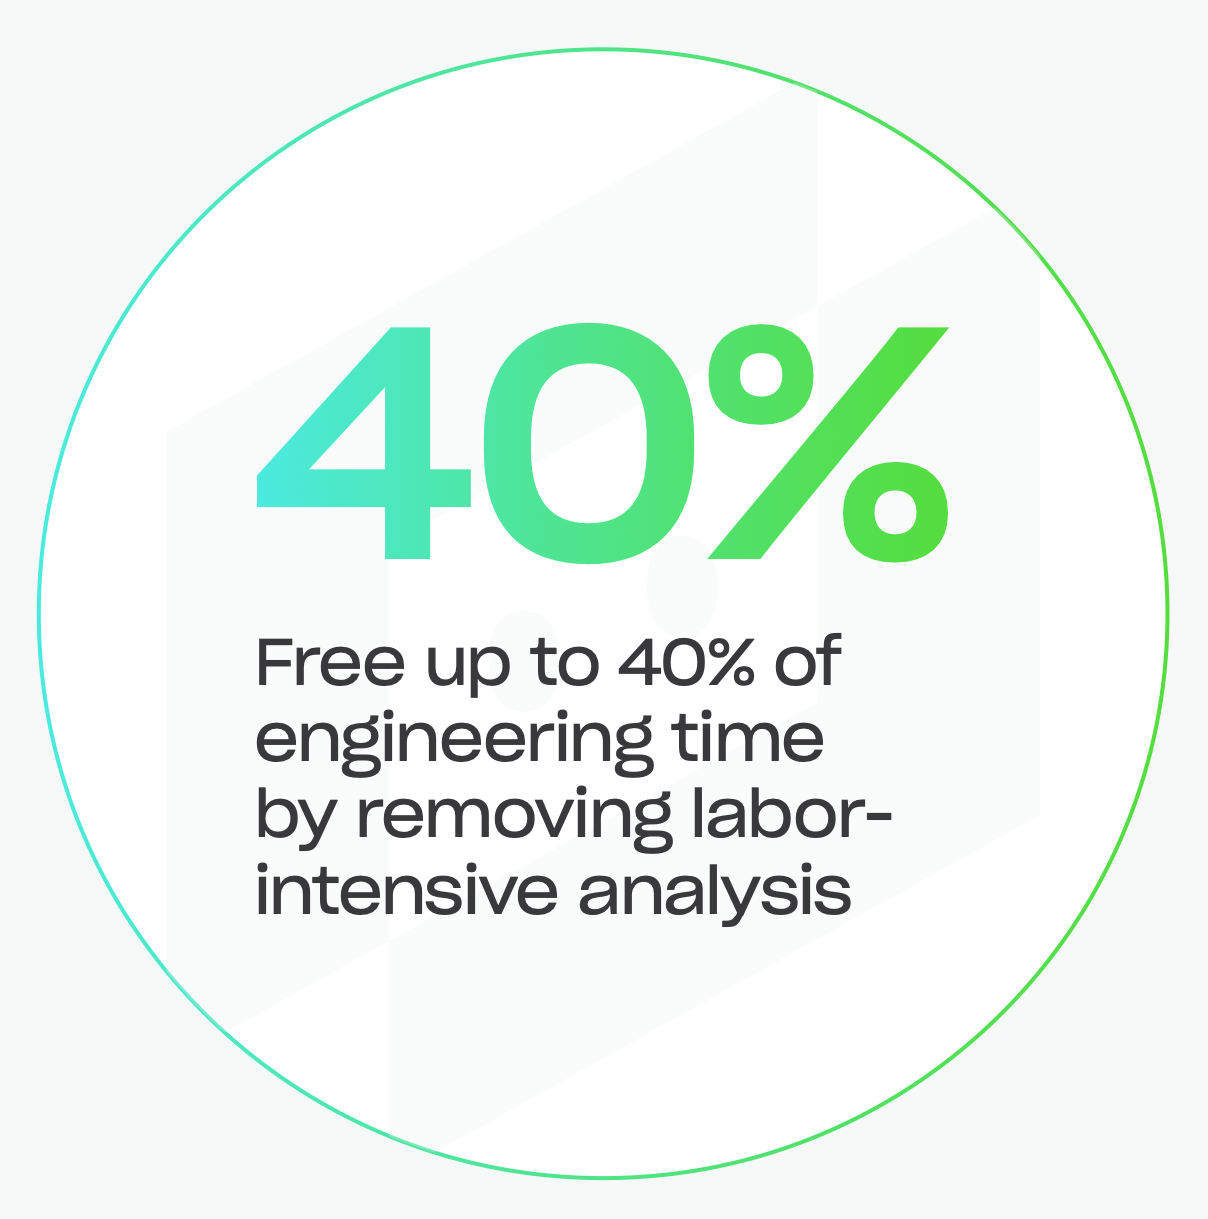
Accelerate your time-to-value journey with four key steps: rapid deployment and ready-to-use templates, predictive capacity management, seamless workflow automation, and significant engineering time savings.
LogicMonitor can liberate up to 40% of your engineering time by eradicating labor-intensive analysis. Step into the future of effortless tech management with LogicMonitor – designed by engineers, for engineers.
On-demand demo
Not Just a Juggling Act: How to Support Your Hybrid IT Environment with LogicMonitor
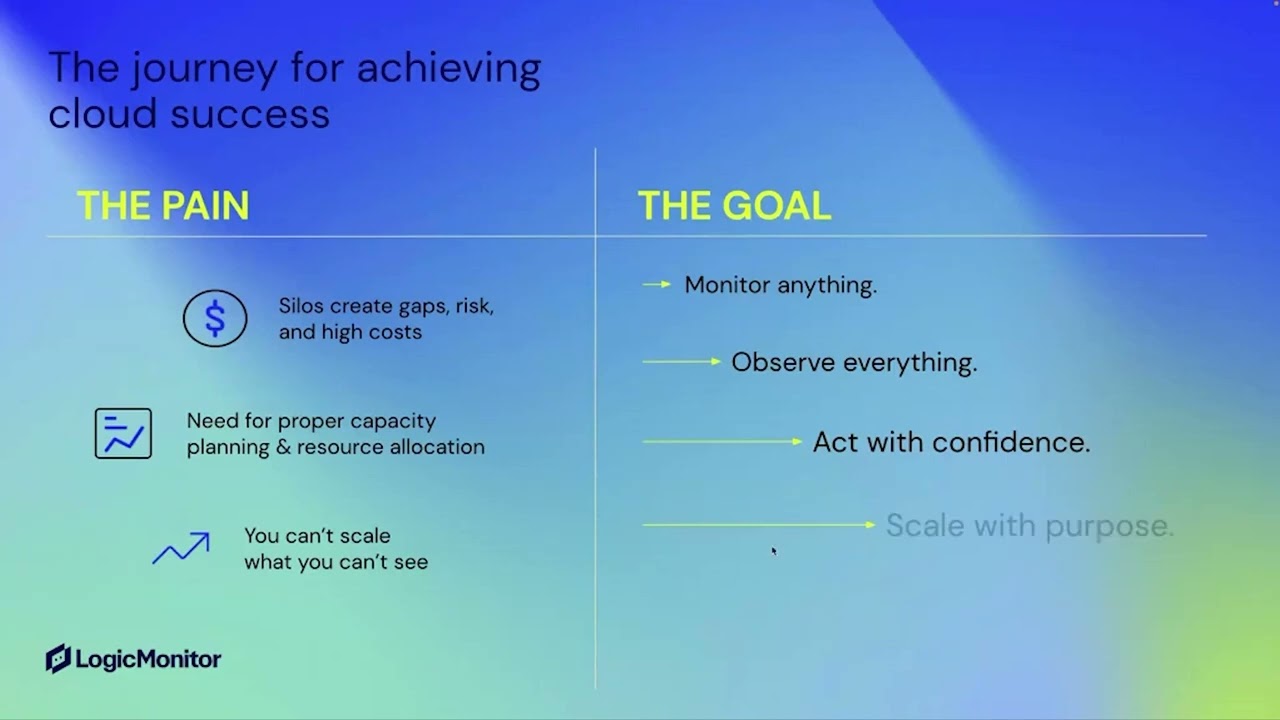
It’s no secret that more and more leaders want the Cloud for their businesses, their customers, and their Ops teams. Whether you’re on-prem, in the cloud, or somewhere in between, the complexity of the cloud shouldn’t stop you from jumping in.
The key? A monitoring solution that is resilient but agile, customized but supported, and data-first but secure. If you’re searching for a solution that allows you to monitor hybrid environments and correlate the data instantly, check out our next webinar, Not just a juggling act: how to support your hybrid IT environment with LogicMonitor.
In the webinar, you’ll learn:
- How to future-proof your hybrid IT with a platform-approach to observability
- How to navigate the different stages of cloud maturity
- How to determine what’s best for your business and teams on your cloud journey
Plus, learn how LogicMonitor delivers holistic monitoring solutions for where you are and where you’re going.
Watch Now

whitepaper
Best Practices for Alert Tuning
This white paper will provide best practices for alert tuning to ensure two related outcomes:
1. Monitoring is in place to catch critical conditions and alert the right people
2. Noise is reduced and people are not needlessly woken up
These outcomes are essential to a successful monitoring strategy. What follows are some critical issues to consider when designing a new monitoring system or reviewing an existing system.
Components of a Monitored Item
Different monitoring solutions use different terminology to represent the items they monitor. Usually there is a hierarchical system that includes high-level groups such as a data center, and then lower-level groups and individual hosts below that. At the host level there will be monitoring categories such as disk, CPU etc., and below that specific instances to be monitored such as /dev/sda mounted at /.
Whatever the organization structure of your monitoring solution, each item monitored should have the following components defined:
• Metric: The measure being monitored, such as CPU percent used.
• Threshold: The definition of when the metric is considered to be in a less than optimal state.
• Alert Level: The level of urgency associated with a given state, usually warning, error or critical.
• Action to Resolve: The action items associated with the alert.
Failure to consider the above components when developing a monitoring solution will increase the likelihood of an alert system failure. Alert systems fail when they generate too much noise, which can result in staff missing or ignoring critical alerts, but they can also fail if they don’t catch critical conditions due to either a lack of flexibility, monitoring capability or bad configuration.
Setting the correct threshold when rolling out a monitoring system can be difficult. Good monitoring tools will have sensible defaults out-of-the-box, but these will have to be tuned over time. For example, CPU usage of 96% is not necessarily a bad thing for all systems, but it will be for some. Additionally, some monitoring tools provide the ability to automatically configure alert thresholds based on historical metric measurement. This offers a threshold baseline and ideally forecasts future issues based on threshold trends.
Alert levels also need to be tuned over time. Again, good defaults can help but a warning alert on one set of systems could be critical alert on others.
One of the most commonly overlooked requirements leading to alerts being ignored is the need to define action items. Good monitoring solutions will have reasonable default descriptions that indicate what may be the cause of a particular condition. In my preferred monitoring solution LogicMonitor, we see the following message associated with an alert on CPU usage:
“The 5 minute load average on server123 is now 99, putting it in a state of critical. This started at 2016-05- 11 11:38:42 PDT. See which processes are consuming CPU (use ‘ps’ command to see which processes are in runnable and waiting state; ‘top’ command will show individual cpu core usage). Troubleshoot or adjust the threshold.”
As a default message this is pretty useful. It tells the recipient the basic steps for troubleshooting. These messages can be customized for known situations such as high traffic requiring more application servers to be added to a cluster. Avoid implementing monitoring alerts that have no actionable responses. This just adds noise and increases the frustration of those receiving the alerts.
Avoid Alert Spamming
Too many alerts going off too frequently creates alert spamming or what is sometimes referred to as an Alert Storm. This is extremely dangerous and can have many adverse consequences, such as a failure of system monitoring. Too many alerts can result in real critical issues going unnoticed. Too many alerts can also lead to critical alerts being accidentally disabled in an effort to cut down the noise. Every alert must be meaningful and have an associated action.
Correctly routing alerts is also important. If the action item is to call someone else then the alert is not meaningful. Don’t turn your admins into receptionists! This is particularly important when working in a DevOps culture where you have developers on-call and different teams responsible for different systems. Take into account that certain metrics will indicate a problem at the application layer and developers are best placed to resolve the situation, but problems that relate to the database should be handled by the DBA. While it makes sense for your operations people to be the first line for system failures, if their only action item is to call a developer or a DBA, this can quickly become demoralizing. Similarly, if a developer is woken up for what is obviously a system failure, this can also be a problem. There will always be situations where one team has to escalate to another, but these should be the exceptions rather than the norm. In LogicMonitor, you can avoid alert spamming by setting up custom escalation chains and alert rules that route alerts to the right people when an issue occurs.
Managing Downtime
Your chosen monitoring solution should have fine-grained control for setting downtime. This can range from disabling all alerts during a full downtime deployment, to controlling individual hosts and monitored instances for ongoing maintenance.
For example, a fine-grained approach to downtime will allow you to set downtime for a single hard drive on a given host. If you are inadvertently alerted for a host that is not currently in production you may decide to disable all metrics but still want to ensure that the host is up and responding to network pings. Additionally, disabling all monitoring for a host may be desirable. For example, if a host has been removed from a production cluster but not fully decommissioned you could decide you may not need to monitor it.
Host groups are useful for managing groups of related systems. For example a dev, QA and production group gives a good high-level organization for managing downtime because during QA deployments you may decide to disable all hosts in the QA group. For automated deployments, a good monitoring system will provide an API to allow automation tools to specify downtime. For scheduled maintenance, the monitoring solution should allow you to schedule repeatable maintenance windows in advance.
Downtime should be scheduled at the most granular possible level. If you are increasing the size of a disk for example, don’t set the entire host to downtime. If you know it will take you 24 hours to fix the issue, schedule 24 hours of downtime. Downtime should expire automatically to avoid forgotten settings.
Missed Alerts
Even the best monitoring systems will occasionally result in system failures that go undetected. This is obviously bad at any time, but particularly after replacing one monitoring system with another. No one remembers the thousands of false alerts produced by your home-rolled Nagios when your shiny new SaaS system misses a production down incident.
To counter the skepticism this will inevitably introduce towards your new system, it is essential to have good “blameless” post mortem practices in place for every outage. A useful checklist of questions to ask in such postmortem include the following:
- What was the root cause of the failure?
- What state were the systems in prior to the failure?
- How much CPU was consumed, how much memory?
- Were we swapping?
- Were there alerts that should have triggered?
- Were the thresholds correct?
Data graphing should assist with this. Compare the graphs under normal system usage with those just prior to the system failure. With LogicMonitor, you can do this by building dashboards that display relevant graphs and metrics across your entire infrastructure. After discussing all of the above the next set of questions you need to answer relate to what we can do to prevent this in the future. It is essential that the issue is not marked as resolved until monitoring is in place to prevent a repeat.
Avoiding Email Overload
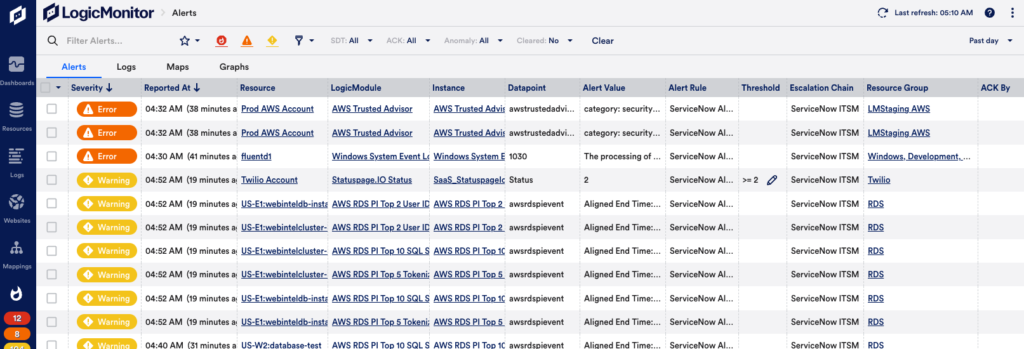
Most places I have worked go to great lengths to prevent false alerts that could potentially page people and wake them up in the night. However, email alerts are often another story. Some companies will allow thousands of email alerts to go off for warning level situations that are often self corrected, when other warnings may be useful, such as disk usage warnings that can allow a systems administrator to take action to prevent an alert reaching critical and waking someone during the night. Unfortunately, it is not realistic to manually scan a thousand emails for something that may actually be useful. Good monitoring tools like LogicMonitor provide dashboards to indicate alert status.
Alert Forecasting
If you want to take your alert strategy to the next level you should add alert forecasting to the mix. Standalone alerts can notify you of specific changes in metrics, but alert forecasting gives you the ability to predict how that metric will behave in the future. Forecasting also enables you to predict metric trends and know when an alert will reach a designated alert threshold.
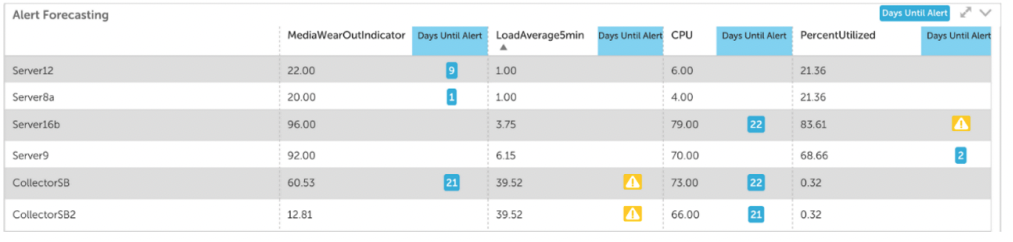
With this information, you can prioritize the urgency of performance issues, refine budget projections, and strategize resource allocation. Some useful examples of alert forecasting are predicting when a disk will be at 95% capacity and predicting your total monthly AWS bill. LogicMonitor includes alert forecasting and you can use it to predict alerts for up to three months in the future.
Reporting
Good reporting can help with the email overload situation described above. One valuable recommendation I received from a LogicMonitor training session was to generate a nightly report for all warning level alerts and disable alert delivery. Admins can then check the morning report and address any warnings to prevent them escalating to error or critical levels.
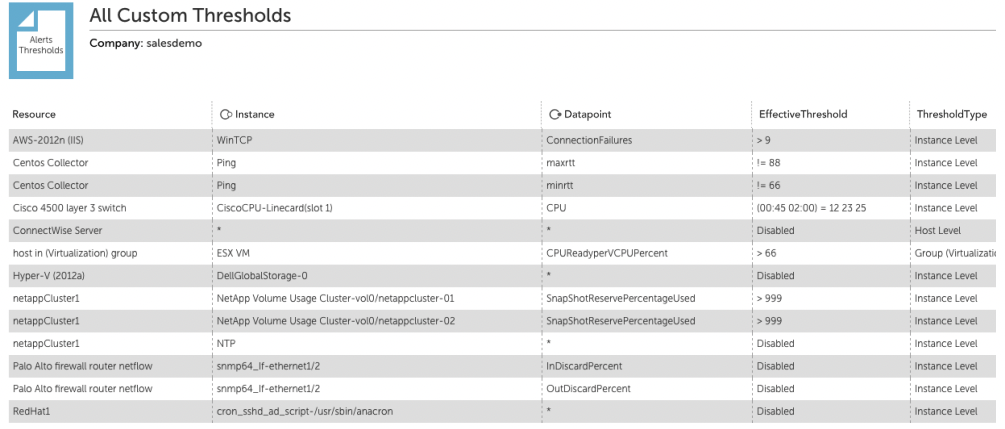
Another helpful report is a report of all the alert thresholds. This is useful for checking the currently set thresholds, but most importantly will show any disabled thresholds. One of the common responses to excess noise in alerting is disabling alerting for a metric or even an entire hosts. This is often done with the intention of addressing the issue in the morning, but often higher priorities can intervene and it will be forgotten until there is some catastrophe that isn’t alerted on.
Conclusion
Modern monitoring solutions can provide a robust infrastructure monitoring framework that can both alert when necessary and avoid alert overload. It is important to realize, however, that even the best tools require careful implementation and ongoing tuning and improvement. This is not only the responsibility of the operations people maintaining the monitoring systems. As new features are designed, careful thought should be given to how they will be monitored. What metrics indicate the normal functioning of the application or the overall system? What are the acceptable thresholds for a given metric? At what point should we be warned and what do we do to prevent the warning escalating to a critical situation.
The complex nature of web and SaaS platforms today means that monitoring cannot be seen as something which operations teams apply to production infrastructure. It requires cross-team collaboration to ensure we are monitoring the right things and alerting the right people. This is the key to a successful monitoring strategy.
LogicMonitor’s unified monitoring platform expands possibilities for businesses by advancing the technology behind them. Sign up for a 14 day free trial.
Want a free copy of this whitepaper?
Updated November 2022. Originally Posted May 27, 2016. Also Updated 2019.
Software Industry: IT Trends, Challenges & Solutions
In this solution brief we explore:
- Trends in software
- Common challenges faced by software companies
- How a modern monitoring solution can help

Download the solution brief
Download this solution brief to learn how LogicMonitor helps software companies speed up the execution of digital transformation initiatives.
Whitepaper
5 Infrastructure Monitoring Mistakes and How LogicMonitor Addresses Them
Enterprise organizations know that they need monitoring to ensure site uptime and keep their business running. Yet, many sites still suffer from outages first reported by their customers. This is often due to small mistakes made with monitoring systems. These monitoring mistakes are easy to make and even easier to overlook, but the consequences are detrimental. Here are some of the most common monitoring mistakes and how LogicMonitor addresses them.
This guide covers:
- The five most common monitoring mistakes
- Best monitoring practices to prevent outages and alert storms
- Proactive strategies for monitoring

In this whitepaper, you’ll learn:
- 5 ways to automate with LogicMonitor
- The role of AIOps in hybrid observability
- Real examples and case studies
Below we have provided the first two mistakes of this guide. To read the full guide, fill out the form above to download.
Download Now
Mistake #1:
Relying on Individuals and Human-Driven Processes
A situation we have seen many times flows a bit like this:
- It is the midst of a crisis – were you lucky enough to get Slashdotted?
- A change is made to your data center equipment – a new volume is added to your NetApp so that it can serve as high-speed storage for your web tier.
- Moving quickly, you forget to add the new volume to your NetApp monitoring.
Post-crisis, everyone is too busy breathing sighs of relief to worry about that new volume. It slowly but surely fills up or starts exhibiting latency, due to high IO operations. No one is alerted, and customers are the first to notice, call in, and complain. Quite possibly, the CTO is the next to call.
Remove human configuration as much as possible – not just because it saves people time, but because it makes monitoring – and hence the services monitored – that much more reliable.
When looking at solution features, consider the following:
- It examines monitored devices continually for modifications, automatically adding new volumes, interfaces, docker containers, Kubernetes pods, load balancer VIPs, databases, and any other changes into monitoring. It then informs you via instant message in real-time or batched notifications, whatever you prefer.
- It provides filtering and classification of discovered changes to avoid alert overload.
- It scans your subnets, or even your hyperscale cloud account, and automatically adds new machines or instances to monitoring.
- It graphs and spontaneously creates intelligent dashboards. A dashboard graph based on the sum of the sessions on ten web servers used to view the health of your service should automatically update when you add four more servers. Automation of this collection and representation ensures the continuity of your business overview.
Do not depend on manual monitoring updates to cover adds, moves, and changes.

Mistake #2:
Considering an Issue Resolved When Monitoring Cannot Detect Recurrence
Outages occur, even when you follow good monitoring practices. An issue is not resolved, though, without ensuring monitoring detects the root cause or is modified to provide early warning.
For example, a Java application experiencing a service-affecting outage due to a large number of users overloading the system probably exhibited an increase in the number of busy threads. Modify your JMX monitoring to watch for this increase. If you create an alert threshold on this metric or use a monitoring platform that supports dynamic thresholds, you can receive an advanced warning next time. Early warning at least provides a window in which to avoid the outage: time to add another system to share the load or activate load-shedding mechanisms. Configuration of alerts in response to downtime allows you to be proactive next time. The next time you experience an outage, the root cause should never point to a repeated preventable event.
This is a very important principle. Recovery of service is the first step, it does not mean the issue should be closed or dismissed. You need to be satisfied with the warnings your monitoring solution gave before the issue, and content with the alert types and escalations that triggered during the issue. The issue may be one with no way to warn in advance – catastrophic device failure does occur – but this process of evaluation should be undertaken for every service-impacting event.

Ready to read the full guide?
Whitepaper
5 Data Center Managers On LogicMonitor and Nagios
The following white paper summarizes the results of detailed interviews with five data center managers who have experience with both Nagios and LogicMonitor. All five have spent years in the trenches managing and monitoring complex environments and facing real-world business pressures.
