Last week I was traveling to and from our Austin office – which means a fair amount of time for reading. Amongst other books, I read “The Principles of Product Development Flow”, Reinertsen, Donald G. The most interesting part of this book (to me) was the chapters on queueing theory.
Little’s law shows the Wait time for a process = queue size/processing rate. That’s a nice intuitive formula, but with broad applicability.
So what does this have to do with monitoring?
If you want to be able to do more than make overly optimistic guesses about how well your systems will scale, you need data about your current performance (service time, queues, utilization) and some understanding of how things scale.
Let’s use Linux disk performance as a concrete example. Disk latency and response time is the performance bottleneck of many applications, so it’s important to be able to understand when you are likely to run into issues. The bad news – sooner than you probably think.
In order of sophistication, the approaches people take when thinking about scalability are:
1: Not do any investigation of bottlenecks until they hit them. This is a surprisingly common approach, but not one we recommend. Having to address performance failures during your heaviest traffic ever (which is of course when they will occur) is no fun.
2: Run “iostat -dx” for a few minutes, see that your drive is busy about 5% of the time, so figure you can do about 20 times the amount of requests before you have issues. This ignores the facts that your selected sample of when you ran iostat may not reflect peak workloads, and that your queues will not scale linearly (see below.)
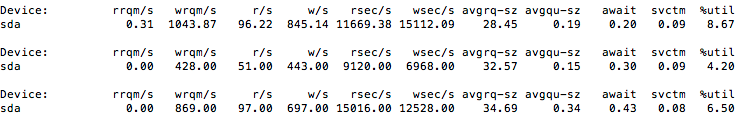
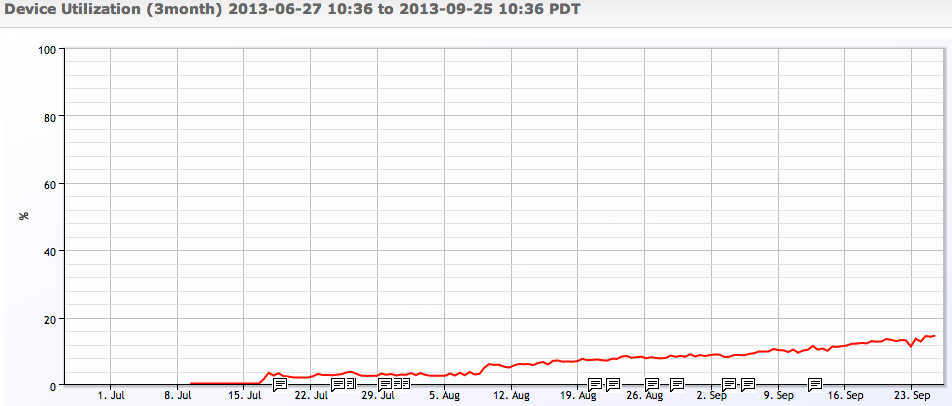
3: Monitor and graph the actual performance of the Linux drives, so you can see how they are performing over time, with differing workloads. (Note: Linux SNMP agents do not expose disk utilization and latency by default, and requiring extending net-snmpd). This will give you good insight into how your system performs under real workloads:
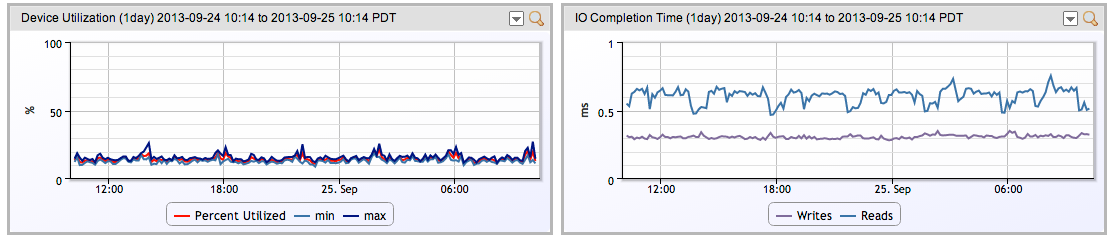
While this will show you real performance through time – it still may mislead you with regard to how performance will scale. The big advantage, though, is that as load scales, you will have real time visibility into how performance is scaling, thus allowing you to correct your (most likely) overly optimistic predictions.
4: A small subset of people will apply queueing theory to the collected data to derive accurate predictions.
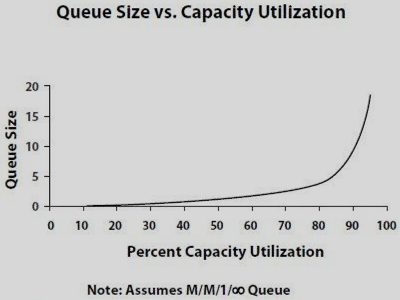
Why will people generally over estimate the scaling capacity they have? Mostly as they assume that so long as they have available utilization capacity, they will have the same response time (queuing), when in fact the service time increases with percent utilization like this:
You can see a real life example of a storage system latency following this path in Visualizing NetApp disk performance and latency.
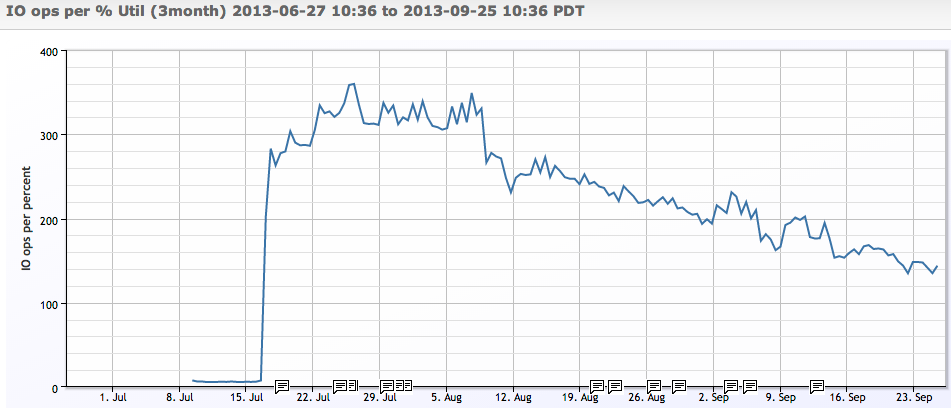
Another example: if we plot the number of IO operations a disk can do per percent of utilization, we see that as the disk gets busier – it does incrementally less IO operations before it’s used up another % of its capacity:
So, the takeaway here is that if you want to get a handle on how well your infrastructure will scale, you need monitoring and data to make any kind of decision. Unless you are dealing with very expensive resources, it’s probably not necessary to apply statistical models to the data – but be aware that it is a mistake to assume linearity in performance with utilization. Keep your utilization under 70%, and ensure you are trending load and performance to watch your workload response in reality, and you should be OK.
© LogicMonitor 2025 | All rights reserved. | All trademarks, trade names, service marks, and logos referenced herein belong to their respective companies.