“Hello, and welcome to the elevate session, why metrics and logs are better than chocolate and peanut butter. Depending upon where you are in the world, some you may know of that brand of chocolate and peanut butter that once you’ve had them together, you don’t wanna have them apart. I believe in London, we call this why metrics and logs are better than fish and chips. So whatever your favorite two things together are, we hope you walk away from this session with an appreciation for why metrics alone are not sufficient, but metrics and logs satisfy you. With me today well, I’m Tom Chavez, the product marketing manager for logs at the company. And with me today is Patrick, who’s our product architect for logs. So we’ll cover a little bit about logs as well as, give you a great demo.
Now if you’re not using logs, there’s a lot of reasons why people don’t use logs. One of the reasons is they might not have access to the their company. They might be used for the security use case. They might not be on the machines they’re using. They might be out on devices.
And finding the person who has access to the logs who’s got the key, is sometimes quite difficult.
Might be that there’s too much volume. If you knew all the devices in your platform that give logs, there’s a ton. Everything from every device to every server to every piece of software, and it becomes overwhelming when you have all those logs and you don’t have a place to put them all.
Some companies have too many logs tools to manage all of those logs and finding the person who has the keys to that tool. Maybe it’s the security person. Maybe it’s another IT team. Maybe it’s a remote team. And getting access to the person and the logs and the time frame that you want are all very difficult.
And when you do have access to all of the logs, then you might find that they’re just too noisy. If you’ve got info logs and warning logs and error logs and security logs and you don’t know the query language for the logs tools that your company is using, then it just becomes an overwhelming task. And what are you going to do in that case?
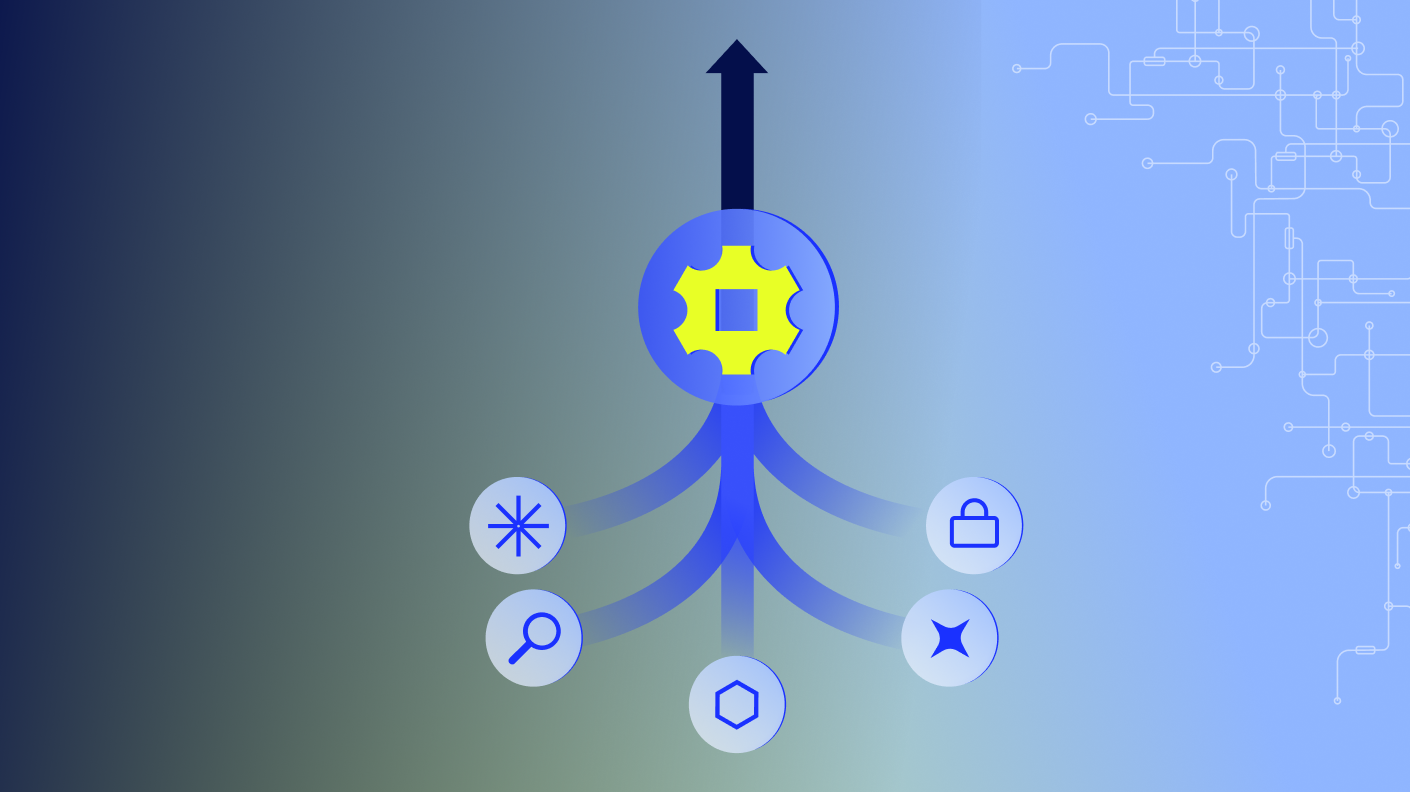
So the great thing about logs from logic monitor, our LM logs and the LM Inspector platform, is that we bring the logs together specifically for the ops team. We’re not looking at the security logs or other types of logs, but we’re bringing the logs together that help you see insights about what’s happening in your infrastructure.
We can deliver an eighty percent faster troubleshooting time and reduce, time to, success because all of your logs are integrated into the platform.
And these are customer statistics. These are not our guesses, but these are numbers back from our customers.
By delivering them in a single platform, we can free you from that ten to forty percent of the time that you spend looking for the person with the logs, filing a Jira ticket, asking for the right time period, going back and asking again that time that you don’t even have the logs in your hands and you’re not delivering any value. That’s such a it’s a painful waste of time. It’s waiting for other people, maybe even another time zones, and it’s just not delivering any value. So we can give you back that time.
And by narrowing the log volume, we can reduce the noise that is in all of those logs. We don’t show all logs. We don’t show overall time. We don’t show overall devices, but we use our AI engine to narrow the logs just to the ones that are relevant to the issue that you’re working on.
The LM logs product streamlines the access to logs specifically, again, just for the ops teams. We’re not looking at security. So that when you see a metric that’s gone red, you can pivot very quickly to the logs that are relevant to that metric. Maybe it’s the CPU that went down or a server or a database, and you’ll see just the insights about the logs that are related to that incident going quickly to root cause analysis.
Our AI engine does do anomaly detection looking for where did a log change from having a normal behavior and data inside of it to something different. Maybe somebody did a configuration change, maybe some metric changed, maybe something that is surfaced in a log. Our AI engine is constantly analyzing the logs looking for changes and alerting you when something changes so that you can detect whether it’s a good change or a bad change or just a a a change to be notified about.
And because we put this all in the single platform along with your metrics and your alerts and your, all of the information inside the logic monitor platform, We give you ease of use by putting it all in a single interface, familiar to your l one engineer, familiar to your l two and l three, and doing the searching and filtering of those logs so that they are already set to the place that an l one engineer can see, again, without having to use the query bar, which we do have for the times that you need a query. But we have it preset to the time around the incident and the time that happened before an incident so that l one engineer is able to quickly resolve something without having to, start from scratch in a query because that’s also one of those things that takes time.
We wanna make the IT teams more efficient, and so we’ve priced this to an IT use case, not to the security who are looking at all of the logs, but we’re focusing on just the logs that are right for an IT team. So we’re not an expensive log solution. We complement the metrics that you’re already getting inside of logic monitor.
Our retention periods are timed for the right use case. So if you’re looking at an application, you might only need seven days of logs. But if you’re looking at something that might need to be kept for auditing, you can keep it for up to a year, and, that’ll satisfy your team that needs to look back that far. If you’re doing root cause analysis, maybe you’re doing it across every month or you’re doing it across a quarter. We also have one month and three month, retention periods.
And all all of our logs are stored in hot storage, so none of them are archived off to disk. They’re not archived off to tape or glacier or such, and you can look at across any of those log sets across a thirty day increment and get very fast results.
And our automated system delivers anomaly detection across those logs automatically without having to write any queries looking for diffs and changes in them.
Our platform, l m and vision, collects logs from a bunch of different ways and places. The collectors that you’ve already got in place are already collecting the metrics from your Windows servers, your Linux servers, your devices, and such.
But we can also collect logs from the cloud through our API, and that might be connecting up to if you have AWS or GCP or Azure or you’re running things in containers.
It also might be for log files that are on disk across your systems, and those could be delivered to us through fluidd and fluidbit or through an OTEL collector.
You might have some SaaS apps that are creating logs, and we can bring those in.
And, likewise, you might have your devices managed from the cloud. So we can connect the devices directly, or we can connect to them through Cisco Meraki and through Juniper and as well, Broadcom, which includes all of the VMware technologies.
And last, if you’ve got another logs product, say you’re using Splunk for security or using Cribl for managing your logs and such, you can send logs to LogicMonitor through our API directly from one of the tools you already have.
And I’ll hand it off to Patrick who will give us a great demo of this in live in LogicMonitor.
Patrick, take it away.
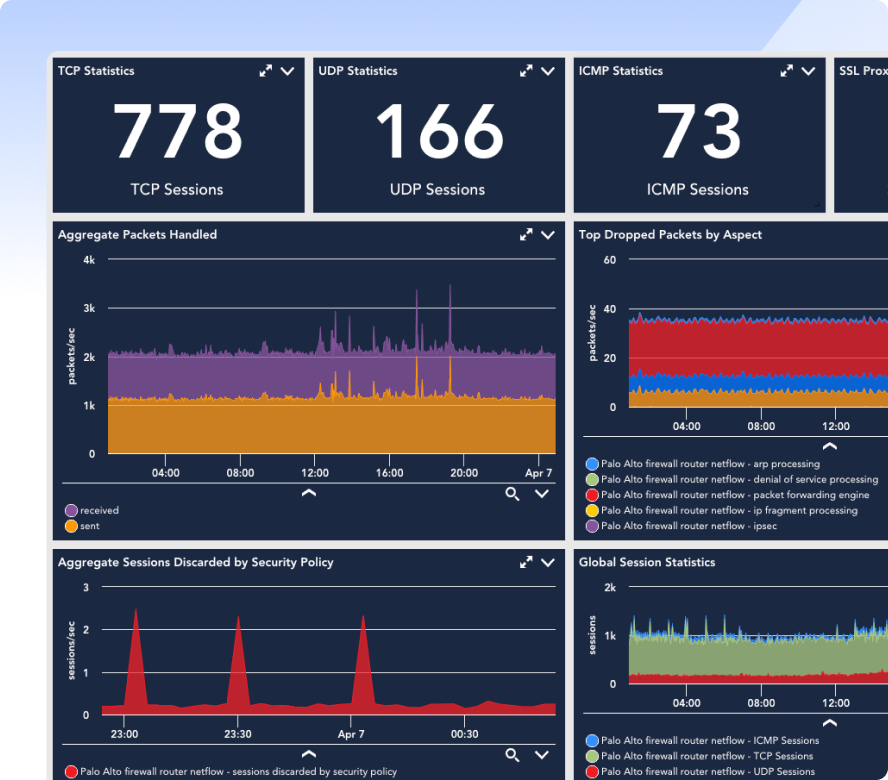
So we’ve triggered an alert here. I’ve got a particular Cisco, firewall that’s giving me, looks like some sort of an IPsec aggregated tunnel type of view. And the first thing we like to demo about logs, is how we use logs in context with our metrics and our alert data, as opposed to running over to the query bar and perhaps, clicking on the logs page and then writing some queries and trying to narrow things down. I’d rather let the, troubleshooting workflow guide me through how to use the log data in context with those things and, hopefully, find out why this is in an, alert state right now. So the first thing that I I tend to like to do is I wanna drill in and I wanna get some additional details on this. So I’m gonna click into warning here.
And now I’ve kinda opened up this, information, and I’ve bounced over here onto my graphs tab. And what I’m doing is the overview basically gives me some information, tells me, basics about it, what’s going on. But I wanna look at some visualizations and understand, you know, what what’s happening here. And I see that things had been working pretty well and have since fallen off, and I’m getting off failures here.
I was not, you know, getting that type of thing before. The logic monitor does a great job of pinpointing, and detecting issues for us, that mean time, to detection. And so we get these pretty pictures that start to tell us about we had data throughput, now we don’t. We had, success, now we have failures.
We had packets, now we don’t. So I’ve got a lot of wonderful data here. But the next step that I need to take is I need to understand why. And this is where, as an administrator, I have a deciding point of how I want to troubleshoot this.
And there’s a lot of different things I could do. I can, go to the server itself or the resource itself, in this case, this firewall.
Maybe I log in, you know, take poke around a little bit at some of the configurations. Maybe I bounce the resource. I don’t know. Maybe I need to look at some of the log data that’s associated with it, but I don’t have a good logging tool where the logs are locked away by this the security team or the SIM or the SOC.
So this is a way in which I can leverage the power of log data and the anomaly detection pieces and the noise reduction we talked about. So what I’m representing here is the purple telling me that I’ve got a few anomalous log events that happened right before my issue started. And so that’s usually a pretty good indicator the logs talk in real time, whereas metrics and pulling are on an interval.
I can see what those are down here, and I can, as a human being, read through five or six things. Right? That’s not, overwhelming. But this is a subset that has been delivered to us with AI and machine learning narrowing down on these unusual things that have occurred.
But there are thousands of log events as we’ll see when we move a a tab over further in the demo. But I’ve narrowed down to just some of the, the the little things that have gone on. And I can kind of understand and scan through these and see a couple of them are warning level. But I can see that that that a tunnel was, was ex was successfully set up.
However, that tunnel did not have a transform set. Okay? That’s probably a problem. And then, oh, guess what?
The negotiation had aborted, and here’s my error. So I have the story to kind of run through here. And the powerful thing about the anomalies here is I narrowed to the oddities, which tend to be the issues, that needle in a stack of needles, so to speak. And I’ve used the AI to transform and kind of spin me through this information, as opposed to great pictures, great visuals.
This is the type of data that uses, the the engine to crank out and show me the things that might be of interest and might be my root cause. In this case, they certainly were.
The next segment of the demo, though, is we’re gonna make an assumption that maybe the screen is blank, and I don’t have any unusual log activity. Or perhaps the unusual log activity was not really related to my problem, and I didn’t find my answer. So I need to do some deeper triage and more investigation.
And on this page, I don’t really care that this is log data. This is just telemetry I care about, and I’m like, this is great. However, let’s get into log data. Now if I come over here to my logs tab, I can now start to look at all of the log information, and that’s what I see represented here.
And as I scroll through this, you can see this is gonna go on infinitely for Windows and Windows. This is thousands of logs that have occurred in this time frame here. I can see the volumes pretty steadily flowing across here. I do see a bunch of repeating repetitive type information.
I can filter and start doing some searches here if I want. This is a very limited search window.
I have full query capabilities on another portion of the UI. But for here, we prefer you not start digging into search real heavily. I’m gonna give you some other AI driven tools and some machine learning capabilities that help put this in a more consumable format. And the first thing we kind of wanna do is maybe I I I narrow the noise or look at the noisiest ones, and so I’ve got a lot of things that look like they were potentially repeating there.
So as I let this run, I’m gonna kinda crank this through, and then I’ll talk about what patterns is doing. And it’s looking at the various tokenization across these. This is the same algorithm that runs across anomaly detection. I’m doing it for a different purpose here.
And that purpose here is I see this is the message and these asterisks represent values that have changed. Right? So this log message is the same. It’s happened eleven hundred and sixty nine times in the last thirty minutes.
But these values have changed, but the message is the same. I look at this quickly and go, this is noise. This is not my problem. So I’m gonna ignore these ones that are in the high count.
And I’m gonna say, I don’t I don’t think that that’s exactly where I should maybe be looking for my problem. Useful. I certainly understand this. Maybe I could use this type of data for something in the future such as, like, log filtering and maybe dropping some noise.
But I think I’d like to look at the things that that maybe haven’t happened as much. And this is where I start to see, you know, some even some access list controls. Like, right, somebody made some, attempts to to change things here. I see it failed to locate the egress. So I’ve got other sort of errors and conditions that are happening. These could be symptomatic and things that have maybe happened in the past, or maybe they’re related to this as well. But this has given me those lesser seen, lesser, lesser, items.
I also see a login. This could be my corporate. This might be who changed, my configuration issue. So these are non anomalous because this person probably logs in frequently.
This service account is probably logging in multiple times, if not, on some sort of a scheduled basis. So not really anomaly driven, but showing me the ones and the twos and the threes, things that have happened less frequently are much more interesting and easier to look at than things that are in the thousands. So when I cross compare the difference between looking at that versus this and an infinite scrolling wheel, quite a big difference. So that’s another example of machine learning and how we apply that and use that kind of in reverse of the anomaly detection engine.
And then last but not least, the fun piece that I like to call it is log analysis. And at LogiMark, logic log analysis means something a little bit different.
So we’re gonna click on this, and I’m gonna launch what’s called a log analysis session.
And this is going to paint some nice pictures for me.
But what this is doing is we’ve built a library of negative or or this this kind of bad words, if you will, naughty words that we see in the logs. And that things like closed, disconnect, fail, terminate, kill, die. We’ve built a library of about ninety of those that instead of making you type those in in a query bar, we make sure that we’ve just captured those, and we’re gonna visually represent those for you in context of the problem you’re trying to negotiate and troubleshoot with right now.
My favorite thing about this is that we actually apply a score to this called sentiment, which is based on the number of negative words we find And, also, if the log level itself is a severity one or or critical, and we add that together and kinda calculate this score. And I’m gonna sort these by worst score. And I I think in our original example, we saw this was really only kind of a warning level event.
However, it it definitely pinpointed where we started to have that failure in around the time that this IPsec issue began. And so I can see it right here that where the negotiation failed, and I see the other surrounding logs, but I started with the worst one. That is the worst one. And then what happened just before that?
What was around that time frame? And so I’ve also narrowed to that same root cause in that IPsec issue, and not having the, the appropriate configuration. So I’ve kind of narrowed my problem here three different ways using three different sets of tools, anomalies, versus using patterns. And now representing these keywords is negative and showing how I can interact with this.
I can also do some things that I like to showcase from this window, or maybe I plot this and see, has this been happening frequently? And I can see, oh, it happened once and then, you know, that’s around the time of my failure versus some of those noisy ones that are happening in the thousands. So that’s kind of a nice thing that I can look at and do. I can also interact with these graphs as well.
So I may say that disconnect is not of interest to me. And so I may choose to exclude disconnect, and resubmit that. And now I’ve kind of just narrowed to failed. And and I see a different sort of slice on the impact and the things here.
So I can interact with these, and I can also create my own library up here with user dimensions and negative phrases. So I can add to this library as well.
Last but not least, if all else fails and I need additional context, the last piece that we like to do, is launch from the alert where I just was at and launch over to the logs tab. And by launching to the logs tab, this is where I can do deeper triage, full query analysis, analysis, regex, parse, create alerts, and do a a variety of things. But some important things of note here, resource name, because I came from somewhere. I’ve already populated that. And secondly, my time frame has been narrowed to where I was. So I flipped here in context to give me that same sort of view and that same sort of look.
So that’s really some useful ways as opposed to just coming to the logs tab every time I have a problem, and it’s blank, and I have no context. And now I must feed it everything, in order to get some value out of it.
So, again, that’s a walk through of the workflow.
Hopefully, that made sense for everybody, and we had some learning about this. Thank you. Thank you.
Patrick, thanks for that great demo. It was great to see how logs and metrics work together in our platform and how we can deliver anomaly detection and patterns and recognize patterns across logs in the platform.
Now before you all go, we have some resources that can help you further in your journey in
educating and and learning how to use l m logs. We have a monthly logs webinar called logs for lunch as well as we have a product power hour every month and every so often we focus on logs. We’ve, here’s a link to the recorded version, called logs have leveled up. We’ve got a great set of blogs, including, a bunch of that have come out recently about logs and how we use our AI engine to analyze them, using it for query tracking.
We’ve got a solution brief. And if you got questions, you can engage with the community over on the logic monitor community. And if you don’t have logs enabled in your environment already, you can contact sales or your customer success rep who will give you a demonstration and help you on sizing the right amount of logs for your environment. And I thank you for attending this great this session.
If you have more questions, like I said, please feel free to reach out to us. And, we look forward to engaging with you on logs and metrics and how they’re better than chocolate and peanut butter or fish and chips or your favorite two items.”