“Welcome, everybody. My name is Brian Whitmarsh, and I’m one of the product managers here at LogicMonitor.
My focus is everything cloud.
Obviously, resource explorer that we’re gonna be talking about today, cost optimization, so cloud related topics.
I’ve been in observability for last twenty five years or so, so I’ve seen a lot of things.
It’s been an exciting space.
And today, I’m very excited to present to you, Resource Explorer. Now if you’re listening to this, you probably, unfortunately, weren’t able to attend, Elevate. I highly encourage it was a great event. I highly encourage you next year to attend.
Or you attended and you just weren’t able to jump into my session because it was packed standing room only. Now there were seats. But, anyways, alright. Let’s get going and talk about Resource Explorer and how it can help you make sense of your environment.
As any good product manager should do, we should start with a problem statement. What are we trying to solve? We’re not just building features here. We’re actually solving problems.
This problem, was pretty aware, pretty, you know, exposed itself when we kind of moved from an on premise focused observability tool, multiple years ago, to be a hybrid. You know? You know? Hybrid is our strength. The ability to monitor cloud and on premise all in one, area together, is a strength of logic monitor.
The challenge, though, is that when you get into the cloud and you get into, example, you know, monitoring Kubernetes, you have thousands and thousands of devices.
In fact, a customer, just enabled, Kubernetes monitoring the other day, and instantly, they got a another hundred and thirty five thousand resources. Resources. Now in our old school tree view where you would, you know, go just like you’re doing a file folder structure, in order to work with those resources, you would expand and this tree would expand. Think of a tree expanding with a hundred and thirty five thousand resources. Not practical. We needed a better way to present and allow customers to create views of their resources, for highly ephemeral, you know, large number of devices.
And, also, we had customers that you know, they got in pretty good with all the different, views and different groups that they could create, but we wanted to have an interface that allowed them to just quickly, hey.
I wanna look at all my resources for this particular application, or I wanna look at all my Azure virtual machines, very quickly.
This was the problem that we were trying to solve because it was very difficult.
In this agenda, hopefully, number one, we’re gonna show you how we solve that use case. But we’re gonna talk about fundamentals of Resource Explorer, talk to you about property normalization, go into some of the advanced settings of Resource Explorer, talk about how we can use this in a knock, in a knock mode, and then also how you can just incorporate it in your existing logic monitor platform into the existing dashboards that you’ve already invested in.
Alright. Let’s get started. Let’s talk about the fundamentals of Resource Explorer.
I I like to lead off with this kind of I like to tell stories. So let’s lead off with this story of what is Resource Explorer. If you think about when you’re shopping or you’re in a mall or something, you have different storefronts as you walk by in the mall. And you look at those storefronts, and they are highlighting at a high level, what they are about, what they are selling.
Resource explorer is that kinda high level view of the resources. It gives you some, you know, green, red lights, instantly, but it’s not the all the details in your face. So it’s, you know, the clean presentation of the resources that you are observing. And we are not a replacement of the tree view. The tree view, you can get very detailed with resources.
It’s really meant to be that tree view is behind the scenes. Like, when you go to Apple iStore or wherever, you go in and you’re like, you got a broken laptop, you bring it to them, the magic wall opens up when work needs to be done and, you know, behind the scenes. That’s that’s the resource tree if you can imagine that. But resource explorer, again, is that storefront view, a quick glance of, you know, is this what I’m interested in? Is there anything interesting here, that I wanna be able to see?
Now a key, like, key fundamental icon or object for Resource Explorer is the famous hexagon. Now everybody has these. Right? It’s a beehive view. It’s what you can take and see all of these different resources. And the colors represent the status, the air status.
So for example, if everything’s green, everything’s hunky dory, that individual resource and each hexagon is an individual resource, has no errors. Now the errors that we’re displaying are data point alerts by data sources. These aren’t event sources. These aren’t log sources. These are really focused on those, data sources.
And so, yeah, there’s yellow. And if you have a yellow or let’s say you have a critical red, that resource could have other alerts, but we show the most critical alert, at this time. So if it’s red, like I said, there could be other alerts, but we wanna show you the most critical and represent that by the color.
Now this interaction between resource tree and resource explorer, they’re meant to be brothers and sisters back and forth. And let me just give you an example. I know we had a customer that was like, well, you know, I’m I’m old school. I’m set in my ways.
I really you know, I just wanna use the resource tree. I’m familiar with it. We’re not trying to replace resource tree. We want you to interact with the resource tree.
And at times, it’s gonna be better for you to jump over to a resource explorer view to represent those, resources.
And then when you wanna do hard work, like, you know, the wall opens up and you go back into.
So let me just show that to you.
Alright. In this demo here, we have our tree view, traditional tree view. And let’s say that we wanna look at all of the resources in one of our corporate offices. In that corporate office, let’s go ahead and just go to the Los Angeles, California corporate office. You expand it. This is a demo environment. There would be a ton of different resources here when you expand this.
But we want to just quickly represent all of those resources, and I wanna see it in a graphical view. I wanna see it in the new resource explorer view. So if you haven’t done it before, this little triangle here, click on it. Be courageous. You’re not gonna break anything. You click on it, and what it does is it takes you and it takes all the filters you need for where you were in tree view so that you can see all of those resources.
And you see that the filter in blue has already been included. And, you know, you have a number you have seven resources here. You have firewall. You have hypervisor.
You have virtual machines and so on. You have a router, blah blah blah. And then when you get down to the there’s actually one of the, Cisco physical servers has an error status.
And then you can obviously click on that, and then you can click back into you know, you can do some high level, looks here.
But if you wanna start doing more work, you just click on it. It takes you back specifically focused on that one resource back in tree view, and you have all of the stuff you’re familiar with, the graphs, the overview, the information, SDT, all that kind of stuff, taking back, and now you’re you’re filtered on that one specific resource. So it’s go back and forth. It’s meant to be, interactive and meant to augment the resource tree view.
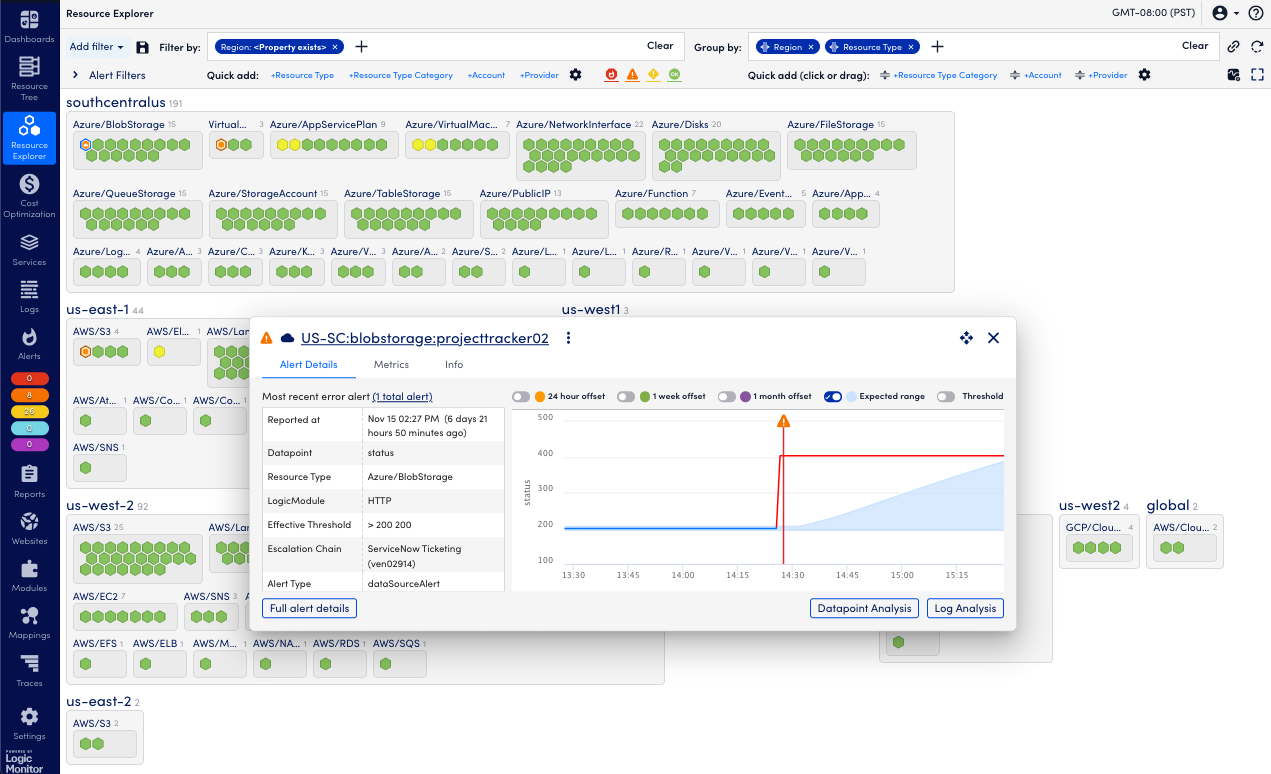
Now another fundamental principle of Resource Explorer is that ability to quickly filter and group by. And we can filter and group by any l m property or cloud tag. When you go into a resource, you click on the info tab. You know, you normally have a whole bunch of metadata.
All that metadata is available to you. So if you wanted to, like, you wanted to see everything in US west too, you could do system dot AWS dot availability zone. If you click if you enter that in there, that’ll be available to you, and you have the ability to filter by that or group by that property. So anything that is available that we are collecting information for.
So a quick example here. I open this up. I see my twelve hundred resources.
I wanna quickly start doing some filtering of those twelve hundred resources.
And the quick ads are these things right here. Just things that you most commonly use. Now these are behind the scenes are normalized properties. We’ll talk about that here, soon. But I wanna go ahead and filter by, let’s say, maybe just by AWS and my on premise resources. So I can click on provider, and I can now it lists the providers that I can filter on that are available to me, and I check AWS, and I check regular. Regular is on premise.
And then I click away. And now I’ve taken this twelve hundred resources, and I filtered them down to just the resources that are AWS and on premise. And now I also wanna group them so I know which one they’re in. And so I go over to the right hand side there. I can click on that same quick add provider, and it will filter you have two boxes. Now you have your on premise devices and you have your AWS cloud devices.
You could take it one step further and just add region, and that’s a normalized property. We click on region, and now I know inside of AWS the different regions that those resources are in.
Use case here, we’ve you know, you can quickly go in.
We had a, our cloud ops person, was managing our system, and we started to get a bunch of alerts, was able to quickly go to a view, and instantly, the problem was one of the regions was going down.
So in this view, if you saw everything in US west two turning colors, you you can quickly get to root cause and say, wait a minute. There’s something going on with that particular region. So, the ability to filter and group by, however you wanna see the resources.
Save views and links. You these are ways to take those great new views that you’re playing around with that are adding value and are showing you the data the what the way you wanna see it and be able to share those or be able to save those and and recall those very quickly. One, best practice for you would be create a a group, a, a save view that’s all resources that has no filters. They’re saying quickly get back.
You can do clear, clear, blah, blah, blah. But for one step, you can just say, okay. Go ahead and click on all resources, save you, and blah. I’ve got I’m back to normal.
Now I’m gonna create a view for you that’s valuable.
And, the use case here is accounts payable. It’s like, I got a bill from logic monitor, and they’re saying that we have x number of, IS resources and past resources. Is that true?
Let me show you how you can figure that out.
Now there’s multiple ways to figure it out. Obviously, there’s a usage report and so on. But if we go ahead and go ahead group by, there is a property called system dot cloud dot pricing category.
And when you group by that actual property, there are those are those known computes, IaaS, PaaS. If it doesn’t have that property, it’s not a cloud property. So I’m gonna go ahead and just filter out things that don’t have that property so I can, again, click on the filter by, and I can click on that, system dot cloud dot pricing category.
And I can now instead of include, I’m gonna switch over to exclude that one property. So I’m excluding anything that doesn’t have that property, which would be non cloud resources, and now you see your buckets. You see your non computes. You see your IaaS, your PaaS, and your no chart buckets.
And then we wanna go ahead and save that.
So you click on the little save icon there, and that’s where we allows us to save the view.
Enter in a different name for that, cloud license view, whatever you want, and save as new. Now I have that view available for me to quickly drop down and recall that view.
Accounts payable was asking the question.
They have access to my system. So what I now I wanna do is share this view to someone else.
Now this may be obviously a a view of your application, and you’re sharing it with app owners, those types of things.
But for this use case, accounts payable is like, show me those. And so you come over to the right hand side. There’s a little save link or copy link. You click on that.
It copies a URL, and then you can send that URL. Whoever gets that URL puts that URL in the browser, clicks on it, hyperlink, whatever. Boom. They get to see exactly what you just saw, to be able to provide the evidence that they needed.
Group and individual summaries. Go in here.
These blocks can be clicked on, like the IaaS group, the PaaS group. If I click on the IaaS group as a whole, the box itself, the summary the information below in the little box is going to be a summary of the information.
We do some analysis to look at the alerts that are in there and say, wait a minute. You might wanna group by region because we see that the region is making a difference. Seventy five percent of, the issues you’re seeing are in one particular region. As you’re troubleshooting, you may, you know, just click on group by region. It helps you kinda where to go next, those types of things. But you have an overview.
You have resource view. Again, this is a summary, so it’s all of the resources, in that box. And then you have all the alerts for every resource in that box.
Now if I then highlight an individual hexagon, one of the beehive views there, and I click on an individual resource, that first one, now the summary box, the panel, is all about that individual resource.
And I can see a lot of good summary information, and, obviously, I can click go back to tree view and whatever I need to do.
Alright. Let’s jump into section two here, which is property normalization.
If you didn’t know about it, we’ve done a good job of hiding this feature.
It’s a great feature.
We’ll make it more apparent here, in the very near future. But this allows you to take and the example here is a use case where I wanna be able to sort by account ID. Now I’m hybrid environment, multi cloud environment. I have accounts in AWS. I have accounts in GCP. I have accounts in Azure.
I just I don’t wanna enter every single one of those properties. I just wanna say account ID or account.
We have the ability to say, this property actually represents these three, four, five other properties. I can associate a single property. I can normalize it and then say, when I wanna filter by account, I don’t have to specify that it’s this property for Google and this property for Microsoft and so on. And this can be done for multi for cloud, for on premise, and, cloud resources. It really gives you that ability to create, representative properties for what, you know, matters to your business. Maybe you have a cost center that’s made up of these three or four different properties. I can create a very simple cost center line or whatever you wanna do, gives you that ability.
The quick ads are really just out of box normalized properties. They don’t have to be normalized properties. They could be individual properties, but you can very quickly edit, modify those quick ads, a little cog here next to the quick ad. You click on it, and it gives you the ability to modify what is actually in those that list of, quick ads.
And if I wanted to say, I could delete any of these. I want to have a new one. I want application to be in there. I just type in the property, start typing in the name of the property, and then apply.
And now that’s added to my list.
And sure enough, I have it as a quick add and available for me to just single click for filter by or group by.
And these are independent.
You can you know, you may group by things over and over that are different properties than you actually filter by.
Now where do you go to I want a new normalized property or I wanna create my own. Like I said, we hide it pretty good.
Right now, you have to go to settings.
You have to go to portal settings, and then you have to scroll all the way down in portal settings to actually get to the normalized properties. If you don’t see this, there’s also the chance should be a slight chance that it hasn’t been enabled for your portal. It should be enabled for all portals.
If you don’t see this, contact your, account representative. We’ll get it enabled for you, but it should be enabled for everybody.
But I did run into that the other day.
Anyways, you come down here. You see those associations.
And the ones that you can’t delete, the, you know, the ones that are grayed out just means that they’re reserved ones. We’re not you know, we wanna keep those standard across all different portals. But the ones that you can delete are ones that you have customized or can be customized by you. And to add a new one, you just click the plus, and then you name it.
This one’s gonna be app. I already have application, but this is a demo. And then I search for the properties that I want to associate with APP, with app. And, because the Azure tag is different than the AWS tag, it’s different than the GCP tag, but I don’t care about that.
I want you to just be able to filter an app and see the list of apps that we are actually using.
And then I save that, and it’ll be available for me to use, throughout the platform.
Now let’s get into some advanced stuff here.
I got three advanced settings we’re gonna go over. And the first one is what I like to call VCR mode.
Now I’m old, so, you know, whether you had a a VHS or a Betamax, I won’t, you know, I won’t judge you at all.
But, anyways, let’s talk a little more modern. Maybe this is a DVR. Maybe it’s not even a DVR. Maybe you are, a YouTube watcher, and you have the little scroll bar on the bottom of the play where you go back and forth.
That’s what this allows you to do for alerts in resource explorer. I can say for a time period, tell me if that alert was happening in that time period.
And so an example of that would be in this view, I have a view of all the resources for my BW app.
So I’m filtering out a particular app. Those are all my resources for that app.
You notice that one of the computes in Azure for my app, has an error.
Now by default, it’s all time. So it just gives you that error status for all time. But if you go in to advanced filters here on the left and you drop down the little arrow, you can say, I want to say in the last hour.
So from the last hour to now, was that status was that error status happening?
Nope. It’s green. Okay. Interesting.
Now I can say, how about the last two hours?
Nope. It happened further back than two hours.
I’m gonna bore I’m not gonna bore you with all you know, click on every single one.
It happened within the last two days of when I recorded this. And so when I click on two days, sure enough, there it is. But now I may wanna say, did something lead to this? Was there were there other resources that were in an error status before this resource?
And I wanna be able to do a custom time frame. So I drop it down.
And first of all, I look at that just so I know when it happened. I’m cheating here. I look at this for that resource. I can tell that at fifteen, sixteen military time for you, folks, dropped two off of it and dropped to ten.
So at three sixteen, at three fifteen yeah.
Three sixteen is when this error occurred. So I’m gonna go back an hour before that error. So I can drop down the list, and I can say custom range on that day.
I think I recorded this on the or, yeah, on the twenty second. So two days ago on the twentieth, I can go from a particular window of two o’clock to three fifteen. Now it happened at three sixteen, so it should be green.
But was there something else that was starting to happen? Now that demo anyways, this is a demo.
You may have had other resources that’s were yellow or red or that may have it may have been a chain reaction. So you can, like, a VCR, DVD, whatever you wanna call it, you can play it.
Now I wanna include the time of when it happened to an hour after maybe it impacted other resources. Maybe there was downstream effects. So I can change it from three fifteen to four fifteen.
That’s when the error occurred, so it changed yellow. Other devices didn’t. But, anyways, you get the idea. It’s that VCR, that playback, of those specific resources.
SDT, I’m not gonna show you demo.
It’s simple. If you are in, scheduled downtime, don’t show me ugly colors because I expect it maybe to be unavailable, whatever. Just set the flag. If you set the flag, ignore alerts in STT. It’s always gonna be green.
This is a cool one.
This gives you the ability to if you have a view let’s say it’s on a big screen.
I’m gonna show you knock mode next. But let’s say this resource is always in error status, and that error status doesn’t really matter. It I’m I’m sick of getting woken up or called, or why is this resource in error status? Well, it’s a particular error that just is always there, and it’s not important.
So let’s go ahead and filter that one out.
If I click on it, I see that the actual logic model, it’s resource health. Now I don’t recommend that you ignore resource health. It’s a pretty important one. But for this demo, we’re gonna ignore it.
And I see that the data point is availability status error alerts. I can, with advanced filtering, I can drop down advanced filtering. I can say alert data points. I can say exclude, and then I add that logic module.
So search for resource health.
I find it.
I click on it, and it has a number of different metrics that we collect.
And I want to ignore availability state error alerts.
I also had to ignore availability state because both of them were in error status.
So I check on both of those.
Again, don’t recommend you do this. But for this demo, we check them both, and we say exclude, and voila. Everything’s green. Magic. This gives you that ability to customize the view, especially when you have certain alert data points that you wanna focus in on that either ignore them or maybe you just wanna focus on them.
That is advanced filtering functionality.
Full screen mode, I mentioned this a little bit before.
Knock mode, whatever you wanna call it. You’ve got a pretty view now with resource explorer, just what you wanna be monitoring. You wanna put it up on a big screen and have it auto refresh, or maybe you wanna have it on your CEO’s desk.
Probably not.
Anyways, you wanna be able to just create the view that you want, and then you wanna be able to click on the over on the right hand side, full screen mode.
Comes into a full screen mode, auto refresh is on. You can see the last update, so it just keeps that continuous update of those actual resource views.
Last section here, let’s talk about dashboard widgets.
You wanna just incorporate these into your existing LM dashboards that you’ve invested in. Yes. We allow you to do that. All the reporting, you know, everything that comes with our dashboarding, platform component is included in this.
So we go here. There’s two different ways to do it. I’ll show you both ways. I got a view here, pretty view.
I just wanna make that a widget.
So I go over to the right hand side, add to dashboard.
I pick which dashboard I wanna add it to, and voila. I’ve created a dashboard.
Probably not gonna you you obviously have a dashboard that has more than just one widget.
You would incorporate this, like, here into an overall dashboard, for whatever your application, your system, or whatever you’re monitoring.
The other way to do it is just through dashboards. It is a new valid widget. Click on a add widget and you see resource explorer down here. You click on it.
You name it. You have the ability to say how often do you want it to be updated.
Then you can actually load from a save view. You can load from a shared, URL link. You have that URL link that I showed you before, or you can go ahead and just manually create in all the filters, group by, filter by views that you want, right from this widget.
Get the widget the way you want it, add it to the appropriate dashboard, and voila.
You have it there for, that dashboard.
Alright. In recap, gone through some fundamentals, gone through property normalization, one of the great hidden secrets. Hopefully, you’re using it. If not, you should be.
Advanced filtering, what can you do from an advanced perspective, full screen mode, and then how you incorporate this into your existing, dashboards that you’ve already spent time on.
Hopefully, this was valuable for you. Feel free. If you have questions, reach out to us. Take the survey.
You can say Brian did an awesome job or Brian did a terrible job. Whatever. You can just be honest. But, yeah, you can click on this, take picture of this, and we’d love for you to provide some feedback.
And if you haven’t had a chance, you can also listen to some of the other recordings. It was a great session. I highly encourage you to go in person next time and, learn a lot about what we’re doing and get to interact. We had a we had a great time. So, hopefully, we get to see you there next year. Thank Thank you very much for your time.”