“Hi, everyone. Thanks for joining today’s Elevate session on wireless network troubleshooting. I’m Patrick. I’m from the logic monitor product team. And today, we’re gonna be talking about what’s changed in the wireless over the past ten years and how you can use logic monitor to help troubleshoot your wireless networks.
Over the past decade, wireless networking has transformed quite a bit. It used to be that having rock solid wireless networking in your office was a convenience, but now end users are expecting mission are expecting mission critical wireless capabilities.
Things that have changed over the past decade, management of wireless networks has gone from using on premise wireless controllers to cloud based management technologies like Cisco Meraki and and Aruba Central.
Along with that, three new wireless standards have emerged over the past decade from Wi Fi six, six e, and now Wi Fi seven.
Enterprises are building wireless first offices where there is no option for, wired connectivity to in each cubicle, there’s only wireless connectivity.
And along with that, each end user typically has more than two devices. It used to be that you had a laptop that you would connect to the wireless network. Well, now end users have a laptop. They might have a tablet. They have a smartphone. And then there are myriad of other devices that are connected to the wireless network, whether it be IoT devices, smart cameras, and the like.
So while it used to be just a convenience to have rock solid wireless, everybody expects the wireless to be to be working all the time.
But now I I’d like to transition to story about Sally. Sally is a marketing manager at Anytech, and she spends most of her time during the day in and out of different meeting rooms, in common areas, meeting with customers and prospects, but not unlike other days. Today, she’s having a particularly difficult time using the wireless network.
And Jake, her coworker, is also expressing his frustration to Sally, her his manager, saying, hey. You know, why is the Internet why is the network so bad? You know, what can we do about it? And, unfortunately, Sally, Jake’s manager, is, you know, booked back to back meetings. She’s got customers in the office. She doesn’t have time to reach out to IT to let them know that she’s that she and her team are having problems using the wireless network.
So what do end users do when they’re faced with this dilemma?
Not unlike most employees, they end up just dealing with it and slogging through their day.
So Jane is frustrated, Jane’s team is frustrated, and productivity is impacted. So not a good situation.
But what what if it could be different?
What if when Jane and Sally and their team are having issues like this, rather than wondering what IT might do about their issues if they report it, what if IT proactively reached out to Jane and said, hey. We noticed that you’re having a poor wireless experience, so we’re investigating already.
So while while Sally and her team may still have the same wireless issues that they had before, the, experience is quite a bit different because now Sally’s surprised that IT is proactively reaching out to her, and they’re already investigating it without her having to do so.
So what do we do at logic monitor to enable this sort of experience where IT can proactively look after solving customers’ problems or employees’ problems before they, before they get to the point of frustration?
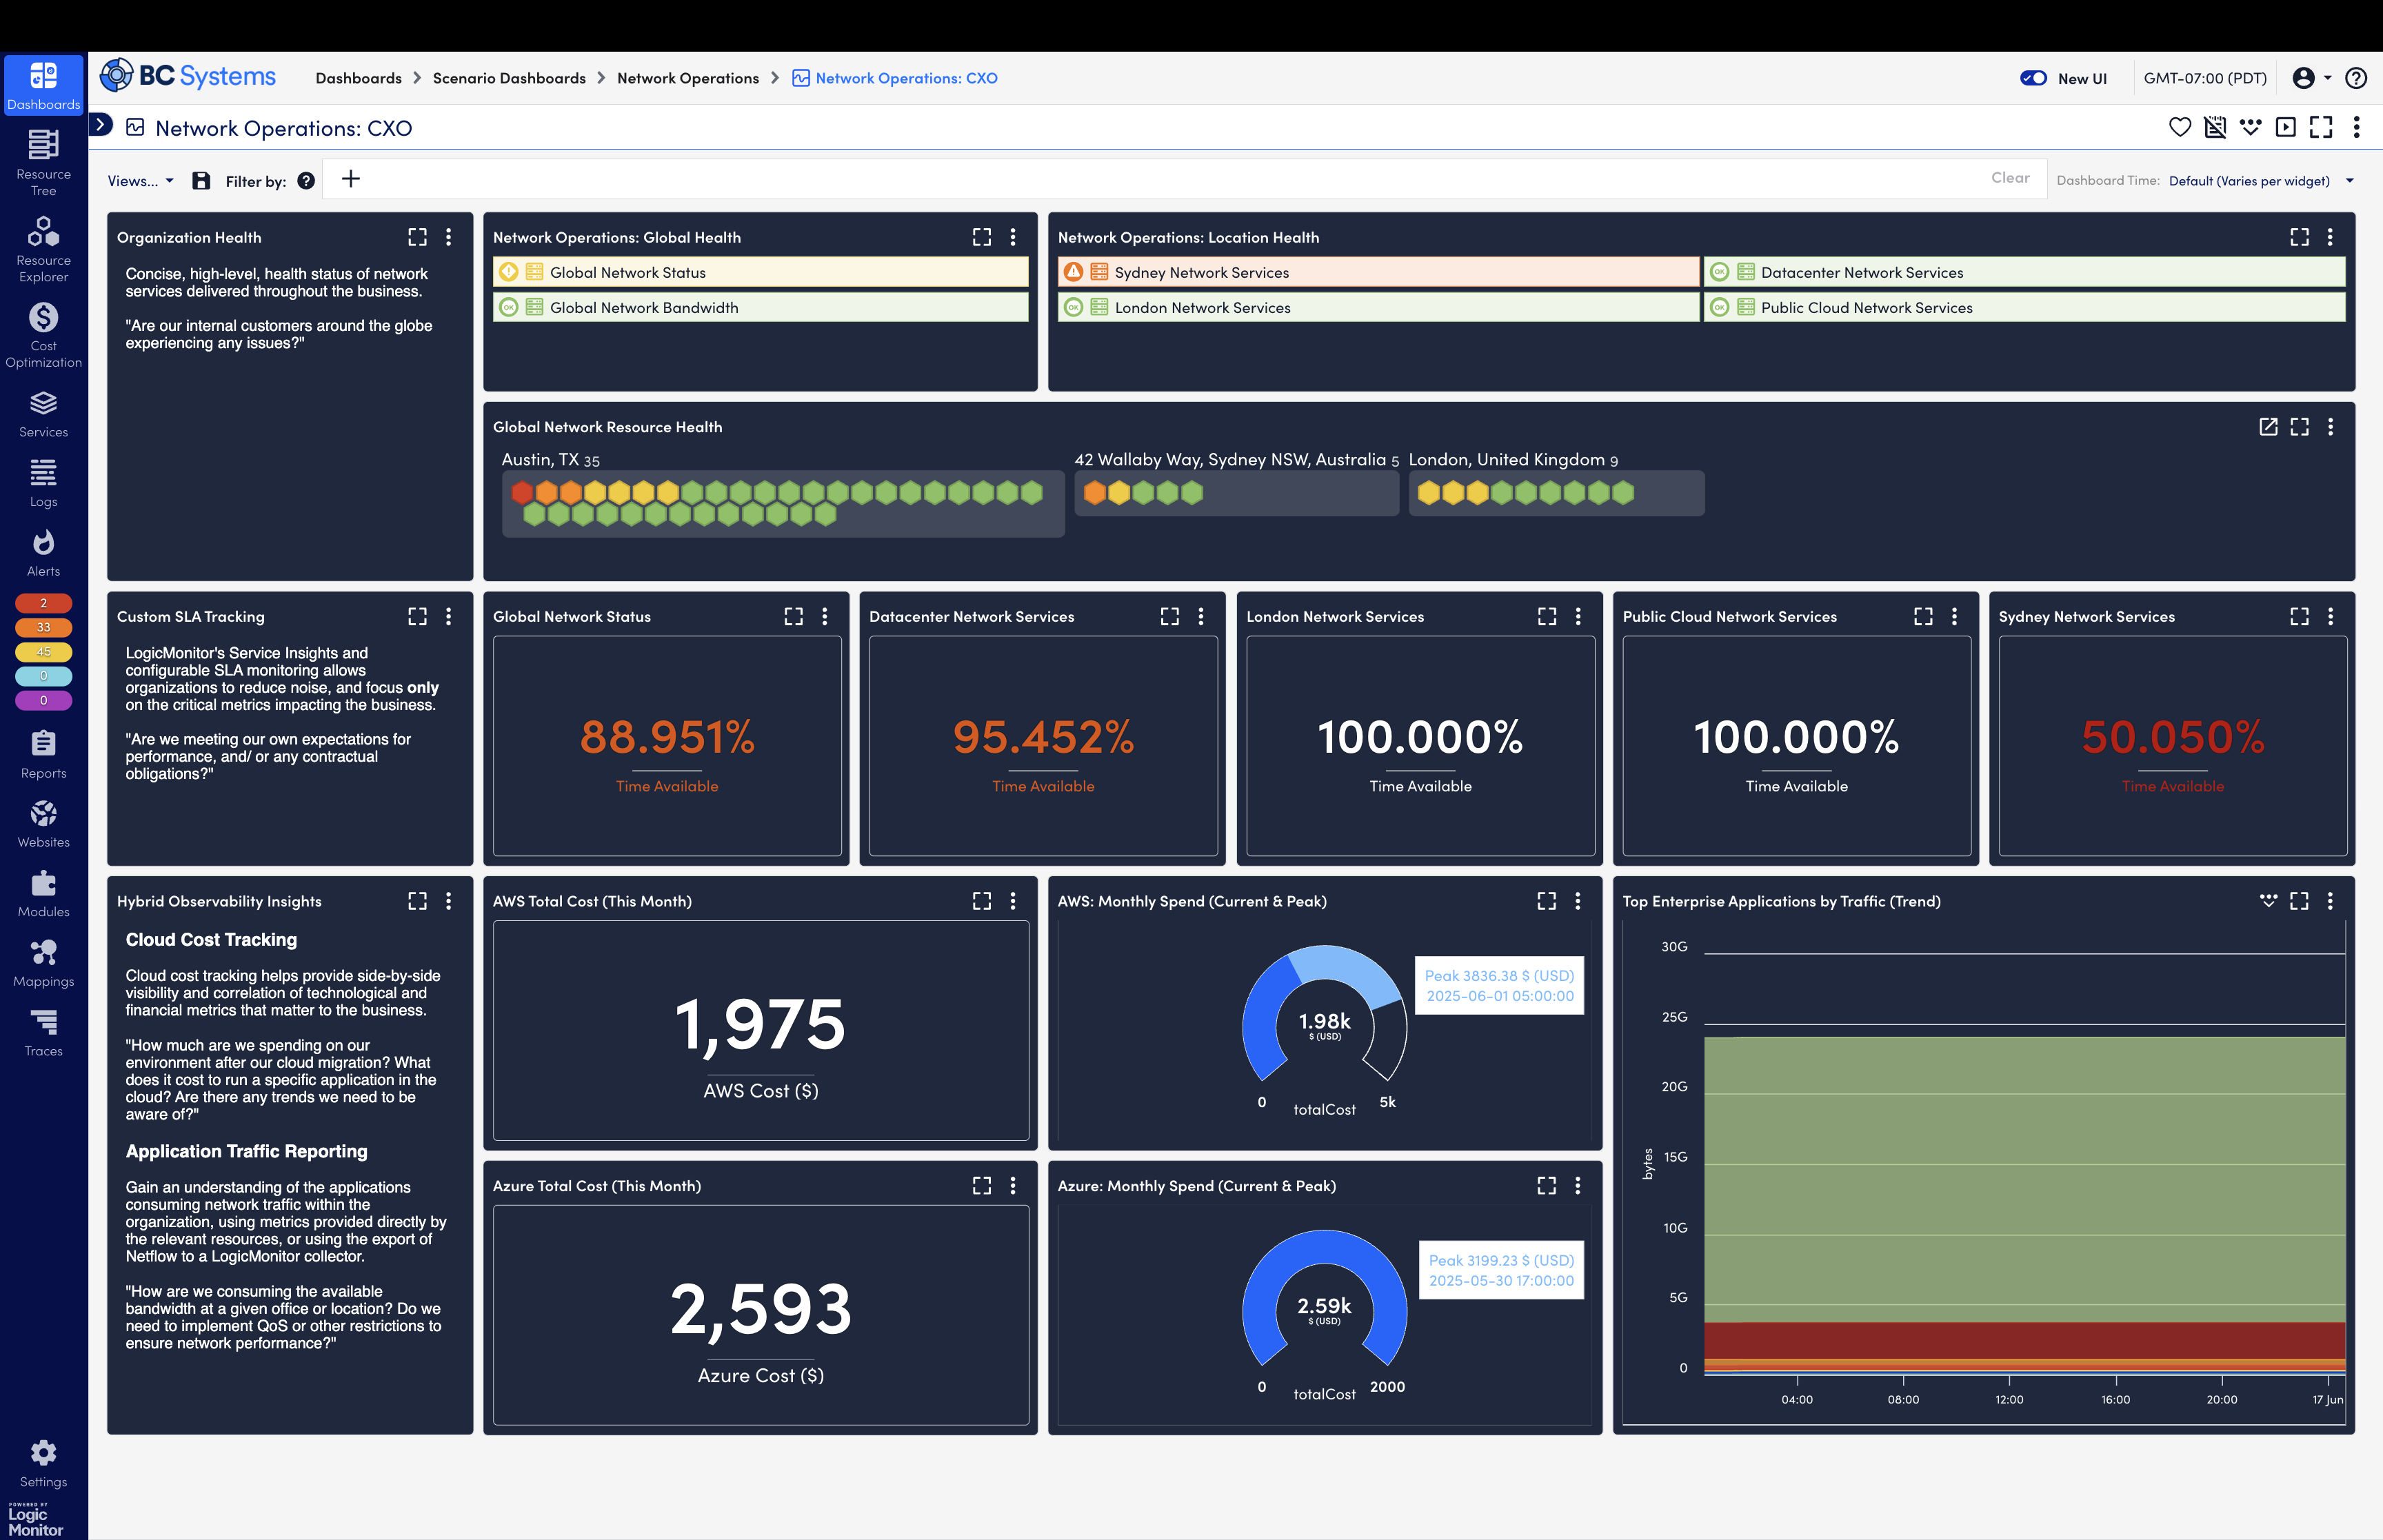
Now if we look at a typical dashboard and logic monitor, in this case, we’re looking at Cisco Meraki, we see a lot of device based information. We see the health and performance of wireless access points, the access switches that they might be plugged into, the security appliances or routers that connect them to the Internet, the health and performance of each of these devices, the usage of the network.
But this is all very device centric stuff, but there really isn’t anything that will, give me any clue to if Sally’s experience is impacted or not. There’s so there’s no information here about end user specific things.
But when we start talking about end users, a key performance indicator is usually the signal strength of the end users connection.
So how do we go about getting that sort of information into logic monitor?
Well, first, we need to understand what is the signal strength. So when we look at an end users wireless connection, we have received signal strength or the signal strength indicator or RSSI. You know, this is a measure in decibels. That’s the top level top level indicator that we’re looking at.
And then we have the noise that’s on the wire, and this could be environmental noise from, from metal and walls. It could be, background noise. Imagine you are at a, at a concert and you’re listening to the band play, but the crowd itself is noisy or maybe there’s something going on next door and you wanna be able to hear the band. Your options are either to have the crowd be less noisy or to have the band turn up the amplifiers.
So imagine the amplifiers are your signal strength. We want that to be as powerful as as high as possible, And we want the noise to be as low as possible, but we’re only in control of one of those. We’re really only in control of the signal strength. So the signal to noise ratio is the difference between those two.
The difference between the signal strength and the background noise or the noise floor. And and according to Cisco, the you know, to have a good connection for voice, we need a signal to noise ratio of twenty to twenty five decibels or higher and for data traffic, twenty or higher. So this for the sake of this, we’re gonna talk about trying to get to, signal to noise ratio of at least twenty five or higher.
So how do how do I get that into logic monitor now that we know what signal to noise ratio is and what the receiver signal strength indicator is.
Well, if I’m looking in my in my Meraki application, this is this reading I took as I walked as far away as I could get from my house to where the signal strength was was tapering off, and I was getting disconnected from the network. And I can see here that the signal strength is only three decibels.
However, when I’m standing right next to wireless access point, the signal strength is almost sixty decibels. I think it was about fifty eight.
So three really bad, fifty eight really high.
But what if I want how do I get alerted when the signal strength is is low for Sally or for somebody specifically in logic monitor?
Well, the the, syslog entries that come into logic monitor from a wireless access point might look something like this. And I can see that I have the receiver signal strength indicator, but I don’t have a measure of signal to noise ratio. So I’m using the RSSI as a proxy for the, for the, end user’s experience for this specific case.
There are other things you could look at, but in this just to show what can be done, we’re gonna look specifically at the receiver signal strength indicator.
But I don’t wanna have to look through every Syslog entry to decipher where the or to identify and decipher where the, signal strength is. So inside of logic monitor, I wanna get something like this where I can actually get an alert. And here I can see I have an alert condition where it says the the client RSSI. If it’s less than twenty five, I want to get an alert.
And if it’s more than twenty four, I want to clear the alert. And for this, I want it to be end user specific. So I want the alert to be cleared only if Sally’s signal strength goes above the threshold, and I want it to alert only if it her signal strength is lower. So I wouldn’t want I wouldn’t mind want my alert to be cleared if if Sam’s signal strength is higher, but Sally’s is still bad.
So how did I set this up?
Inside of logic monitor, I created a, syslog based log source. In here, I parsed out fields like client RSSI, and I used regex to parse out. I remember in the in the previous slide where we had the RSSI equals to fourteen and this one I have RSSI equals twenty one. I just want the integer. So here I just want the the twenty one. So I use regex to parse out just that, just that integer.
You can see I have a bunch of other fields here that I that I parsed out as well so I could get things like how long it took to connect, how long the authorization took. In this case, I’m looking specifically for the signal strength indicator. So here I’m gonna parse out just the integer so that I can alert on that value.
When I’m in l m logs and I search for something like any message that includes RSSI equal to, and here I’m gonna just click on, log a message, and I’m gonna create an alert condition.
And then I can set in my alerting condition. So here I’m saying if the client RSSI is less than twenty five, I want to trigger an alert.
And then my clearing condition, I can say if the client RSSI is greater than twenty greater than twenty four, I wanna clear that condition.
And at the bottom, you can see that the log metadata field that I’m pulling out is the client max. So that’s actually what I’m triggering on. So this this, alert condition is specific to a specific client MAC address. So, again, it’s it wouldn’t be for any, for any client device. It would be just for a specific, client MAC address.
However, we went through all these steps so that I could trigger an alert on the signal strength, but I had to parse through information that’s in the syslog.
I had to, use regex.
I had to set up, specific thresholds of when I wanted to alert and when I wanted to clear it. But that’s a little bit complicated. So I’m wondering in my head, is this the only way that we can alert on end user specific information inside of logic monitor when it comes to wireless network wireless networking?
And, yes, there is another way that we’re working on. So if I, again, look back at my Cisco Meraki dashboard, there are options to alert on when clients have a poor signal strength. So here I can say if if clients on a given SSI SSID with a low signal quality, if that signal quality and I believe the default setting is thirty minutes, but I’ve said it. If if anybody on Sally’s team has a a poor signal noise ratio for more than five minutes, I wanna get alerted on it.
But, again, how will that information get into logic monitor? Well, we’re just finishing up the the capability for this where you can use webhooks to send this information into l m logs. So you wouldn’t have to set up the thresholds anymore. You could just alert on the existence of one of these messages coming into logic monitor.
And that’ll look something like this where I can alert on things like poor Wi Fi signal, if somebody walks in front of a camera, if there happens to be poor air quality, if there is a security alert, or if, as an example, a link, link speed changes on one of your switch ports.
So this will be yet another way to get telemetry into logic monitor by way of webhooks rather than today where we have the options for syslog and for rest APIs.
So you can use the methods that I showed today. You can ingest the information via syslog. You can parse out the information and set up alerting on the signal strength or any of the other, items that are in the syslog.
And in the near future, you’ll be able to do that, via webhooks, whether it’s with Cisco Meraki or different, cloud management technologies.
Thanks for coming today’s session on wireless network troubleshooting. And thank you for coming to Elevate.”


