
AI Observability in One Platform
Unify every signal across your AI environment so you move from reactive firefighting to strategic, data-driven decision making.


Unify every signal across your AI environment so you move from reactive firefighting to strategic, data-driven decision making.

AI Observability Platform
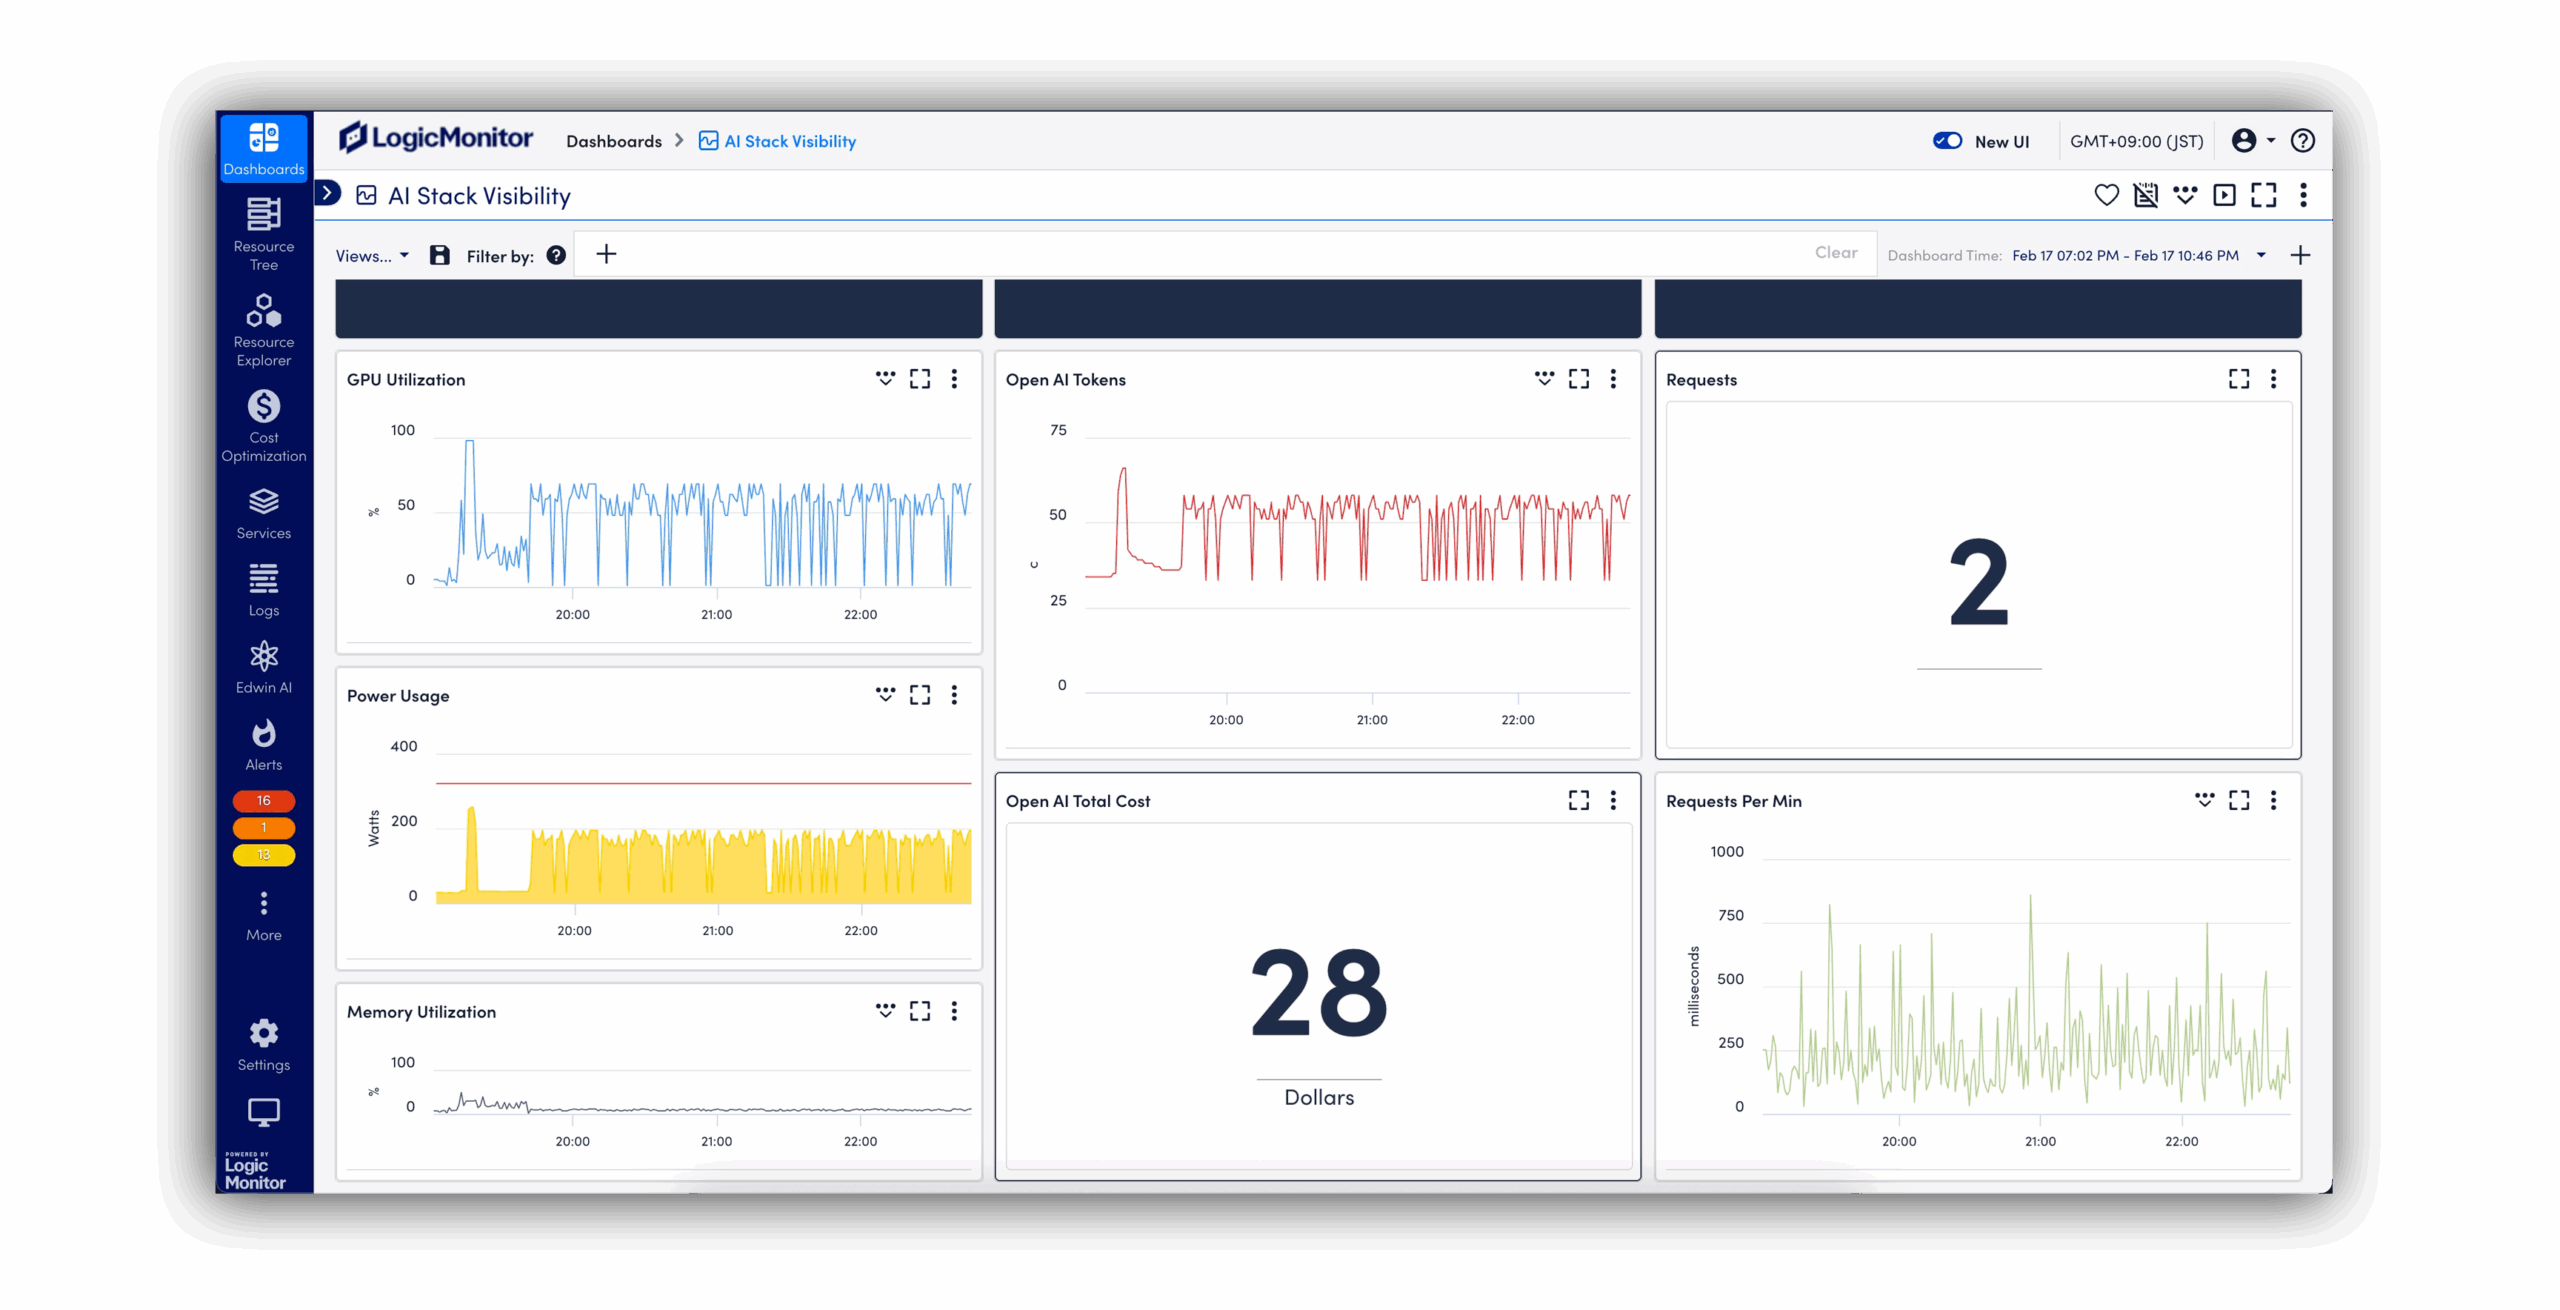
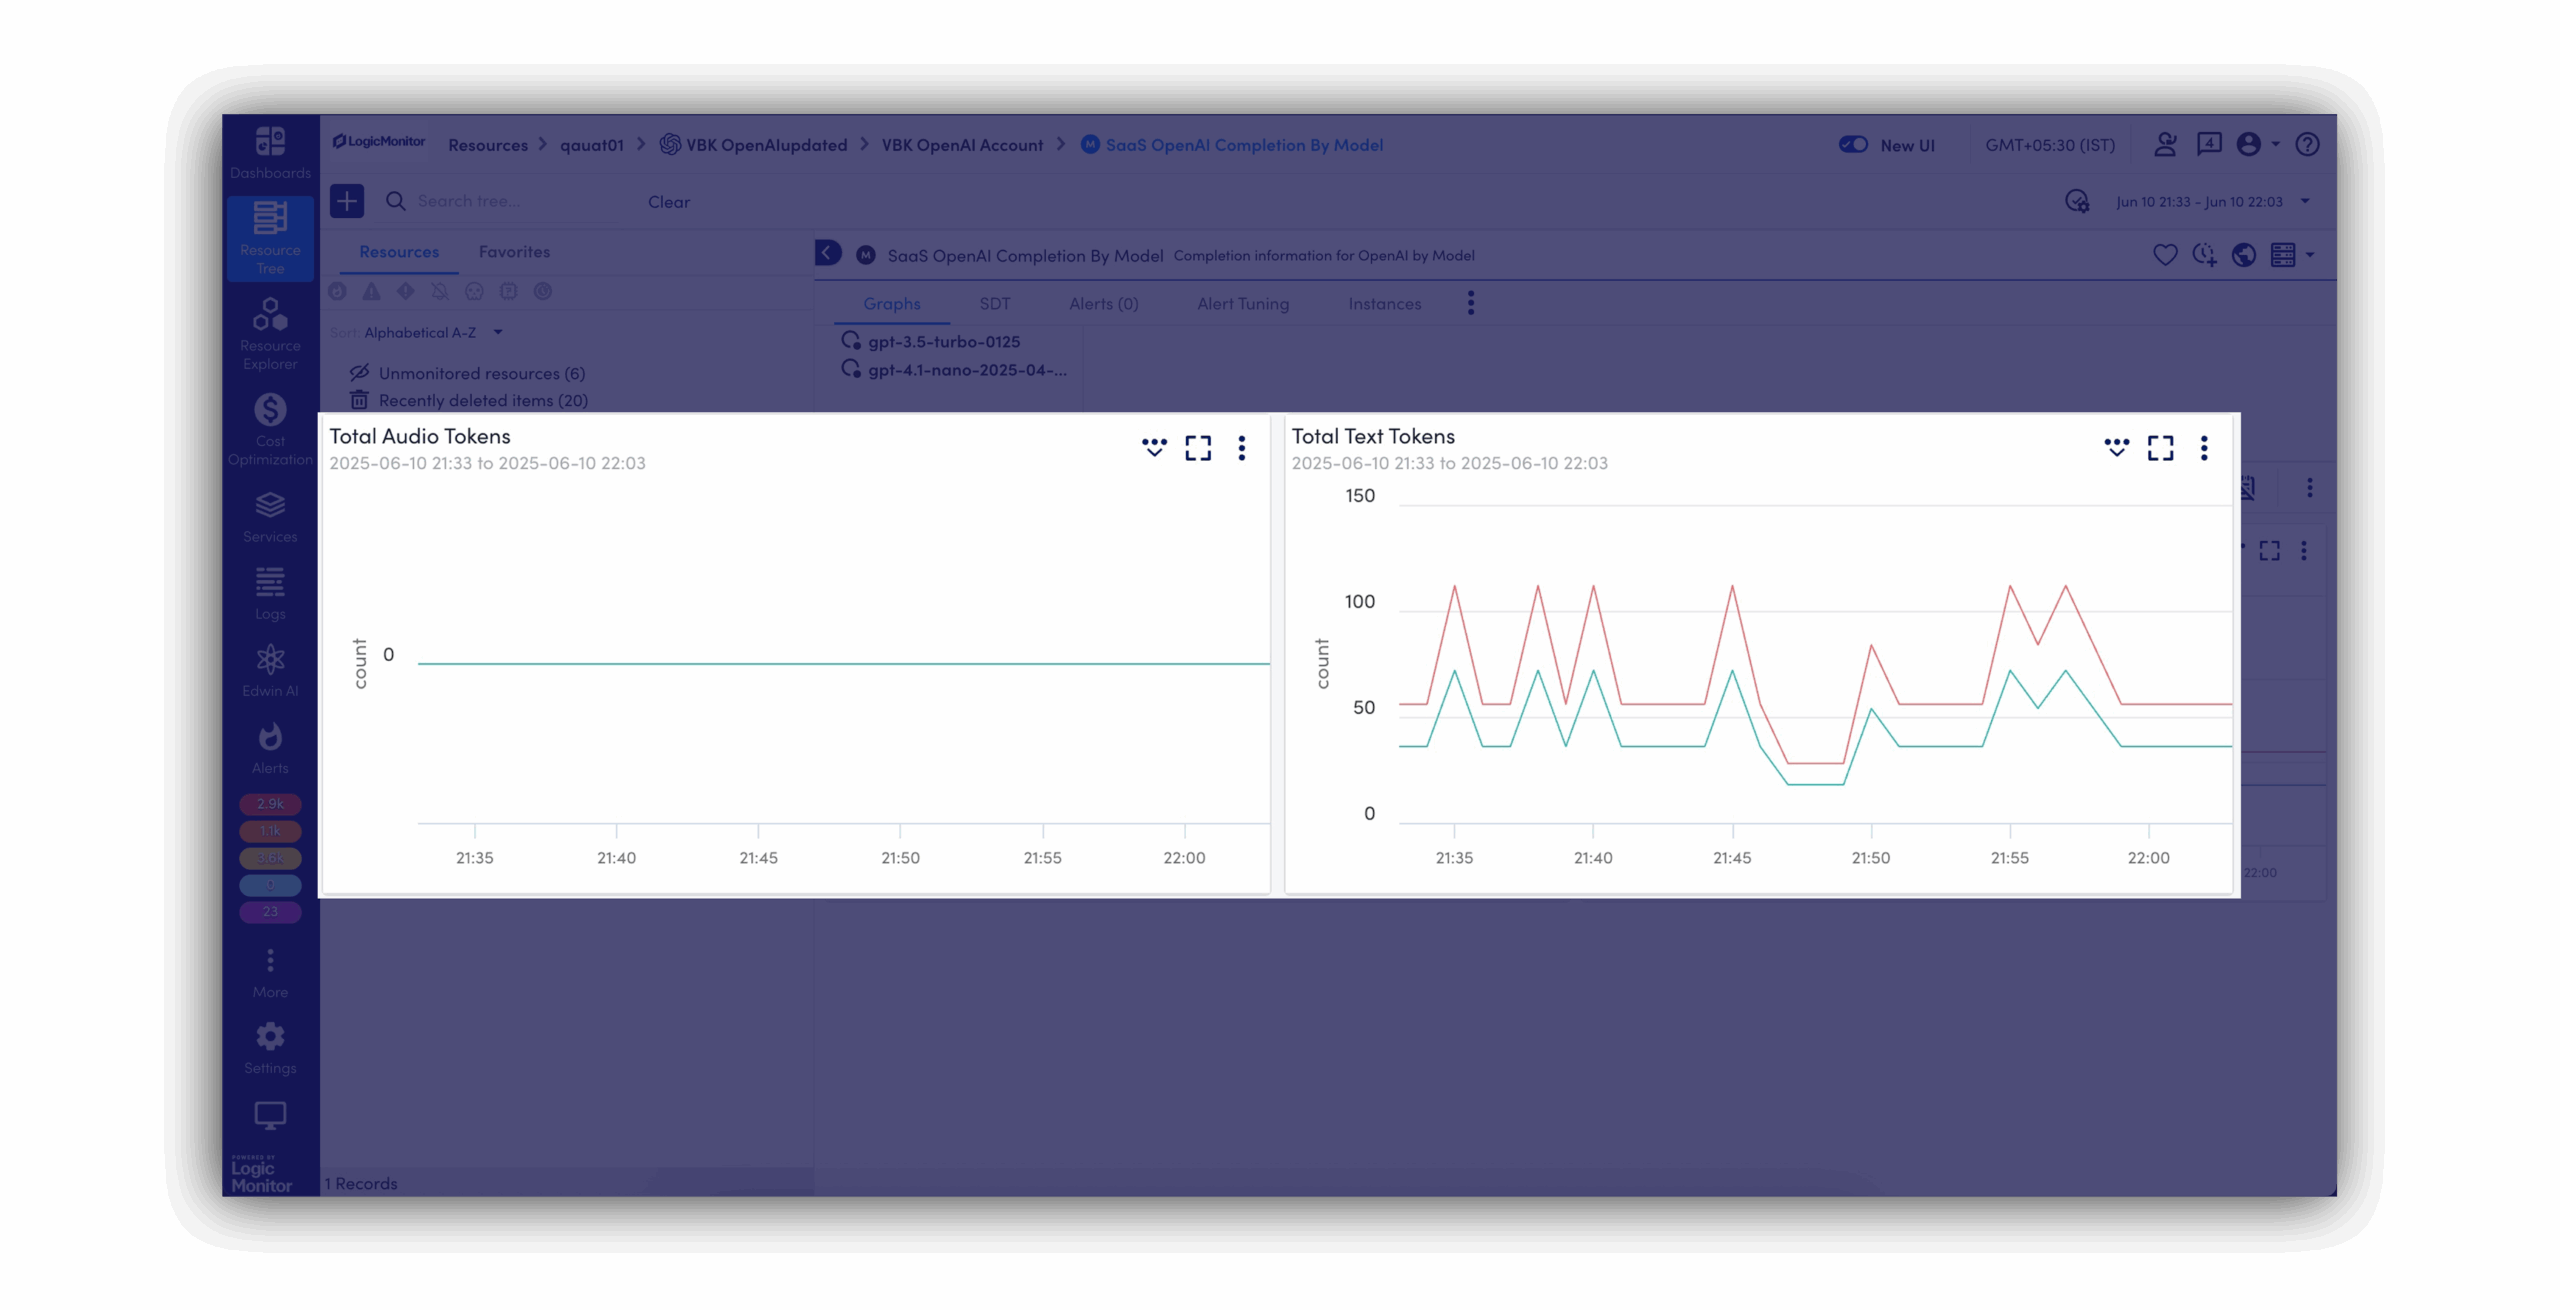
LogicMonitor Envision brings together metrics, events, logs, and traces from your AI systems, on-prem infrastructure, and cloud services into a single view. This AI observability helps you catch issues before they escalate, manage costs effectively, and keep your services reliable.
BY THE NUMBERS
From LLMs and GPUs to networks and databases—see it all in one unified view, so you can stop context-switching and start solving.
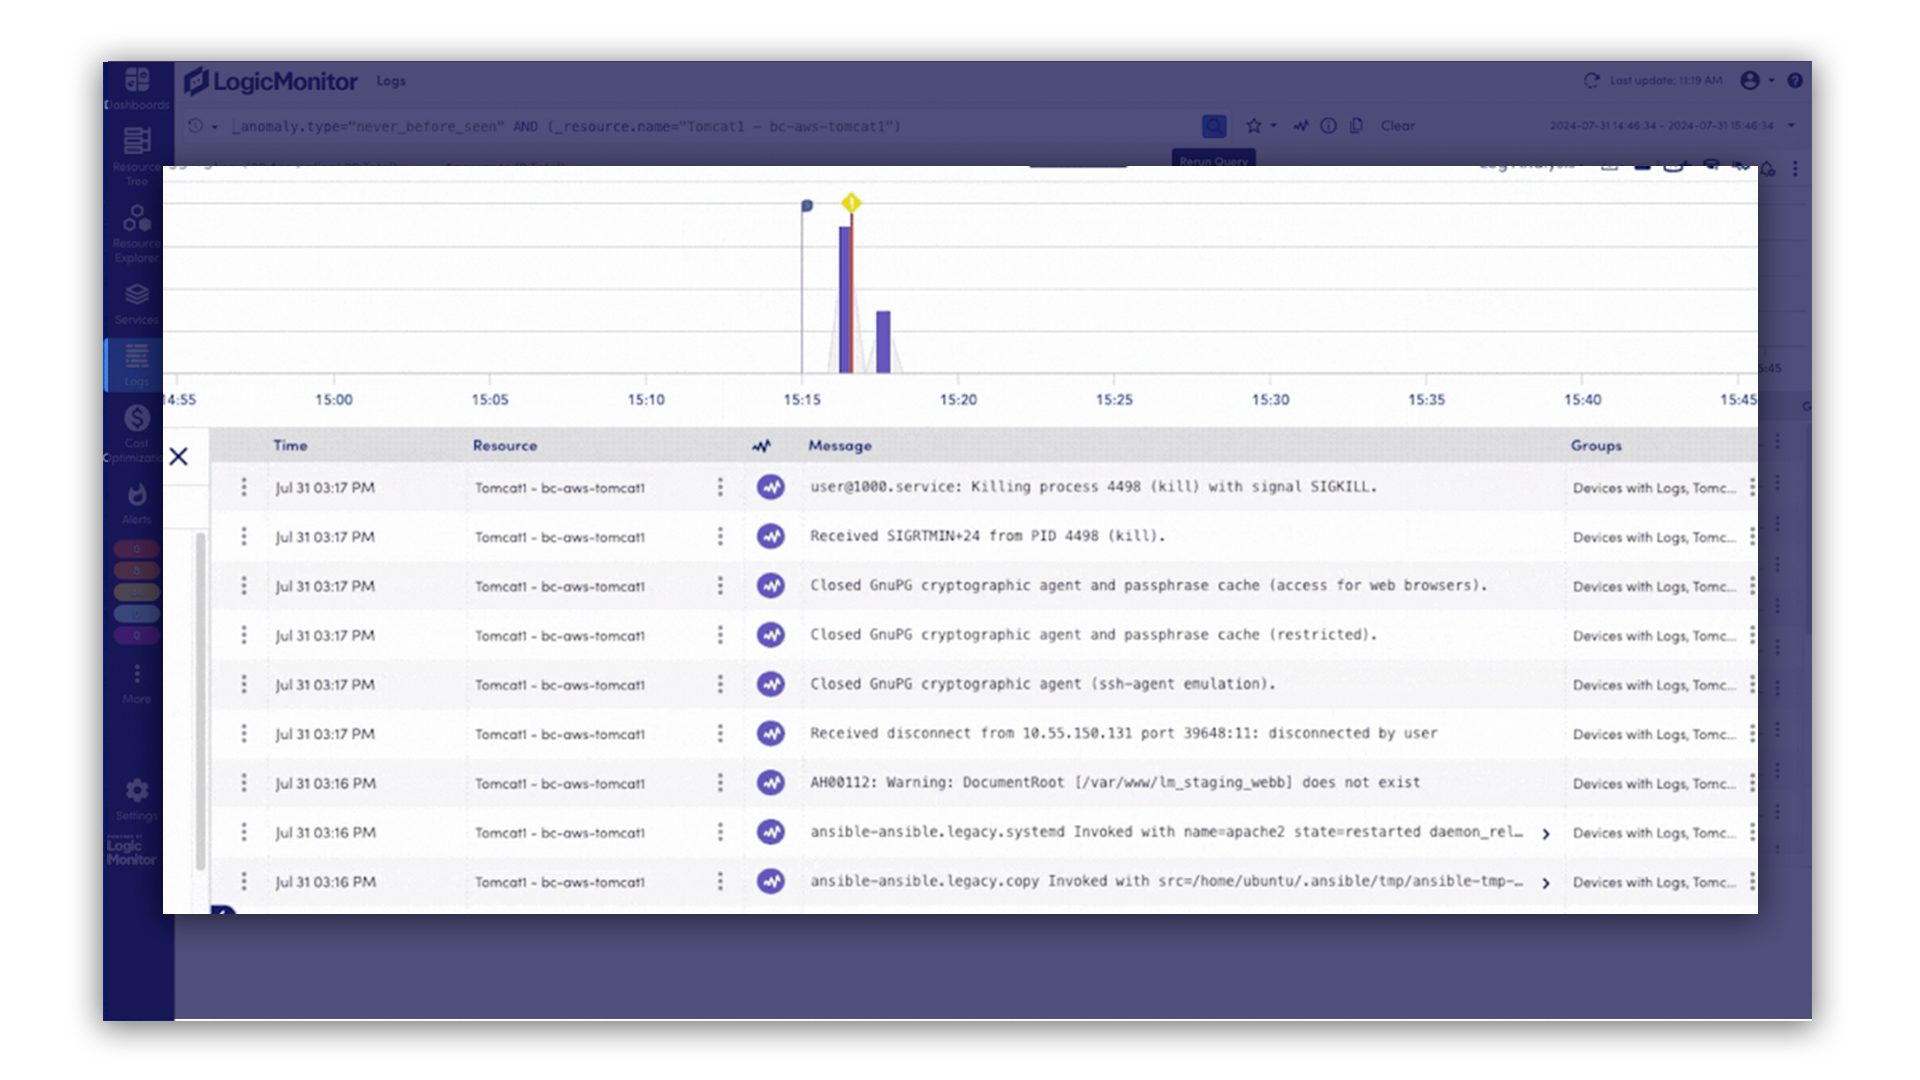
When something goes wrong, you’ll know exactly where to look and how to fix it fast. LM Envision spots issues early, and Edwin AI helps you get to the root cause without the usual guesswork or swivel-chairing.
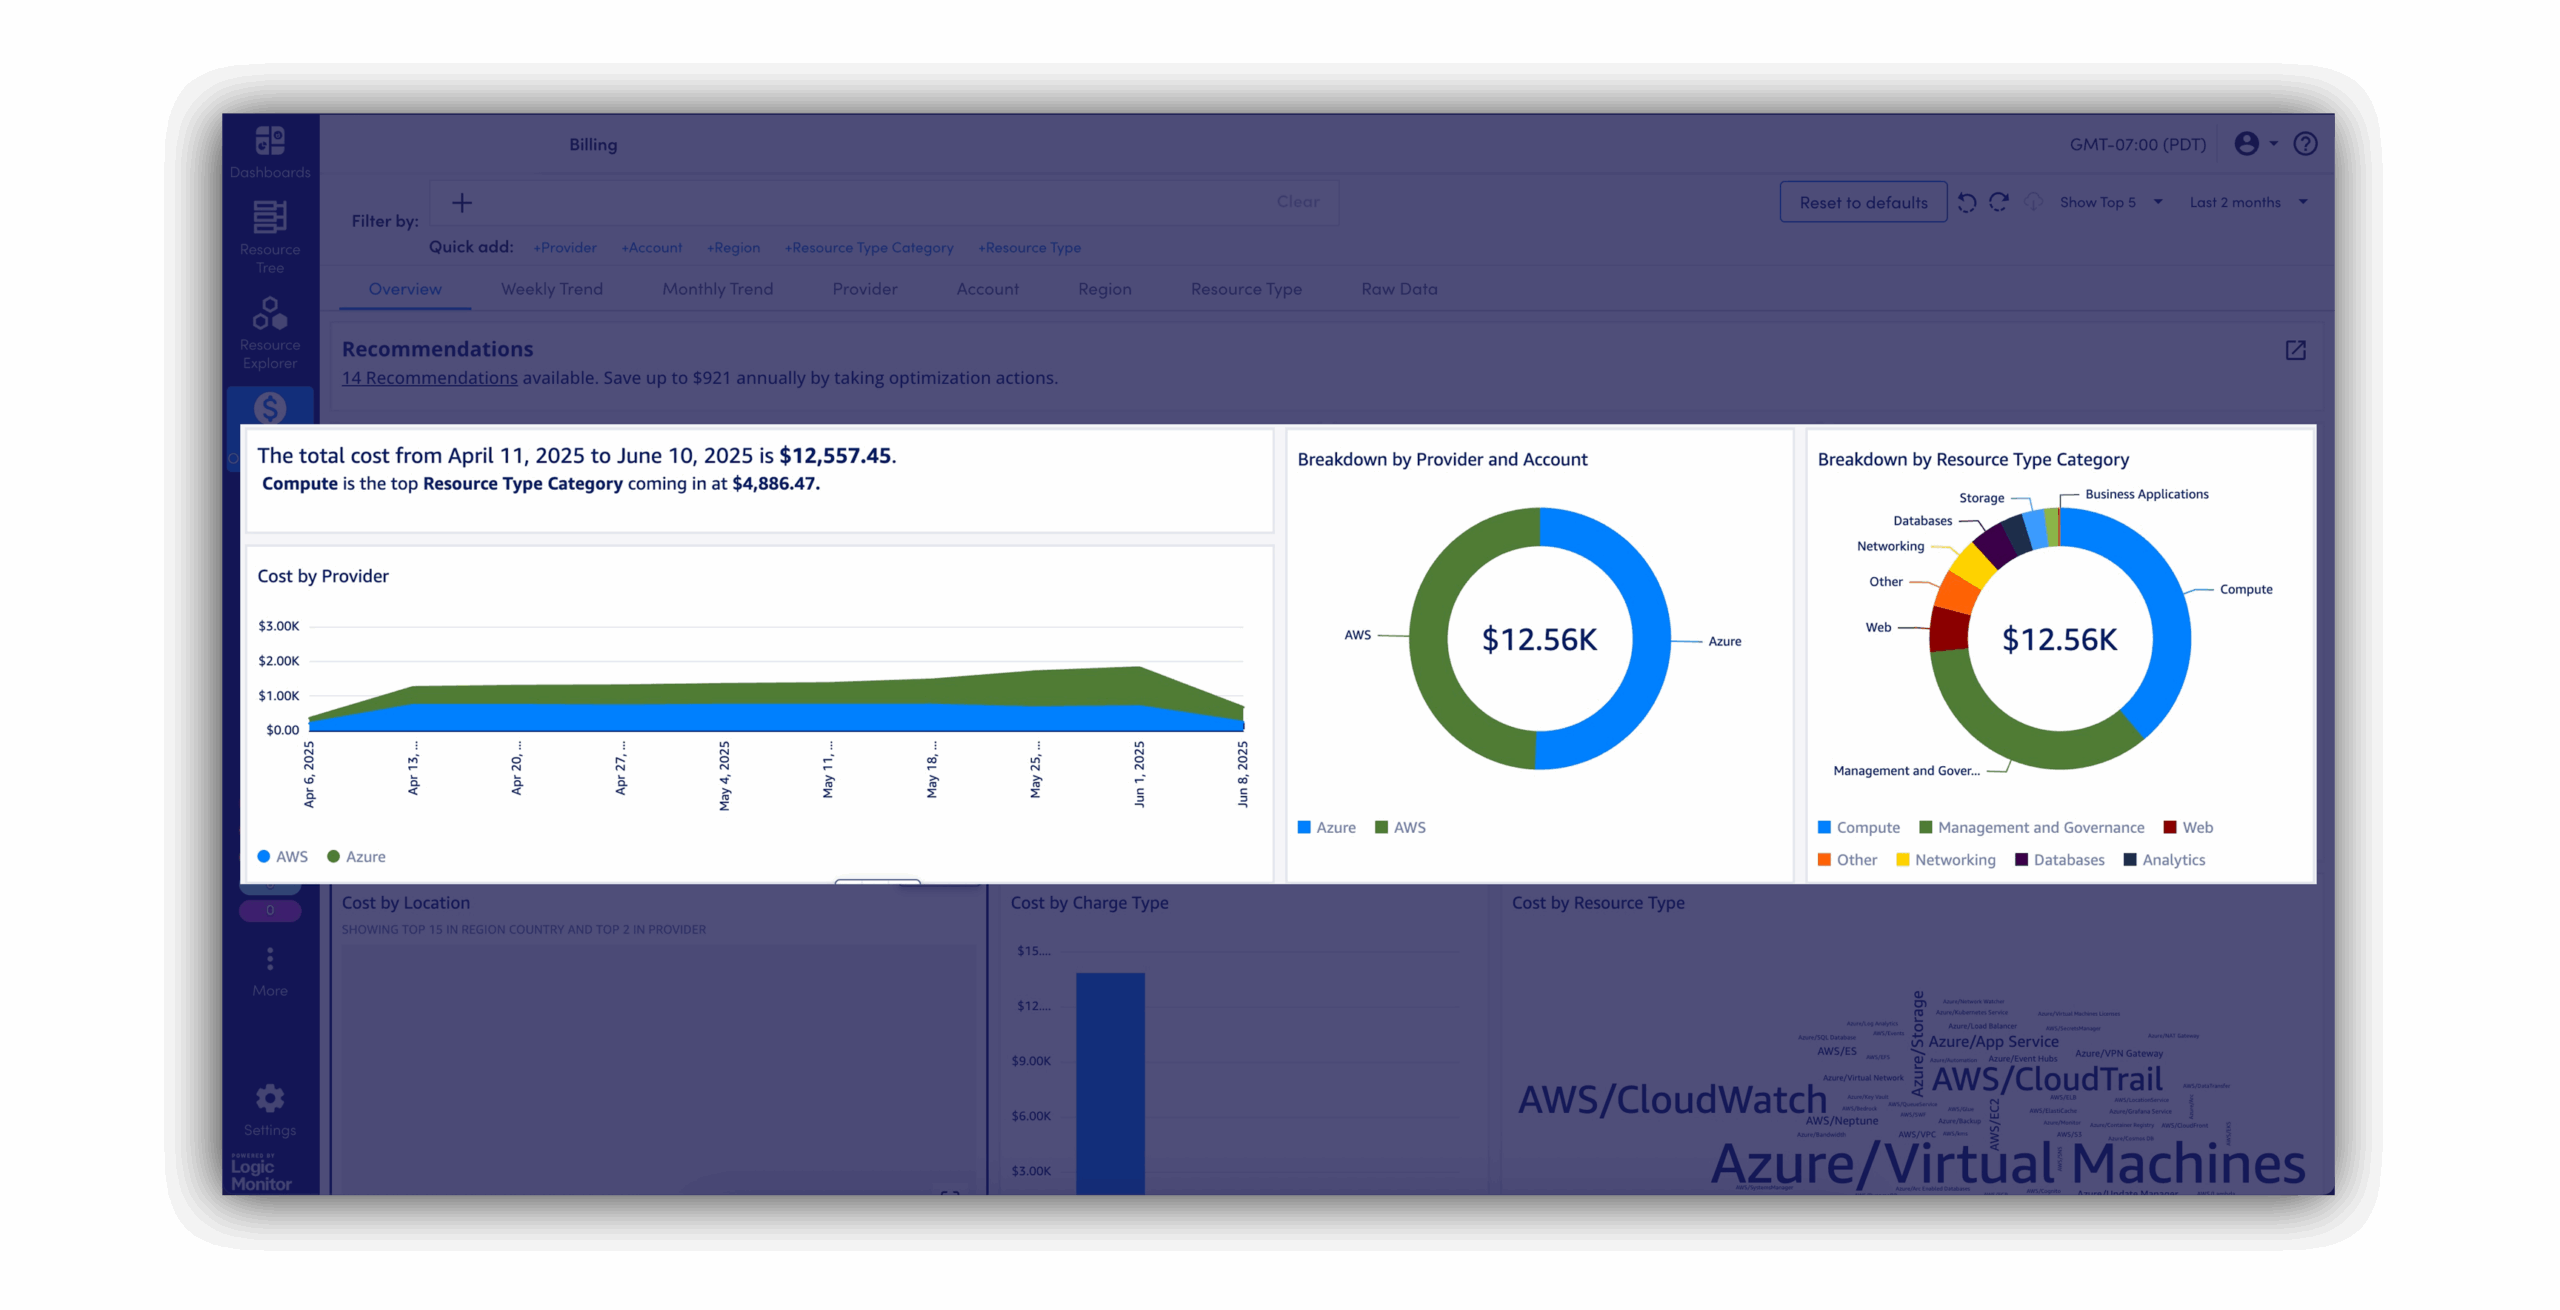
Cut costs and stay on budget by automatically spotting idle resources and wasted compute before they drain your spend.
New systems spin up, and LM Envision picks them up automatically, giving you instant visibility without extra licenses or manual setup.
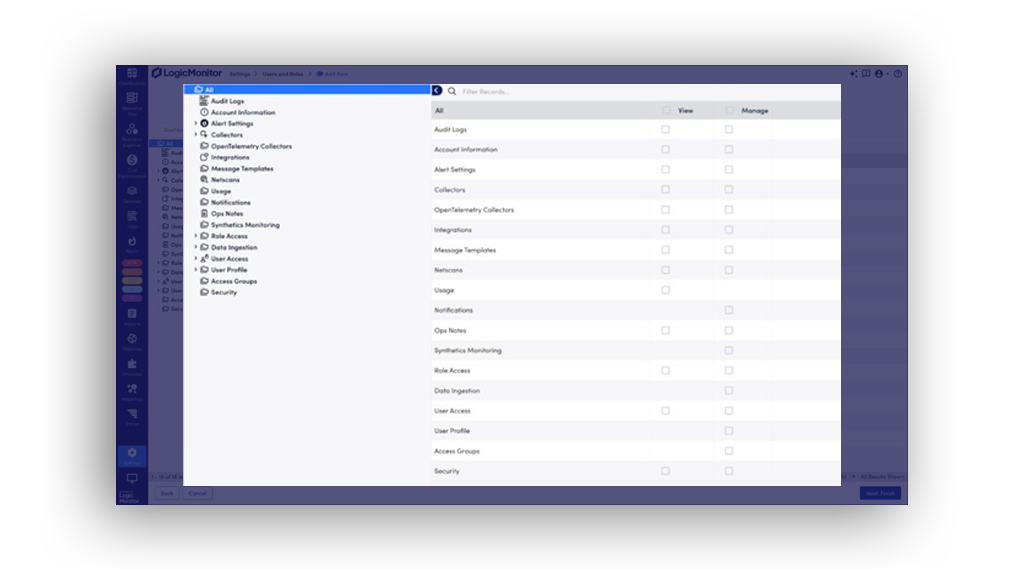
Stay on top of who’s accessing what, from where. If something’s off, you’ll catch it before it becomes an issue.
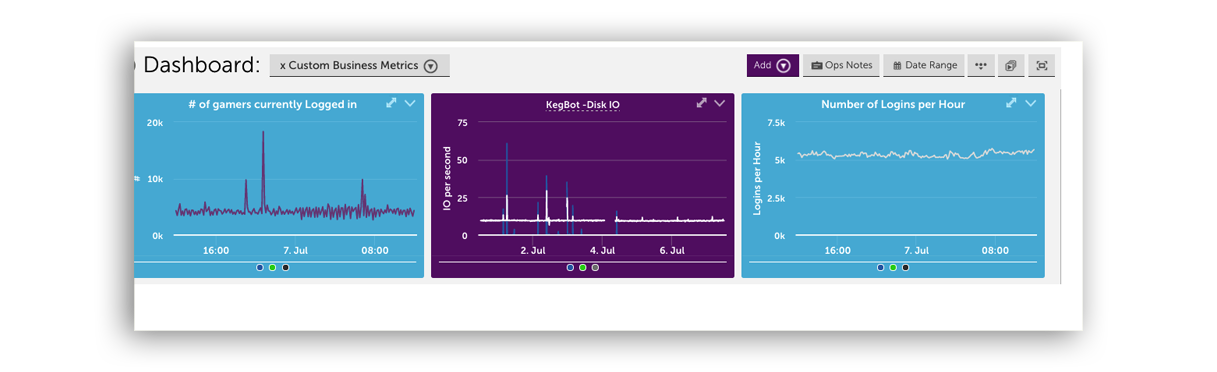
Quickly turn complex metrics, like AI spend, uptime, and security posture, into clear, executive-ready dashboards that drive alignment and action.
Make your ITOps even smarter
Edwin AI helps you catch issues early, cut through noise, and resolve incidents fast. With built-in generative AI, it auto-correlates alerts, surfaces root cause, and gives step-by-step guidance to fix problems before customers ever notice.
Everything you need to monitor, manage, and optimize AI
We couldn’t see the whole picture. Since deploying LogicMonitor, we have one tool and one location where we can see across all our infrastructure. The time savings are huge. I can’t even calculate them, but I would say hundreds of hours.
Leverage LM Envision’s 3,000+ existing integrations (servers, networks, storage, APM, CMDB) to feed infrastructure and application telemetry alongside AI data. Explore integrations
Push enriched incident details—complete with GPU, LLM, and database context—to ServiceNow, Jira, and Zendesk; maintain two-way sync for status updates.
Turn on plugins for OpenAI, AWS Bedrock, Azure OpenAI, GCP Vertex AI, Pinecone, ChromaDB, NVIDIA DCGM, and OpenLIT—each connector ingests the required metrics automatically.
See how LogicMonitor helps you monitor your AI systems in one place. Your team can move faster with fewer surprises.
GET ANSWERS
Get the answers to the top network monitoring questions.
AI observability is the ability to monitor and understand how AI systems behave in production. It helps teams detect model drift, spot latency, and catch silent failures by combining insights from infrastructure, models, and apps into one view.
Traditional monitoring watches CPU, memory, and uptime. AI observability connects those signals with model behavior, like output changes, performance slowdowns, and unusual agent behaviors.
Ideally before production. It’s much easier to track your AI systems from day one than to fix visibility gaps later.
Yes. LogicMonitor watches for unusual patterns in system and model behavior, like slow responses, unexpected output spikes, or shifts in usage that often indicate deeper AI issues.
No. LogicMonitor uses an agentless model with built-in integrations. You can start monitoring your AI stack quickly, without complex setup.
