Troubleshooting server performance and application monitoring – a real example.

What’s new in LogicMonitor? Explore the latest innovations advancing Autonomous IT

Proactively manage modern hybrid environments with predictive insights, intelligent automation, and full-stack observability.
Explore solutionsExplore our resource library for IT pros. Get expert guides, observability strategies, and real-world insights to power smarter, AI-driven operations.
Explore resources
Our observability platform proactively delivers the insights and automation CIOs need to accelerate innovation.
About LogicMonitor
We got a question internally about why one of our demo servers was slow, and how to use LogicMonitor to help identify the issue. The person asking comes from a VoIP, networking and Windows background, not Linux, so his questions reflect that of the less-experienced sys admin (in this case). I thought it interesting that he documented his thought processes, and I’ll intersperse my interpretation of the same data, and some thoughts on why LogicMonitor alerts as it does…
I noticed that a demo server has been slow lately, so I tried to use LogicMonitor to troubleshoot the performance of this demo server. 1. my first step is checking how busy is the host - let's start with CPU usage. I zoomed out to see one month view:I can see that both IOWaitPercent has been increasing. First note: I don't really understand IOWait counter. What does it mean? Should I care?
This is probably the issue right here. As noted in the datasource, IOWait is “The number of ‘ticks’ (typically 1/100s) a CPU spent waiting for IO.” So the CPU had something to do, but needed data on disk (or to put data on disk) before it could do it. (As a side note, I would have started with the application specific monitoring – response time per request – to make sure that the monitoring was tracking the metrics that matter for this system.)
So why does LogicMonitor alert on the total percent the CPU is busy, and not when just IOWait is high? Well, if disk reads or writes are slow, there will be an alert from the disk performance monitoring, which is a better alert. Alerting just on IO Wait is going to be neither sufficient nor noise free. An application that uses a single thread to flush or read data to disk, running on a 16 core system, may be completely bogged down if that one thread is spending most of its time in IO Wait – yet the reported IO wait for the system will be only 7% (as only 1/16th of the CPUs are waiting for disk IO). Setting alerts on IOWait of 7% would clearly generate a lot of noise. Another application may have a good buffering system for writes, so IO Wait of 60% may not affect application response at all. (e.g. a database where the DB fits in memory, but there are a lot of updates. Queries will still be quick, and writes will eventually be flushed.)
However, a change like the above, that varies from the baseline, is likely to impact performance – unless you know the characteristics of your application, you should assume increased IO wait is a cause for concern.
2. My next step is usually seeing how much data is going through this host:No clues here - traffic rates didn't change in the last 30 days.
Hmm. I beg to differ. To me, it looks like the inbound traffic changes significantly over the month, but its hard to tell with the scale set to accommodate the outbound traffic. So I used the interactive graph, and turned off the outbound traffic (which includes downloads from the server, etc), so the inbound traffic was easier to see:
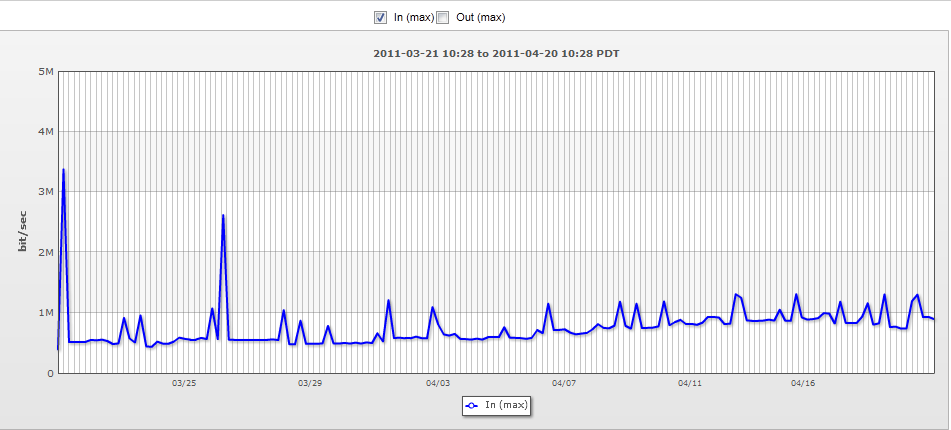
Now it’s clear that the inbound traffic basically doubled over the last month, so the application is processing twice as much data.
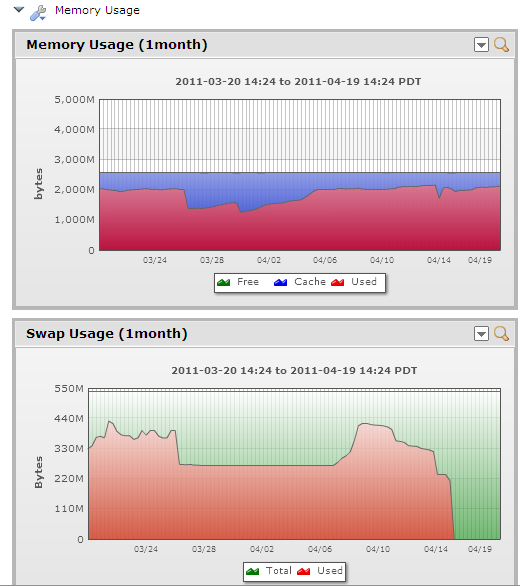
3. I checked memory usage: a strange drop in swap rates, without any changes in memory
usage. Not sure why, but it should not make my server slower, so I'm ignoring it:
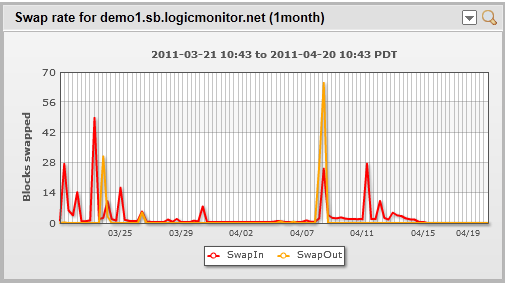
Well, right question, wrong tool. Active swapping can certainly kill system performance. But swap usage does not mean there is active swapping. The right graph to check is the swap rate, not swap usage.
But that shows a minimal swap rate, so that’s not the issue. (And there would have been an alert if it was.)
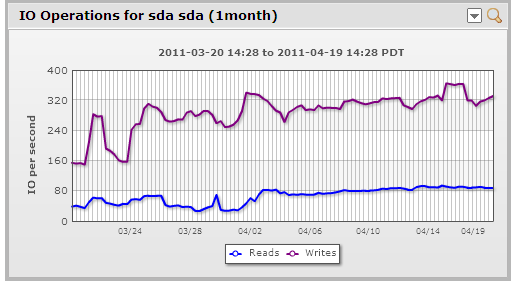
4. Checked disk IOs. Slightly increasing, but not dramatically, so probably irrelevant:
It would be not relevant if you knew you were nowhere near the limits of the IOps capacity of the drive system. In this case, this demo server has a RAID 1 of two 15K SAS disks – so 320 write operations per second is almost certainly hitting the maximum capability – which will of course create an inflection point in performance.
At this point, I look at  "Disk Performance", which gives more info, but since it was
only added to this host a week ago, I can't use it to correlate data in one month view.
Looking at a subset of the disk performance information – the disk is 100% busy, and response time for both reads and writes is poor. For this application, read time matters, as writes are buffered in memory, but if reads are slow, that will impact end user response. There is a performance improvement over the weekend – more on that below.

5 Next, I will drill down to the specific app performance counters:There are clearly some performance issues here. So what's going on?
Well, we can see the application response time clearly slowed down on the third (but not to terrible levels – 50 ms to process a request is still not bad, for a non-production server.) It oddly recovered on the 9th and 10th, then slowed down again. This correlates with the IO completion time, but the IO completion time doesn’t really correlate with the total disk IOs. The total disk IOs are constant (or increasing), but disk response time improved for the same load on the 9th and 10th, then slowed down again…. Why?
Well, this demo server is a virtual machine running on ESX. A look at the overview graph for the top 10 busiest virtual machines, by disk IOs, showed that when the demo server performed better, the workload from the other servers on that host was less.
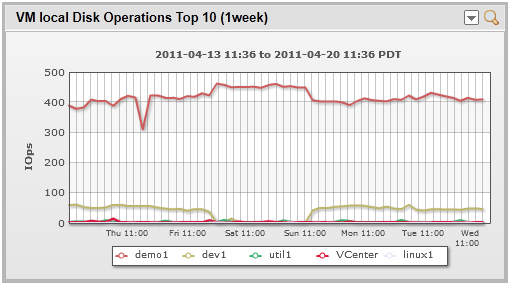
So mystery explained. The disk on the ESX host was saturated – when there was less competition for it, the particular VM got better performance.
So, what is the problem, and what should I do about it? How does LogicMonitor "help me
solve the problem?"
As good as LogicMonitor is, it cannot negate the need for an understanding of your systems and applications.
LogicMonitor presented:
So while I think the alerts and graphs did explicitly identify the issue – the server is running at its maximum workload, given the current shared disk performance of the ESX host it’s on – a bit of experience with your systems will help you put 2 + 2 together.
But if you don’t have comprehensive monitoring and baseline, you’ll never even know what numbers to add up. (And if you do have LogicMonitor monitoring, and still have issues determining the root cause of issues – contact support – we’ll be happy to help.)
© LogicMonitor 2026 | All rights reserved. | All trademarks, trade names, service marks, and logos referenced herein belong to their respective companies.

