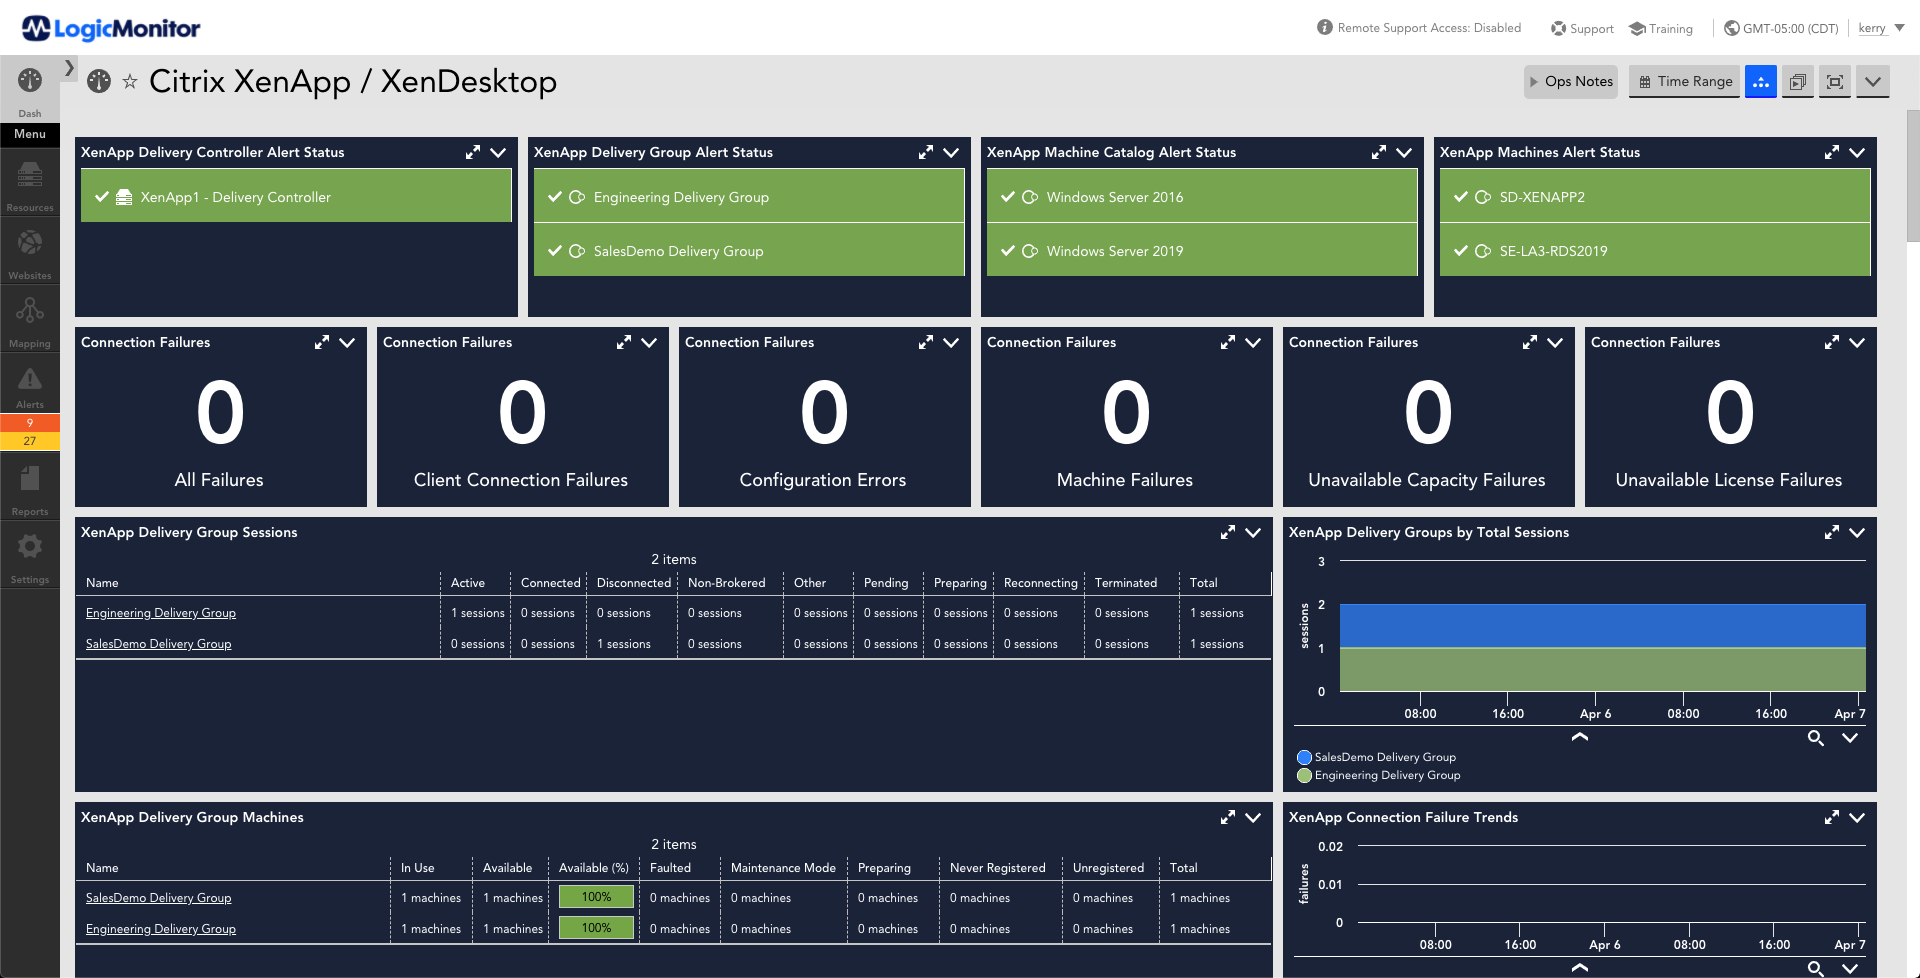
Manage Full Suite of Citrix Services

Detailed
Proactive
Customizable
Automated

Detailed

LogicMonitor provides detailed monitoring for your Citrix environment, including servers, virtual desktops, and network devices.

Why SREs need better visibility, not more tools

Proactive

LogicMonitor’s alerting system can detect potential issues in your Citrix environments and beyond, and notify you before they become critical.

PostgreSQL vs. MySQL

Customizable

Create custom dashboards that provide real-time visibility into the performance and health of a Citrix environment, or start with our out-of-the-box dashboards and go from there!

7 Steps to Transform Your Service Provider Business

Automated

LogicMonitor’s collectors automatically discovers and starts monitoring Citrix components, making it easy to set up and start using.

What is a bucket in GCP? GCP buckets explained

XenApp Monitoring at your fingertips

Centralize your Citrix products in one place. With XenApp monitoring, streamline the delivery of applications and help your organization improve security, compliance, and user experience

This dashboard provides status of Citrix XenApp / Xendesk applications. The metrics displayed are alert status, connection failure, delivery group sessions, delivery group sessions over time, delivery group machines, connection failure over time.

Citrix XenServer

Monitoring XenServer with LogicMonitor is easy: all you need to do is enter the XenServer hostname, and information about your Xen infrastructure will be discovered automatically. For both the Citrix and Open Source versions of XenServer, LogicMonitor automatically discovers and monitors:

  • xen servers in a resource pool
  • server interfaces, CPUs, and memory usage
  • storage repositories
  • virtual machines, and their disks, memory, and interfaces
  • the high availability state of the pool, and whether resources are over committed

By using the XenServer native API to query Xen specific performance counters, LogicMonitor provides a wealth of performance data and intelligence, offering unmatched visibility into the XenServer environment.

Effortless Netscaler Monitoring

LogicMonitor’s unique hosted monitoring makes Netscaler monitoring effortless. It will allow you to easily answer questions such as:

  • Are your Netscaler HA nodes synchronized in their configurations?
  • Is integrated caching running effectively?
  • Are all the production VIPs up, and do they have redundant back-ends?
  • Which VIP is the busiest?
  • Has traffic on that VIP changed over the last month?

Intelligent alert thresholds will be set, alerting you to any issues in hardware, performance or configuration. All with no configuration on your part.

More Citrix resources

Citrix XenApp and XenDesktop monitoring
Documentation
Citrix Netscalers
Documentation
Citrix XenServer
Documentation
Citrix VAD Monitoring
Documentation

Citrix integrations include