Since the revolutionization of the concept by Docker in 2013, containers have become a mainstay in application development. Their speed and resource efficiency make them ideal for a DevOps environment as they allow developers to run software faster and more reliably, no matter where it is deployed. With containerization, it’s possible to move and scale several applications across clouds and data centers.
However, this scalability can eventually become an operational challenge. In a scenario where an enterprise is tasked with efficiently running several containers carrying multiple applications, container orchestration becomes not just an option but a necessity.
What is container orchestration?
Container orchestration is the automated process of managing, scaling, and maintaining containerized applications. Containers are executable units of software containing application code, libraries, and dependencies so that the application can be run anywhere. Container orchestration tools automate the management of several tasks that software teams encounter in a container’s lifecycle, including the following:
- Deployment
- Scaling and load balancing/traffic routing
- Networking
- Insights
- Provisioning
- Configuration and scheduling
- Allocation of resources
- Moving to physical hosts
- Service discovery
- Health monitoring
- Cluster management
How does container orchestration work?
There are different methodologies that can be applied in container orchestration, depending on the tool of choice. Container orchestration tools typically communicate with YAML or JSON files that describe the configuration of the application. Configuration files guide the container orchestration tool on how and where to retrieve container images, create networking between containers, store log data, and mount storage volumes.
The container orchestration tool also schedules the deployment of containers into clusters and automatically determines the most appropriate host for the container. After a host has been determined, the container orchestration tool manages the container’s lifecycle using predefined specifications provided in the container’s definition file.
Container orchestration tools can be used in any environment that runs containers. Several platforms offer container orchestration support, including Kubernetes, Docker Swarm, Amazon Elastic Container Service (ECS), and Apache Mesos.
Challenges and best practices in container orchestration
While container orchestration offers transformative benefits, it’s not without its challenges. Understanding these potential pitfalls and adopting best practices can help organizations maximize the value of their orchestration efforts.
Common challenges
- Complexity in setup and operation
Setting up container orchestration can be daunting, especially for teams new to the technology. Configuring clusters, managing dependencies, and defining orchestration policies often require significant expertise. The steep learning curve, particularly with tools like Kubernetes, can slow adoption and hinder productivity. - Security risks with containerized environments
Containerized applications introduce unique security challenges, including vulnerabilities in container images, misconfigurations in orchestration platforms, and potential network exposure. Orchestrators need robust security measures to safeguard data and applications. - Vendor lock-in with proprietary solutions
Organizations relying on proprietary orchestration tools or cloud-specific platforms may find it difficult to migrate workloads or integrate with other environments. This can limit flexibility and increase long-term costs. - Performance bottlenecks
Resource contention, inefficient scaling policies, and poorly optimized configurations can lead to performance issues, impacting application reliability and user experience.
Best practices for successful container orchestration
- Simplify and automate with CI/CD pipelines
Automating workflows using Continuous Integration and Continuous Deployment (CI/CD) pipelines reduces manual intervention and ensures consistency in deployments. Tools like Jenkins or GitLab can integrate seamlessly with container orchestration platforms to streamline operations. - Proactively monitor and manage clusters
Monitoring tools like LogicMonitor can be used to track container performance, resource usage, and application health. Proactive alerts and dashboards help identify and resolve issues before they impact users, ensuring reliability and uptime. - Prioritize security from the start
Implement security best practices such as:- Regularly scanning container images for vulnerabilities.
- Enforcing Role-Based Access Control (RBAC) to restrict permissions.
- Configuring network policies to isolate containers and protect sensitive data. By building security into the orchestration process, organizations can mitigate risks and maintain compliance.
- Start small and scale gradually
Begin with a minimal setup to gain familiarity with orchestration tools. Focus on automating a few processes, then gradually expand the deployment to handle more complex workloads as the team’s expertise grows. - Optimize resource allocation
Regularly review resource usage and scaling policies to ensure efficient operation. Use orchestration features like auto-scaling to adjust resources based on demand dynamically. - Choose flexible, open solutions
To avoid vendor lock-in, prioritize tools like Kubernetes that support multi-cloud or hybrid deployments and integrate with a wide range of environments and services.
How does Kubernetes orchestration work?
Kubernetes is an open-source container orchestration platform that is considered the industry standard. The Google-backed solution allows developers and operators to deliver cloud services, either as Platform-as-a-Service (PaaS) or Infrastructure-as-a-Service (IaaS). It’s a highly declarative solution, allowing developers to declare the desired state of their container environment through YAML files. Kubernetes then establishes and maintains that desired state.
The following are the main architecture components of Kubernetes:
Nodes
A node is a worker machine in Kubernetes. It may be virtual or physical, depending on the cluster. Nodes receive and perform tasks assigned from the Master Node. They also contain the necessary services to run pods. Each node comprises a kubelet, a container runtime, and a kube-proxy.
Master Node
This node controls all the worker nodes and originates all assigned tasks. It does this through the control pane, which is the orchestration layer that exposes the API and interfaces to define, deploy, and manage the lifecycles of containers.
Cluster
A cluster represents the master node and multiple worker nodes. Clusters combine these machines into a single unit to which containerized applications are deployed. The workload is then distributed to various nodes, making adjustments as nodes are added or removed.
Pods
Pods are the smallest deployable computing units that can be created and managed in Kubernetes. Each Pod represents a collection of containers packaged together and deployed to a node.
Deployments
A deployment provides declarative updates for Pods and ReplicaSets. It enables users to designate how many replicas of a Pod they want running simultaneously.
How does Docker orchestration work?
Docker, also an open-source platform, provides a fully integrated container orchestration tool known as Docker Swarm. It can package and run applications as containers, locate container images from other hosts, and deploy containers. It is simpler and less extensile than Kubernetes, but Docker provides the option of integration with Kubernetes for organizations that want access to Kubernetes’ more extensive features.
The following are the main architectural components of Docker Swarm:
Swarm
A swarm is a cluster of Docker hosts that run in swarm mode and manage membership and delegation while also running swarm services.
Node
A node is the docker engine instance included in a swarm. It can be either a manager node or a worker node. The manager node dispatches units of work called tasks to worker nodes. It’s also responsible for all orchestration and container management tasks like maintaining cluster state and service scheduling. Worker nodes receive and execute tasks.
Services and Tasks
A service is the definition of a task that needs to be executed on the nodes. It defines which container images to use and which commands to execute inside running containers.
A task carries a container alongside the commands to run inside the container. Once a task is assigned to a node, it cannot move to another node.
How does container orchestration work with other Platforms?
Although Docker and Kubernetes are leading the pack when it comes to container orchestration, other platforms are capitalizing on their open-source software to provide competition.
Red Hat OpenShift is an open-source enterprise-grade hybrid platform that provides Kubernetes functionalities to companies that need managed container orchestration. Its framework is built on a Linux OS that allows users to automate the lifecycles of their containers.
Google Kubernetes Engine is powered by Kubernetes and enables users to easily deploy, manage, and scale Docker containers on Google Cloud.
Other platforms like Apache Mesos and Amazon ECS have developed their own container tools that allow users to run containers while ensuring security and high scalability.
Tool comparisons: Finding the right fit for your needs
When choosing the best container orchestration tool for an organization, several factors have to be taken into consideration. These factors vary across different tools. With a tool like Mesos, for instance, the software team’s technical experience must be considered as it is more complex than simple tools like Swarm. Organizations also have to consider the number of containers to be deployed, as well as application development speed and scaling requirements.
With the right tools and proper resource management, container orchestration can be a valuable approach for organizations looking to achieve improved productivity and scalability.
Below is a comparison of the most popular tools in the container orchestration space, highlighting their key features and ideal use cases.
| Tool | Scalability | Learning Curve | Supported Environments | Key Integrations | Best For |
| Kubernetes | Excellent for large, complex setups | Steep, requires expertise | On-premises, cloud (AWS, GCP, Azure) | CI/CD pipelines, monitoring tools, Istio | Enterprises requiring robust orchestration for multi-cloud or hybrid environments. |
| Docker Swarm | Moderate, ideal for small clusters | Low, easy for Docker users | On-premises, cloud | Docker ecosystem, Kubernetes (optional integration) | Small to medium teams seeking straightforward orchestration within the Docker platform. |
| Amazon ECS | Highly scalable within AWS ecosystem | Moderate, AWS-specific knowledge | AWS (native service) | AWS services (EKS, CloudWatch, IAM) | Businesses already leveraging AWS services for containerized applications. |
| Red Hat OpenShift | Enterprise-grade, highly scalable | Moderate, depends on Kubernetes base | Hybrid environments, Linux-based on-premise/cloud | OpenShift tools, Kubernetes integrations | Enterprises needing managed Kubernetes with robust security and enterprise-grade features. |
| Apache Mesos | Extremely scalable for large systems | High, requires advanced expertise | On-premises, private cloud | Marathon, custom integrations | Advanced users managing diverse workloads beyond containers, such as big data and microservices. |
Examples of container orchestration
Container orchestration provides a number of benefits for organizations, but what do those benefits look like in real-world work situations? We included a couple of common orchestration examples below:
First, consider a large e-commerce platform that experiences heavy traffic during the holiday season. In the past, that platform would have to manually provision additional servers to handle the increased holiday load, which is a time-consuming and error-prone process. With container orchestration, the platform can use an auto-scaling feature that automatically provisions additional containers as traffic increases and scales back down when traffic decreases. That way, increased traffic for the holiday rush can die down in January once everyone buys, returns, and exchanges their items.
Second, consider a company that has a website, a mobile app, and a back-end processing system that all runs on different servers in different environments. In the past, managing these different applications and environments would require much manual effort and coordination. With container orchestration, the company can use a single platform to manage all of its containers and environments, allowing it to easily deploy, manage, and scale its applications across different environments. This allows the company to adopt new technologies more easily and streamline its development process.
Monitor your containers with LogicMonitor today
Container orchestration is a critical component of modern application development, enabling teams to efficiently manage, scale, and secure containerized environments. By addressing the challenges of complexity, security, and resource management, and leveraging best practices like CI/CD pipelines and proactive monitoring, organizations can maximize the benefits of container orchestration while minimizing operational overhead.
To fully realize the potential of container orchestration, having a reliable monitoring solution is essential. LogicMonitor offers scalable, dynamic monitoring for ephemeral containerized resources alongside your hybrid cloud infrastructure. With LogicMonitor, you gain visibility into your Kubernetes and Docker applications through a single, unified platform that automatically adapts to your container resource changes.
At LogicMonitor, we manage vast quantities of time series data, processing billions of metrics, events, and configurations daily. As part of our transition from a monolithic architecture to microservices, we chose Quarkus—a Kubernetes-native Java stack—for its efficiency and scalability. Built with the best-of-breed Java libraries and standards, Quarkus is designed to work seamlessly with OpenJDK HotSpot and GraalVM.
To monitor our microservices effectively, we integrated Micrometer, a vendor-agnostic metrics instrumentation library for JVM-based applications. Micrometer simplifies the collection of both JVM and custom metrics, helping maximize portability and streamline performance monitoring across our services.
In this guide, we’ll show you how to integrate Quarkus with Micrometer metrics, offering practical steps, code examples, and best practices. Whether you’re troubleshooting performance issues or evaluating these tools for your architecture, this article will help you set up effective microservice monitoring.
How Quarkus and Micrometer work together
Quarkus offers a dedicated extension that simplifies the integration of Micrometer, making it easier to collect both JVM and custom metrics. This extension allows you to quickly expose application metrics through representational state transfer (REST) endpoints, enabling real-time monitoring of everything from Java Virtual Machine (JVM) performance to specific microservice metrics. By streamlining this process, Quarkus and Micrometer work hand-in-hand to deliver a powerful solution for monitoring microservices with minimal setup.
// gradle dependency for the Quarkus Micrometer extension
implementation 'io.quarkus:quarkus-micrometer:1.11.0.Final'
// gradle dependency for an in-memory registry designed to operate on a pull model
implementation 'io.micrometer:micrometer-registry-prometheus:1.6.3'
What are the two major KPIs of our metrics processing pipeline?
For our metrics processing pipeline, our two major KPIs (Key Performance Indicators) are the number of processed messages and the latency of the whole pipeline across multiple microservices.
We are interested in the number of processed messages over time in order to detect anomalies in the expected workload of the application. Our workload is variable across time but normally follows predictable patterns. This allows us to detect greater than expected load, react accordingly, and proactively detect potential data collection issues.
In addition to the data volume, we are interested in the pipeline latency. This metric is measured for all messages from the first ingestion time to being fully processed. This metric allows us to monitor the health of the pipeline as a whole in conjunction with microservice-specific metrics. It includes the time spent in transit in Kafka clusters between our different microservices. Because we monitor the total processing duration for each message, we can report and alert on average processing time and different percentile values like p50, p95, and p999. This can help detect when one or multiple nodes in a microservice along the pipeline are unhealthy. The average processing duration across all messages might not change much, but the high percentile (p99, p999) will increase, indicating a localized issue.
In addition to our KPIs, Micrometer exposes JVM metrics that can be used for normal application monitoring, such as memory usage, CPU usage, garbage collection, and more.
Using Micrometer annotations
Two dependencies are required to use Micrometer within Quarkus: the Quarkus Micrometer dependency and Micrometer Registry Prometheus. Quarkus Micrometer provides the interfaces and classes needed to instrument codes, and Micrometer Registry Prometheus is an in-memory registry that exposes metrics easily with rest endpoints. Those two dependencies are combined into one extension, starting with Quarkus 1.11.0.Final.
Micrometer annotations in Quarkus produce a simple method to track metric names across different methods. Two key annotations are:
- @Timed: Measures the time a method takes to execute.
- @Counted: Tracks how often a method is called.
This, however, is limited to methods in a single microservice.
@Timed(
   value = "processMessage",
   description = "How long it takes to process a message"
)
public void processMessage(String message) {
   // Process the message
}
It is also possible to programmatically create and provide values for Timer metrics. This is helpful when you want to instrument a duration, but want to provide individual measurements. We are using this method to track the KPIs for our microservice pipeline. We attach the ingestion timestamp as a Kafka header to each message and can track the time spent throughout the pipeline.
@ApplicationScoped
public class Processor {

   private MeterRegistry registry;
   private Timer timer;

   // Quarkus injects the MeterRegistry
   public Processor(MeterRegistry registry) {
       this.registry = registry;
       timer = Timer.builder("pipelineLatency")
           .description("The latency of the whole pipeline.")
           .publishPercentiles(0.5, 0.75, 0.95, 0.98, 0.99, 0.999)
           .percentilePrecision(3)
           .distributionStatisticExpiry(Duration.ofMinutes(5))
           .register(registry);
   }

   public void processMessage(ConsumerRecord<String, String> message) {
       /*
           Do message processing
        */
       // Retrieve the kafka header
       Optional.ofNullable(message.headers().lastHeader("pipelineIngestionTimestamp"))
           // Get the value of the header
           .map(Header::value)
           // Read the bytes as String
           .map(v -> new String(v, StandardCharsets.UTF_8))
           // Parse as long epoch in millisecond
           .map(v -> {
               try {
                   return Long.parseLong(v);
               } catch (NumberFormatException e) {
                   // The header can't be parsed as a Long
                   return null;
               }
           })
           // Calculate the duration between the start and now
           // If there is a discrepancy in the clocks the calculated
           // duration might be less than 0. Those will be dropped by MicroMeter
           .map(t -> System.currentTimeMillis() - t)
           .ifPresent(d -> timer.record(d, TimeUnit.MILLISECONDS));
   }
}
The timer metric with aggregation can then be retrieved via the REST endpoint at https://quarkusHostname/metrics.
# HELP pipelineLatency_seconds The latency of the whole pipeline.
# TYPE pipelineLatency_seconds summary
pipelineLatency_seconds{quantile="0.5",} 0.271055872
pipelineLatency_seconds{quantile="0.75",} 0.386137088
pipelineLatency_seconds{quantile="0.95",} 0.483130368
pipelineLatency_seconds{quantile="0.98",} 0.48915968
pipelineLatency_seconds{quantile="0.99",} 0.494140416
pipelineLatency_seconds{quantile="0.999",} 0.498072576
pipelineLatency_seconds_count 168.0
pipelineLatency_seconds_sum 42.581
# HELP pipelineLatency_seconds_max The latency of the whole pipeline.
# TYPE pipelineLatency_seconds_max gauge
pipelineLatency_seconds_max 0.498
We then ingest those metrics in LogicMonitor as DataPoints using collectors.
Step-by-step setup for Quarkus Micrometer
To integrate Micrometer with Quarkus for seamless microservice monitoring, follow these steps:
1. Add Dependencies: Add the required Micrometer and Quarkus dependencies to enable metrics collection and reporting for your microservices.
gradle
Copy code
implementation 'io.quarkus:quarkus-micrometer:1.11.0.Final'
implementation 'io.micrometer:micrometer-registry-prometheus:1.6.3'2. Enable REST endpoint: Configure Micrometer to expose metrics via a REST endpoint, such as /metrics.
3. Use annotations for metrics: Apply Micrometer annotations like @Timed and @Counted to the methods where metrics need to be tracked.
4. Set up a registry: Use Prometheus as a registry to pull metrics from Quarkus via Micrometer. Here’s an example of how to set up a timer:
java
Copy code
Timer timer = Timer.builder("pipelineLatency")
.description("Latency of the pipeline") .publishPercentiles(0.5, 0.75, 0.95, 0.98, 0.99, 0.999) .register(registry);5. Monitor via the endpoint: After setup, retrieve and monitor metrics through the designated REST endpoint:
urlCopy codehttps://quarkusHostname/metricsPractical use cases for using Micrometer in Quarkus
Quarkus and Micrometer offer a strong foundation for monitoring microservices, providing valuable insights for optimizing their performance. Here are some practical applications:
- Latency tracking: Use Micrometer to measure the time it takes for messages to move through your microservice pipeline. This helps identify bottlenecks and improve processing efficiency.
- Anomaly detection: By continuously analyzing metrics over time, you can detect unusual patterns in message processing rates or spikes in system latency, letting you address issues before they impact performance.
- Resource monitoring: Track JVM metrics like memory usage and CPU consumption to optimize resource allocation and ensure your services run smoothly.
- Custom KPIs: Tailor metrics to your specific business objectives, such as message processing speed or response times, allowing you to track key performance indicators that matter most to your organization.
LogicMonitor microservice technology stack
LogicMonitor’s Metric Pipeline, where we built out multiple microservices with Quarkus in our environment, is deployed on the following technology stack:
- Java 11 (corretto, cuz licenses)
- Kafka (managed in AWS MSK)
- Kubernetes
- Nginx (ingress controller within Kubernetes)

How do we correlate configuration changes to metrics?
Once those metrics are ingested in LogicMonitor, they can be displayed as graphs or integrated into dashboards. They can also be used for alerting and anomaly detections, and in conjunction with ops notes, they can be visualized in relation to infrastructure or configuration changes, as well as other significant events.
Below is an example of an increase in processing duration correlated to deploying a new version. Deploying a new version automatically triggers an ops note that can then be displayed on graphs and dashboards. In this example, this functionality facilitates the correlation between latency increase and service deployment.

Tips for efficient metrics collection and optimizing performance
To get the most out of Quarkus and Micrometer, follow these best practices for efficient metrics collection:
- Focus on Key Metrics: Track the metrics that directly impact your application’s performance, such as latency, throughput, and resource usage. This helps you monitor critical areas that influence your overall system health.
- Use Percentile Data: Analyzing percentile values like p95 and p99 allows you to spot outliers and bottlenecks more effectively than relying on averages. This gives you deeper insights into performance anomalies.
- Monitor Custom Metrics: Customize the metrics you collect to match your application’s specific needs. Don’t limit yourself to default metrics. Tracking specific business-critical metrics will give you more actionable data.
How to Track Anomalies
All of our microservices are monitored with LogicMonitor. Here’s an example of Anomaly Detection for the pipeline latencies 95 percentile. LogicMonitor dynamically figures out the normal operating values and creates a band of expected values. It’s then possible to define alerts when values fall outside the generated band.

As seen above, the integration of MicroMeter with Quarkus allows in conjunction with LogicMonitor a straightforward, easy, and quick way to add visibility into our microservices. This ensures that our processing pipeline provides the most value to our clients while minimizing the monitoring effort for our engineers, reducing cost, and increasing productivity.
Quarkus With Micrometer: Unlock the Power of Real-Time Insights
Integrating Micrometer with Quarkus empowers real-time visibility into the performance of your microservices with minimal effort. Whether you’re monitoring latency, tracking custom KPIs, or optimizing resource usage, this streamlined approach simplifies metrics collection and enhances operational efficiency.
Leverage the combined strengths of Quarkus and Micrometer to proactively address performance issues, improve scalability, and ensure your services are running at peak efficiency.
FAQs
How does Micrometer work with Quarkus?
Micrometer integrates seamlessly with Quarkus by providing a vendor-neutral interface for collecting and exposing metrics. Quarkus offers an extension that simplifies the integration, allowing users to track JVM and custom metrics via annotations like @Timed and @Counted and expose them through a REST endpoint.
What are the benefits of using Micrometer in a microservice architecture?
Using Micrometer in a microservice architecture provides observability, real-time visibility into the performance of individual services, helping detect anomalies, track latency, and monitor resource usage. It supports integration with popular monitoring systems like Prometheus, enabling efficient metrics collection and analysis across microservices, improving scalability and reliability.
How do you set up Micrometer metrics in Quarkus?
To set up Micrometer metrics in Quarkus, add the necessary dependencies (quarkus-micrometer and a registry like micrometer-registry-prometheus). Enable metrics exposure via a REST endpoint, apply annotations like @Timed to track specific metrics, and configure a registry (e.g., Prometheus) to pull and monitor the metrics.
What are common issues when integrating Micrometer with Quarkus, and how can they be resolved?
Common issues include misconfigured dependencies, failure to expose the metrics endpoint, and incorrect use of annotations. These can be resolved by ensuring that the proper dependencies are included, that the REST endpoint for metrics is correctly configured, and that annotations like @Timed and @Counted are applied to the correct methods.
How do I monitor a Quarkus microservice with Micrometer?
To monitor a Quarkus microservice with Micrometer, add the Micrometer and Prometheus dependencies, configure Micrometer to expose metrics via a REST endpoint, and use annotations like @Timed to track important performance metrics. You can then pull these metrics into a monitoring system like Prometheus or LogicMonitor for visualization and alerting.
Microservices are the future of software development. This approach serves as a server-side solution to development where services remain connected but work independently. More developers are using microservices to improve performance, precision, and productivity, and analytical tools provide them with valuable insights about performance and service levels.
The argument for microservices is getting louder: Different teams can work on services without affecting overall workflows, something that’s not possible with other architectural styles. In this guide, we’ll take a deep dive into microservices by learning what they are, what they do, and how they benefit your team.
What are microservices?
In software development, microservices are an architectural style that structures applications as a collection of loosely connected services. This approach makes it easier for developers to build and scale apps. Microservices differ from the conventional monolithic style, which treats software development as a single unit.
The microservices method breaks down software development into smaller, independent “chunks,” where each chunk executes a particular service or function. Microservices utilize integration, API management, and cloud deployment technologies.
The need for microservices has come out of necessity. As apps become larger and more complicated, developers need a novel approach to development—one that lets them quickly expand apps as user needs and requirements grow.
Did you know that more than 85 percent of organizations with at least 2,000 employees have adopted microservices since 2021?
Why use microservices?
Microservices bring multiple advantages to teams like yours:
Scalability
Microservices are much easier to scale than the monolithic method. Developers can scale specific services rather than an app as a whole and execute bespoke tasks and requests together with greater efficiency. There’s less work involved because developers concentrate on individual services rather than the whole app.
Faster development
Microservices lead to faster development cycles because developers concentrate on specific services that require deployment or debugging. Speedier development cycles positively impact projects, and developers can get products to market quicker.
Improved data security
Microservices communicate with one another through secure APIs, which might provide development teams with better data security than the monolithic method. Because teams work somewhat in silos (though microservices always remain connected), there’s more accountability for data security because developers handle specific services. As data safety becomes a greater concern in software development, microservices could provide developers with a reliable security solution.
Better data governance
Just like with data security, where teams handle specific services rather than the entire app, microservices allow for greater accountability when complying with data governance frameworks like GDPR and HIPAA. The monolithic method takes more of a holistic approach to data governance, which can cause problems for some teams. With microservices, there’s a more specific approach that benefits compliance workflows.
Multiple languages and technologies
Because teams work somewhat independently of each other, microservices allow different developers to use different programming languages and technologies without affecting the overall architectural structure of software development. For example, one developer might use Java to code specific app features, while another might use Python. This flexibility results in teams that are programming and technology “agnostic.”
For example, see how we scaled a stateful microservice using Redis.
Did you know 76 percent of organizations believe microservices fulfill a crucial business agenda?
Microservices architecture
Microservice architecture sounds a lot more complicated than it is. In simple terms, the architecture comprises small independent services that work closely together but ultimately fulfill a specific purpose. These services solve various software development problems through unique processes.
A good comparison is a football team, where all players share the same objective: To beat the other team. However, each player has an individual role to play, and they fulfill it without impacting any of the other players. Take a quarterback, for example, who calls the play in the huddle. If the quarterback performs poorly during a game, this performance shouldn’t affect the other team members. The quarterback is independent of the rest of the players but remains part of the team.
Unlike monolithic architectures, where every component is interdependent, microservices allow each service to be developed, deployed, and scaled independently.
Did you know the cloud microservices market was worth 1.63 billion in 2024?
Microservices vs. monolithic architectures
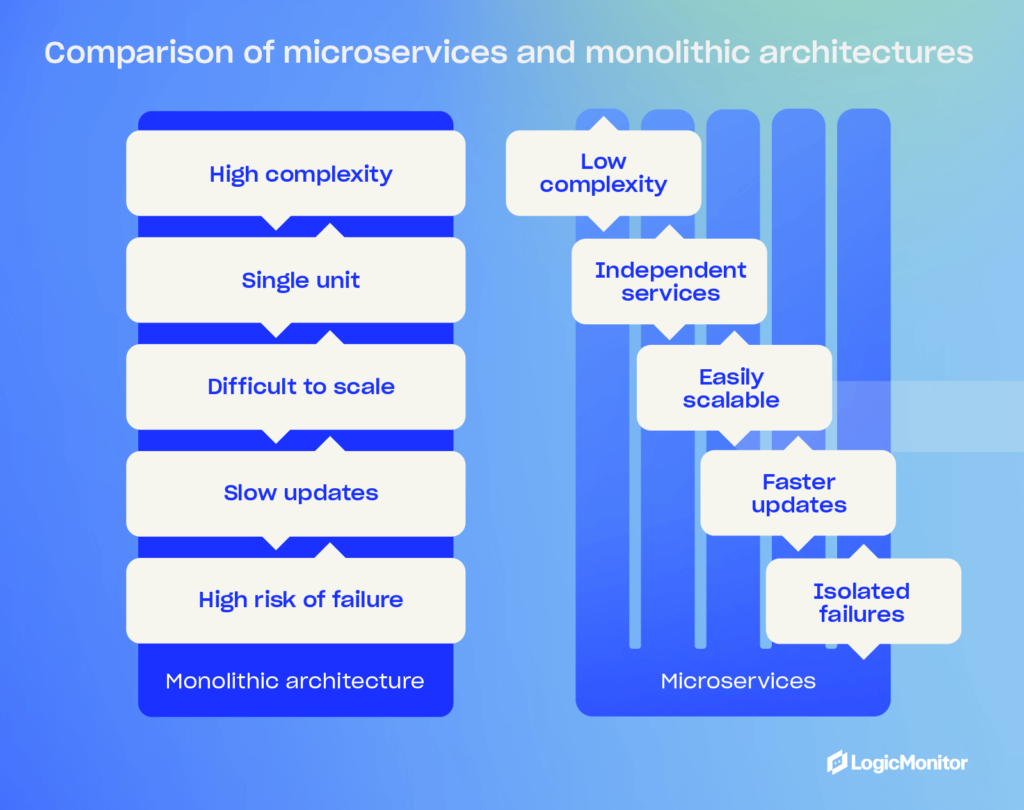
When you’re considering a microservices architecture, you’ll find that they offer a lot of benefits compared to a traditional monolithic architecture approach. They will allow your team to build agile, resilient, and flexible software. On the other hand, monolithic software is inherently complex and less flexible—something it pays to avoid in today’s world of increasingly complex software.
So, let’s look at why businesses like yours should embrace microservices, and examine a few challenges to look out for.
Microservices architecture advantages
- Agility and speed: By breaking your applications into smaller, independent services, you can speed up development cycles by allowing your teams to work on various services simultaneously, helping them perform quicker updates and release features faster.
- Resilience: Service independence and isolation improve your software’s overall stability since a service going offline is less likely to disrupt other services, meaning your application continues running while you troubleshoot individual service failures.
- Flexibility: Your team can use different technologies and frameworks for different services, allowing them to choose the best tools for specific tasks instead of sticking with a few specific technologies that may not be the right choice.
Monolithic architecture disadvantages
- Complexity and risk: When you build applications as single, cohesive units, your team needs to modify existing codes across several layers, including databases, front-ends, and back-ends—even when you only require a simple change. The process is time-consuming and risky, which adds stress to your team if they need to make regular changes, and a single change can impact entire systems.
- High dependency: When your application is made of highly dependent components, isolating services is more challenging. Changes to one part of a system can lead to unintended consequences across your entire application, resulting in downtime, impacted sales, and negative customer experience.
- Cost and inflexibility: Making changes to monolithic applications requires coordination and extensive testing across your teams, which means you’ll see a slower development process, potentially hindering your ability to respond quickly to problems and market demands.
Microservices in the cloud (AWS and Azure)
Perhaps the cloud is the most critical component of the microservices architecture. Developers use Docker containers for packaging and deploying microservices in private and hybrid cloud environments (more on this later.) Microservices and cloud environments are a match made in technological heaven, facilitating quick scalability and speed-to-market. Here are some benefits:
- Microservices run on different servers, but developers can access them from one cloud location.
- Developers make back-end changes to microservices via the cloud without affecting other microservices. If one microservice fails, the entire app remains unaffected.
- Developers create and scale microservices from any location in the world.
Various platforms automate many of the processes associated with microservices in the cloud. However, there are two developers should consider:
Once up and running, these systems require little human intervention from developers unless debugging problems occur.
AWS
Amazon pioneered microservices with service-based architecture many years ago. Now its AWS platform, available to developers worldwide, takes cloud microservices to the next level. Using this system, developers can break down monolithic architecture into individual microservices via three patterns: API-driven, event-driven, and data streaming. The process is much quicker than doing it manually, and development teams can create highly scalable applications for clients.
Azure
Azure is another cloud-based system that makes microservices easier. Developers use patterns like circuit breaking to improve reliability and security for individual services rather than tinkering with the whole app.
Azure lets you create APIs for microservices for both internal and external consumption. Other benefits include authentication, throttling, monitoring, and caching management. Like AWS, Azure is an essential tool for teams that want to improve agile software development.
Did you know the global cloud microservices market is expected to grow from USD 1.84 billion in 2024 to USD 8.33 billion by 2032, with a CAGR of 20.8%?
How are microservices built?
Developers used to package microservices in VM images but now typically use Docker containers for deployment on Linux systems or operating systems that support these containers.
Here are some benefits of Docker containers for microservices:
- Easy to deploy
- Quick to scale
- Launched in seconds
- Can deploy containers after migration or failure
Microservices in e-Commerce
Retailers used to rely on the monolithic method when maintaining apps, but this technique presented various problems:
- Developers had to change the underlying code of databases and front-end platforms for customizations and other tweaks, which took a long time and made some systems unstable.
- Monolithic architecture requires services that remain dependent on one another, making it difficult to separate them. This high dependency meant that some developers couldn’t change services because doing so would affect the entire system, leading to downtime and other problems that affected sales and the customer experience.
- Retailers found it expensive to change applications because of the number of developers that required these changes. The monolithic model doesn’t allow teams to work in silos, and all changes need to be tested several times before going ‘live.’
Microservices revolutionized e-commerce. Retailers can now use separate services for billing, accounts, merchandising, marketing, and campaign management tasks. This approach allows for more integrations and fewer problems. For example, developers can debug without affecting services like marketing and merchandising if there’s an issue with the retailer’s payment provider. API-based services let microservices communicate with one another but act independently. It’s a much simpler approach that benefits retailers in various niches.
Real-world examples of microservices in e-commerce
If you aren’t sure if microservers are the best choice for your company, just look at some of the big players that use microservices to serve their customers worldwide. Here are a few examples that we’ve seen that demonstrate how you can use microservices to build and scale your applications.
Netflix
Netflix began transitioning to microservices after a major outage due to a database failure in 2008 that caused four days of downtime, which exposed the limitations of its monolithic architecture. Netflix started the transition to microservices in 2009 and completed the migration to microservices in 2011. With microservices performing specific functions, such as user management, recommendations, streaming, and billing, Netflix can deploy new features faster, scale services independently based on demand, and improve the overall resilience of its platform.
Amazon
Amazon shifted to microservices in the early 2000s after moving to service-oriented architecture (SOA) to manage its large-scale e-commerce platform. Amazon’s microservices helped it handle different aspects of the company’s platform, such as order management, payment processing, inventory, and customer service. This helped Amazon innovate rapidly, handle massive traffic, and maintain uptime—even during peak shopping periods like Black Friday.
Spotify
Spotify uses microservices to support its platform features like playlist management, search functionality, user recommendations, and music streaming. Spotify’s approach allows the company to innovate quickly, scale individual services based on user demand, and improve the resilience of its platform against failures. Spotify implemented microservices between 2013 and 2014 to handle increasing user demand and feature complexity as it expanded globally.
Airbnb
Airbnb employs microservices to manage its booking platform services for property listings, user authentication, search, reservations, and payments. Implemented between 2017 and 2020, microservices helped Airbnb scale its services as the company experienced massive growth. Airbnb was able to improve performance based on user demand and deploy features more quickly.
PayPal
Since early 2013, PayPal has used microservices to handle payment processing, fraud detection, currency conversion, and customer support services. Microservices helps PayPal offer high availability, improve transaction processing times, and scale its services across different markets and geographies.
How do you monitor microservices?
Various platforms automate the processes associated with microservices, but you will still need to monitor your architecture regularly. As you do, you’ll gain a deeper understanding of software development and how each microservice works with the latest application metrics. Use them to monitor key performance indicators like network and service performance and improve debugging.
Here’s why you should monitor microservices:
- Identify problems quickly and ensure microservices are functioning correctly.
- Share reports and metrics with other team members and measure success over time.
- Change your architecture to improve application performance.
The best monitoring platforms will help you identify whether end-user services are meeting their SLAs and help teams drive an optimized end-user experience.
Tools like LM Envision provide comprehensive monitoring solutions that help you maintain high-performance levels across all your services.
Did you know the cloud microservices market could reach $2.7 billion by 2026?
Best practices for implementing microservices
As you’ve seen above, microservices will offer many benefits to your business. But they aren’t something you can just substitute in and expect to run flawlessly. Here are a few best practices that will help you implement microservices in your application:
- Start small: Switching to microservices isn’t something you should do all at once. Start small by breaking your application down into smaller components and do it a little at a time. This approach will allow your team to learn and adapt as they go.
- Use automation tools: Use CI/CD pipelines to automate the deployment and management of microservices. Automation reduces the chance of your team making mistakes and speeds up repetitive deployment processes to reduce development time.
- Ensure robust monitoring and logging: Implement comprehensive monitoring and logging solutions so your team can track the performance of each microservice and quickly identify any issues.
- Prioritize security: Each service can become a potential attack entry point with microservices and may be harder to secure and monitor for your team because of the more distributed architecture. Implement strong authentication, encryption, and other security measures to protect the system.
- Maintain communication between teams: Since microservices allow your team to work independently on different parts of the application, it’s crucial to maintain clear communication and collaboration to ensure that all services work together seamlessly.
What are the benefits of microservices? Why do they exist today?
Now that we’ve looked at microservices and a few primary benefits, let’s recap some of them to learn more about why they exist today.
- Greater scalability: Although microservices are loosely connected, they still operate independently, which allows your team to modify and scale specific services without impacting other systems.
- Faster development: Your team can move faster by working on individual services instead of a monolithic application, meaning you can focus on specific services without worrying as much about how changes will impact the entire application.
- Better performance: You can focus on the performance of individual services instead of entire applications, changing and debugging software at a smaller level to learn how to optimize for the best performance.
- Enhanced security and data governance: Using secure APIs and isolated services will help your team improve security by controlling access to data, securing individual services, and monitoring sensitive services—helping facilitate compliance with security regulations like HIPPA and GDRP.
- Flexible technology: You aren’t tied to specific programming languages, frameworks, databases, and other technologies with microservices, which means you can pick the best tool for the job for specific tasks.
- Cloud-native capabilities: Platforms like AWS and Azure make creating and managing microservices easier, which means your team can build, deploy, and manage software from anywhere in the world without having a physical infrastructure.
- Quick deployment: Software like Docker is available to make deploying microservices easy for your team, helping them streamline deployment and ensure microservices run in the exact environment they were built in.
The future of microservices
Microservices are a reliable way to build and deploy software, but they are still changing to meet the evolving needs of businesses. Let’s look at what you can expect to see as microservices continue to evolve in the future.
Serverless Architecture
Serverless architecture allows you to run microservices without managing any other infrastructure. AWS is already developing this technology with its Lambda platform, which takes care of all aspects of server management.
PaaS
Microservices as a Platform as a Service (PaaS) combines microservices with monitoring. This revolutionary approach provides developers with a centralized application deployment and architectural management framework. Current PaaS platforms that are well-suited for microservices are Red Hat OpenShift and Google App Engine.
In the future, PaaS could automate even more processes for development teams and make microservices more effective.
Multi-Cloud Environments
Developers can deploy microservices in multiple cloud environments, which provides teams with enhanced capabilities. This can mean using multiple cloud providers, and even combining cloud services with on-prem infrastructure (for cases when you need more control over the server environment and sensitive data).
“Microservices related to database and information management can utilize Oracle’s cloud environment for better optimization,” says technology company SoftClouds. “At the same time, other microservices can benefit from the Amazon S3 for extra storage and archiving, all the while integrating AI-based features and analytics from Azure across the application.”
Service mesh adoption
Service meshes are becoming critical for managing more complex microservice ecosystems. They will provide your team with a dedicated infrastructure for handling service-to-service communication. This infrastructure will help improve monitoring, incident response, and traffic flow.
DevOps and AIOps
The integration of DevOps and AIOps with microservices and ITOps will help streamline development and operations. For example, new DevOps tools will help developers automate many deployment tasks instead of manually configuring individual environments. AIOps will also help your team, as it uses AI and machine learning to improve monitoring and reduce the time your team needs to look through data to find problems.
Event-driven architecture
Event-driven architecture is gaining more popularity among microservices because it allows for more de-coupled, reactive systems that are easier to manage. It allows them to process real-time data and complex event sequences more efficiently.
Advanced observability
As multi-cloud environments become more common, more advanced tools are needed to monitor these environments. Hybrid observability solutions will help your team manage hybrid environments to gather performance metrics (CPU usage, memory usage) about your services in a central location and send alerts when something goes wrong. Advanced observability solutions also use AI to monitor environments to ensure your team only sees the most relevant events and trace information that indicates a potential problem.
Before You Go
Microservices have had an immeasurable impact on software development recently. This alternative approach to the monolithic architectural model, which dominated software development for years, provides teams a streamlined way to create, monitor, manage, deploy, and scale all kinds of applications via the cloud. Platforms like AWS and Azure facilitate this process.
As you learn more about software development and microservices, you’ll discover new skills and become a more confident developer who solves the bespoke requirements of your clients. However, you should test your knowledge regularly to make every development project successful.
Do you want to become a more proficient software developer? Microservices Architecture has industry-leading self-assessments that test your microservice readiness, applicability, and architecture. How well will you do? Get started now.
Known for its built-in reliability and cross-platform compatibility, FluentD addresses one of the biggest challenges in big data collection—the lack of standardization between collection sources.
With a decentralized ecosystem, FluentD offers a way to seamlessly collect logs from applications on Kubernetes. The free open-source data collector is positioned to support big data as well as unstructured and semi-structured data sets for better usage, understanding, and analysis of your log data.
This post defines FluentD, shows examples of its use in business, and provides tips on how to get started with FluentD in Kubernetes.
What is FluentD?
A cross-platform software project developed for Treasure Data, FluentD, helps solve the challenge of big data log collection. Licensed under Apache License v2.0 and written in Ruby, the program bridges the gap between data collection sources by supporting both Linux and Windows.
FluentD tracks Windows event logs with the latest versions and helps unify the collection and consumption of data, providing a better understanding of how it can be used effectively for business. After logs are read and matched with a tail input plug-in and then sent to Elasticsearch, Cloudwatch, or S3, FluentD can collect, parse, and distribute the log files.
With a seamless sync between Kubernetes, FluentD promotes better monitoring and managing of services and infrastructure. Kubernetes allows you to fine-tune your performance as you look for faults.
Who uses FluentD?
Companies such as Amazon Web Services, Change.org, CyberAgent, DeNA, Drecom, GREE, and GungHo use FluentD for its easy installation and customization with a plugin repository for most use cases. The program offers visualization of metrics, log monitoring, and log collection. Furthermore, as an open-source software project, its community of users is dedicated to making continuous improvements.
How does FluentD log?
FluentD in Kubernetes helps collect log data from data sources using components that compile data from Kubernetes (or another source) to transform logs and then redirect data to give an appropriate data output result. In turn, data output plug-ins help collect and repurpose the data so that log data can be better analyzed and understood.
FluentD architecture
FluentD is designed to be a flexible and light solution with hundreds of plug-in options to support outputs and sources. FluentD in Kubernetes offers a unifying layer between log types. As plug-ins are built and used with FluentD, more ways to analyze application logs, clickstreams, and event logs become available.
You can break FluentD down into several components.
Plugin ecosystem
One of FluentD’s greatest strengths is its extensibility. It has plugins available that allow integrations with most third-party applications (AWS, Azure, Elasticsearch, MySQL, and others). These allow FluentD to collect data, process it in the FluentD engine, and output it to the storage environment of your choice.
There are many types of plugins available to use:
- Input: Collect logs from various sources, including HTTP, REST APIs, and other sources.
- Output: Allow output forwarding to a wide range of destinations, such as SQL databases, cloud services, and other log ingestion services.
- Filtering: Helps custom processing and transformation of log data by removing events, adding fields, and hiding data.
- Parser: Helps FluentD parse data in different formats, such as JSON and CSV.
- Formatting: Allows users to create custom output formats based on their needs or use pre-existing formats.
- Buffer: Used to temporarily store input streams in memory or files.
- Storage: Store FluentD’s internal state in memory, storage, or key-value stores like MongoDB or Redis.
- Service discovery: Helps users extend service discovery to meet their unique needs.
- Metrics: Store FluentD’s internal metrics locally.
Buffering mechanism
FluentD’s buffering mechanism is what allows it to efficiently process large amounts of log data quickly and get data where it needs to go. It needs effective buffering to ensure all data gets processed and nothing gets lost in translation.
It does this with effective processing usage using chunks, memory storage, backpressure mitigation, and retry mechanisms.
- Chunks: Chunks are small groups of records (normally around 2 MB each) created to allow for easier processing.
- Memory: The space FluentD uses to process chunks. It is normally in system memory because of its speed, but it is configurable based on the user’s needs.
- Backpressure mitigation: Process to help high-load environments by limiting the amount of memory used using mem_buffer_limit and file system buffering.
- Retry mechanism: Helps FluentD process failed processing requests and marks a chunk as irrecoverable if it can’t be processed.
Configuration files
FluentD uses a hierarchical file structure to handle system configuration. It uses configuration files that contain directives for input sources, output sources, matching, system directives, and routing.
One of FluentD’s strengths is its dynamic run configuration—you don’t need to reboot the entire system to enforce changes. This allows for easier configuration and testing of new environments.
FluentD also allows for complex routing based on your logs and unique situations. It offers tags and labels in configuration files to help direct output to the right source.
Resource optimization
Environments using FluentD can use a lot of resources—especially when processing large amounts of data or working in resource-constrained environments.
FluentD offers a few solutions to help these situations:
- Fluent Bit: A lightweight log forwarder ideal for edge nodes that connect to cloud infrastructure
- FluentD Forwarder: A stripped-down version of FluentD designed for resource-constrained environments
Why is FluentD important?
FluentD includes a unified logging layer, making logs accessible and usable as they are generated—allowing them to quickly view logs on monitoring platforms like LogicMonitor. On top of that, data sources can be decoupled to iterate data faster, creating avenues for more effective and efficient uses. Here are the top reasons why FluentD in Kubernetes is the best open-source software for data collection:
- Simple to set up and customize with plugins: FluentD features a 10-minute setup time and includes more than 500 plug-ins that support volumes of use-case scenarios.
- Free and open source: FluentD in Kubernetes is available for use without restriction and is flexible enough to meet most company needs.
- Reliability and high performance: More than 5,000 companies already depend on FluentD for its dependable and high-quality data collection results.
- Community support: The FluentD in Kubernetes community offers dedicated support for its growth and development through several resources, including GitHub and StackOverflow discussions, docs, a dedicated Slack channel, Twitter and Facebook pages, and a bug/feature tracker.
- Compatible: FluentD works to standardize and support cross-platform syncing of data for big data compatibility, analysis, and reuse.
Best practices for FluentD
FluentD is rated one of the easiest to maintain and install data collection tools compared to other choices like Scribe and Flume. Regardless of the tool, the goal is to get the fastest and most streamlined data-collecting experience. These best practices cover FluentD’s quick setup, which leads to quick optimization of logs and processing.
Avoid extra computations
FluentD is designed to be simple and easy to use, but adding extra computations to the configuration could make the system less robust, as it may struggle to maintain and read data consistently. It’s typically well-advised to streamline data as much as possible throughout data processing, and FluentD is no different. While FluentD is flexible enough to handle even demanding data requirements, maintaining a simple data-collecting system is best.
Use multi-process input plugins
If you find that your CPU is overloading, try a multi-process. Multi-process input plug-ins allow the spin-off of multiple processes with additional configuration requirements. While multiple child processes take time to set up, they help prevent CPU overload and bottlenecks of incoming FluentD records.
Reduce memory usage with Ruby GC parameters
Ruby GC parameters tune performance and configure parameters. RUBY_GC_HEAP_OLDOBJECT_LIMIT_FACTOR lowers values and improves memory usage (default is 2.0).
How does FluentD in Kubernetes work?
FluentD is deployed in Kubernetes as a DaemonSet so that each node has one pod. As a result, logs are collected from K8s clusters and can be read from the appropriate directories created for Kubernetes. In addition, logs can be scrapped, converted to structured JSON data, and pushed to Elasticsearch via the tail input plug-in.
FluentD in Kubernetes + LogicMonitor
FluentD allows the analysis of a myriad of logs regardless of the organization. The program’s flexibility and seamless cross-platform compatibility offer superb communication of real-time data analysis without the danger of integrating bad data or experiencing the torture of a slowdown.
LogicMonitor is determined to provide effective solutions for teams using FluentD for logging.
LogicMonitor’s Envision platform offers a comprehensive hybrid observability solution for organizations that need help monitoring hybrid environments. Its integration with FluentD will allow your organization to unlock FluentD’s potential and take advantage of everything it can offer.
Contact LogicMonitor to learn more about our Log Analysis today!
Observability tools, like OpenTelemetry and Prometheus, are critical for ensuring optimal performance and reliability in cloud-native applications. While OpenTelemetry provides comprehensive telemetry data collection, supporting traces, logs, and metrics for whole-system observability, Prometheus excels in monitoring and analyzing time-series data.
While you can use Prometheus and OpenTelemetry together, they have distinctly different capabilities that set each apart. Prometheus is ideal for dynamic systems and focused monitoring of individual components, and OpenTelementry offers a unified view across distributed systems. Both OpenTelemetry and Prometheus provide options for data collection but are significantly different from one another.
This comprehensive overview of OpenTelemetry and Prometheus covers key features and capabilities, as well as advantages and disadvantages, of both tools.
What is OpenTelemetry (OTel)?
For cloud-native applications, OpenTelemetry is the future of instrumentation. It’s the first critical step that allows companies to monitor and improve application performance. OpenTelemetry also supports multiple programming languages and technologies.
Key features and capabilities
In addition to collecting telemetry data across applications, OpenTelemetry provides services and supporting infrastructures for those applications. It is a vendor-neutral telemetry standard used throughout the industry. OTel combines cloud technologies, orchestration engines, and containers to facilitate faster digital innovation.
Of course, OpenTelemetry also provides enterprises with flexibility by allowing them to standardize the way they collect data with less vendor lock-in and greater interoperability. The best way for companies to move forward is by understanding their customers’ needs and how they interact with their online experiences.
Supported programming languages and technologies
OpenTelemetry’s vendor-neutral open-source tools, APIs, and SDKs support multiple programming languages, including Go, Java, and Python. These tools work together to execute the measurement by specifying what needs to be measured, collecting relevant data, cleaning and organizing information, and exporting data to a monitoring backend.
What is Prometheus?
Prometheus is a metrics monitoring tool used for monitoring time-series data that changes over time. Initially developed at SoundCloud in 2012, the CloudNative Computing Foundation accepted Prometheus in 2016 as the second project slated to graduate from the foundation after the open-source system Kubernetes.
Key features and capabilities
Prometheus prioritizes reliability over accuracy, making it an ideal solution for cloud-based dynamic systems, such as microservices. The system also works with billing applications that require accuracy and may provide the best solution for relative monitoring applications and infrastructures.
Historical background and community support
SoundCloud originally developed Prometheus as a toolkit for alerting and monitoring systems. It’s a free, open-source software application, so it’s easy to integrate natively. Since its launch, many organizations and companies have adopted Prometheus, and the project has an active user and developer community.
Performance and scalability
OTel is becoming the industry standard in telemetry data generation. Distributed systems rely heavily on observability to gauge their health, and telemetry data makes observability possible. Using OpenTelemetry, companies can generate telemetry data without depending on multiple vendors.
OpenTelemetry allows companies to collect telemetry data regardless of the provider. Distributed systems rely heavily on telemetry data for monitoring their states. Therefore, a global standard is required for microservices and polyglot architectures. As of now, OTel is well positioned to fill this void.
Furthermore, OpenTelemetry’s components are loosely coupled to provide integration options. The main OpenTelemetry components are:
- Application programming interfaces (APIs): Instrument code and coordinate data collection across entire systems.
- Data specifications: The data specifications define the OpenTelemetry Protocol (OTLP) and relevant semantic conventions used by applications.
- Software development kits (SDKs): Using libraries, SDKs implement and support APIs for data gathering, processing, and exporting. The SDKs are also language-specific, similar to APIs.
- OpenTelemetry Collector: Can be used across a wide range of systems, whether open-source or commercial.
In short, OpenTelemetry APIs, SDKs, libraries, and integrations can collect and manage telemetry data (traces, metrics, and logs). The OpenTelemetry project was created through a merger between OpenCensus and OpenTracing. The Cloud Native Computing Foundation (CNCF) also incubated Kubernetes.
How is Prometheus built?
Prometheus stores data locally on disk so that it can be accessed and queried quickly. It also allows metrics to be stored remotely. Prometheus servers are stand-alone and do not rely on remote services or network storage.
How does Prometheus monitoring work?
In Prometheus, data is collected as a time series generated by an underlying pull model. At specific intervals of time, Prometheus queries a list of data sources or exporters. For reference and querying, Prometheus data is stored in metrics.
Prometheus stores data locally on disk so it can be accessed and queried quickly. It also allows metrics to be stored remotely. In addition, the Prometheus servers are stand-alone and do not rely on remote services or network storage.
As a multidimensional data model, Prometheus supports PromQL*, a language that allows companies to query the metrics data collected. Not only can companies pull model data collection over HTTP with Prometheus, but it also supports a basic visualization layer and offers an alert manager to handle alerts.
What is PromQL?
Prometheus Query Language, or PromQL, is the query language provided by Prometheus for selecting and aggregating data. It is precisely adjusted to work in convention with a time-series database and offers time-related query functionalities.
What are the features of Prometheus?
Prometheus’s main features are:
- Autonomous, dedicated server nodes that do not rely on distributed storage
- A data model that identifies time series data by metric name and key/value pairs
- Integrated dashboards that support internal graphic displays
- Choice of static configuration or service discovery for the discovery of targets
- Use of a pull model over an HTTP connection for time series collection
- Time series pushed through an intermediary gateway
- Flexible querying with PromQL to leverage dimensionality
How does OTel work?
OpenTelemetry works with three major forms of telemetry data: tracing, metrics, and logging. OTel can help track requests within a system to identify performance issues and failures. In terms of metrics, the system tracks and reports on processes through histograms, gauges, and other graphical reports that are easy to understand. Finally, the last way to analyze logging messages is to analyze those specific to a given application.
Tracing, metrics, and logging have always been crucial to observing a system across its entire lifecycle. However, the complexity of modern applications and resource layers makes it difficult to implement tracing across all services. For example, a single incident can be tracked for hours when paired with vague log data because the information needs to be siloed consistently.
OpenTelemetry (and other similar products) seeks to correct this problem through its consolidated system for metrics, tracing, and logging. GitHub provides a platform for those interested in participating in a community to influence and improve OpenTelemetry as an open-source project. Analyzing telemetry data can help create a multi-layered ecosystem. As a result, your company may be able to address performance issues more efficiently.
What are the features of OTel?
OpenTelemetry’s main features include the following:
- Support for telemetry data in consistent formats across all major programming
- Exports telemetry data in multiple formats to a backend of choice
- Allows logging, monitoring of metrics, and telemetry data tracing
- Supports multi-language and technology-agnostic instrumentation
Key differences between OpenTelemetry vs. Prometheus
Data collection and metrics
- OpenTelemetry: Provides unified data collection, handling metrics, traces, and logs.
- Prometheus: Focused primarily on metrics and time-series data.
Flexibility and integration
- OpenTelemetry: Vendor-neutral with high flexibility and broad ecosystem integration.
- Prometheus: Integrates well with other CNCF projects but is metrics-centric.
Visualization and storage
- OpenTelemetry: Lacks a built-in visualization layer and relies on external tools.
- Prometheus: Includes basic visualization capabilities with built-in storage.

OpenTelemetry advantages
- Better performance: Manages and generates telemetry efficiently.
- Collector: Allows companies to receive, process, and export telemetry data in various formats.
- Easy to use: Business-friendly, with documentation for troubleshooting and repairing bugs.
- Language support: Supports C++, Go, Java, Javascript, Python, and more.
- Libraries: Offers auto-instrument frameworks and libraries to reduce codebase change requirements.
- Observability: Integration points allow collected data to be ingested by observability platforms.
- Partners and backers: Includes Google, Microsoft, and other prominent cloud vendors.
- Flexibility: Vendor-neutral, which allows companies to switch tools.
OpenTelemetry disadvantages
- Lack of storage: Does not provide a visualization layer or backend storage.
- Poor support: Room for improvement with support and documentation.
Prometheus advantages
- Pull-built: Actively scrapes targets to retrieve metrics; server initiates HTTP call to fetch system/app metrics from endpoints to exporter.
- Control: Pull-based system enables rate control for flexibility in multiple scrap configurations; multiple rates for different targets allow better server control.
Prometheus disadvantages
- Limited use cases: Great tool for metrics monitoring but doesn’t go further than that.
- Full-stack: Not a full-stack application monitoring tool.
- Logs: Only tracks metrics, so users need to rely on other tools for logging.
- Static: Designed for a single machine; lacks flexibility and cannot scale horizontally.
- Time: Requires effort and time to effectively set up exporters for valuable visualization.
- Traces: Does not support traces or root cause analysis.
Best practices for integration with existing systems
Integrating OpenTelemetry
By following these practices, you can help ensure a smooth and effective OTel integration.
- Compatibility: Ensure that OpenTelemetry can work with your existing monitoring tools and backends.
- Collaboration: Work closely with development and operations teams to ensure agreement on observability goals.
- Gradual adoption: Start by instrumenting critical paths in your application, gradually expanding coverage as you need it.
- Custom instrumentation: Use manual instrumentation where automatic options aren’t feasible.
- Version management: Keep OpenTelemetry libraries updated to benefit from the most current improvements.
Integrating Prometheus
By following these practices, you can effectively integrate Prometheus into your existing systems.
- Start with core services: Ensure high availability and performance by monitoring the most critical services.
- Use exporters: Take advantage of official and community exporters to monitor various systems such as databases, caches, and hardware.
- Adjust scrape intervals: Dial in scrape intervals based on the criticality and nature of the data to balance performance and resource usage.
- Alerting: Configure alerting thresholds in Prometheus to receive notifications before any issues can impact users.
- Data retention: Manage data retention policies to balance storage costs with the need for historical data.
- Utilize service discovery: Use service discovery to dynamically manage targets as your infrastructure scales or changes.
- Documentation: Document your Prometheus configuration thoroughly, including tracked metrics, alerting rules, and dashboard setup.
- Security: Employ authentication access and network restrictions to secure Prometheus instances, preventing unauthorized access to sensitive metrics.
Setting up OpenTelemetry
This step-by-step guide provides an example of OpenTelemetry setup using Go.
- Check Go installation: Make sure Go is installed on your system. You can confirm this by running ‘go version‘ in your terminal.
- Set up a Go project: Navigate to your project directory or create a new one using ‘go mod init <module_name>‘ to initialize a Go module to manage dependencies.
- Install dependencies: Run ‘go get go.opentelemetry.io/otel‘ to install OpenTelemetry packages.
- Set up tracer: Initialize a tracer provider and configure it to export traces.
- Instrument code: Use the tracer to create spans around the code you want to monitor.
- Run your application: Execute your Go application; the telemetry data will be collected and exported.
- Analyze Data: Review the exported data using your chosen backend.
For more details on setting up OTel, visit the OpenTelemetry Go guide.
Setting up Prometheus
Getting started with Prometheus is fairly simple and straightforward. These steps will help you get your Prometheus setup underway.
- Download Prometheus: Get the latest version from the Prometheus website.
- Extract and configure: Unzip the file, navigate to the folder, and edit prometheus.yml to define scrape targets.
- Run Prometheus: Start Prometheus with ‘./prometheus –config.file=prometheus.yml‘.
- Access Web UI: Open http://localhost:9090 in your browser to access the Prometheus dashboard.
- Start monitoring: Use the UI to query and monitor your systems.
The Prometheus getting started guide offers more in-depth details for setting up Prometheus.
Why is OpenTelemetry important?
To collect and transmit telemetry data to backend platforms, OpenTelemetry is essential. The common instrumentation format overcomes visibility gaps across all services. In addition, engineers can install a new proprietary agent whenever a backend platform is changed.
OpenTelemetry also handles new technologies, unlike commercial solutions, which must be integrated to make products work together. Aside from simplifying alerting, troubleshooting, and debugging, OTel data is helpful for monitoring, too.
Collecting and analyzing telemetry data has always been used to understand system behavior. However, recent network complexity has made this more challenging. Tracing the cause of an individual incident in these labyrinthine systems can take hours or days.
OpenTelemetry can help correlate traces, logs, and metrics from across applications and services, improving observability. The open-source project also enables APM (application performance monitoring) and other vital functions by removing roadblocks to instrumentation. Ultimately, this results in better service reliability, reduced downtime, and efficiency in identifying and resolving incidents.
OpenTelemetry use cases
Distributed tracing
Organizations widely use OpenTelemetry to trace requests across complex microservice architectures. This helps developers identify performance bottlenecks and track the flow of requests. Shopify uses OTel for tracing in its distributed systems.
Monitoring cloud-native applications
OpenTelemetry provides unified observability across cloud-native environments, enabling effective monitoring of applications running on many kinds of modern infrastructures. Google integrates OpenTelemetry into its cloud-native services to give customers superior cloud monitoring capabilities.
Enhancing observability with metrics and logs
By collecting and correlating metrics, traces, and logs, OpenTelemetry gives teams a comprehensive view of their systems and provides root cause analysis. Microsoft employs OpenTelemetry in Azure services to standardize observability across its cloud platform.
Why is Prometheus important?
Prometheus is popular due to its powerful features for monitoring metrics, providing alerts, and automating responses to changing conditions with orchestration systems. In addition to collecting metrics—or concise descriptions of events, such as dates, times, and descriptive values—about applications and infrastructure, Prometheus can monitor performance. The Prometheus software gathers only a little bit of data about many things rather than collecting a lot of data about one thing.
Prometheus use cases
Infrastructure monitoring
Users rely on Prometheus to monitor servers, containers, and networking equipment and offer real-time data on system health and performance. Reddit relies on Prometheus to monitor its large-scale infrastructure, monitor the environment, and quickly identify issues.
Application performance monitoring (APM)
Prometheus collects metrics from applications to track performance and ensure reliable operation across connected environments. GitLab employs Prometheus to monitor their CI/CD pipeline performance and monitor application services to help maintain high availability and optimize application performance.
Alerting
Prometheus can integrate with alerting tools like Alertmanager to notify teams of issues based on custom thresholds, ensuring rapid response to incidents. SoundCloud, the pioneer of Prometheus, takes advantage of its alert functions to quickly notify them of issues in its streaming service infrastructure.
What the future holds
The future of OpenTelemetry
OpenTelemetry expects to focus on enhancing its capabilities across the board, particularly focusing on improving support for logs, metrics, and traces. OTel will likely emphasize better integration with various backends and increased automation capabilities. Users can expect advancements in community collaboration, a broader toolset for simplifying implementation, and OpenTelemetry’s use in complex cloud ecosystems. OTel also expects to provide enhanced observability in mobile environments and bring deeper integration with mobile platforms.
The future of Prometheus
Prometheus has prepared a roadmap that outlines developer ambitions for the platform. Plans include improving scalability and enhanced availability features, as well as smoother integration with other cloud-native systems. Prometheus will likely continue developing long-term storage solutions, strive for better support for service discovery, and seek to boost query performance. The Prometheus community is also focused on refining the user experience, including the development of more robust visualization and alerting functions.
Conclusion
Organizations with higher levels of observability have a much easier time tracking down and resolving issues, resulting in more reliable operations and fewer downtimes. Tools like OpenTelemetry and Prometheus can aid organizations in meeting observability goals in different ways. While Prometheus supports rich queries, metrics, and interoperability as part of the cloud-native ecosystem, OpenTelemetry collects metrics, traces, metadata, and logs and scales with organizational growth.
Unlock comprehensive observability for your cloud-native environments and seamlessly integrate LogicMonitor with OpenTelemetry and Prometheus. Learn more today.
As organizations continue to digitally transform and expand their networks via cloud and multi-cloud environments, it has become increasingly critical to protect microservices and data flow. Implementing advanced technology such as service mesh helps your team secure data networks and manage system access policies by matching user intentions to workload states. Service meshes like Istio support the latest software application trends like containerization and microservice infrastructures. These frameworks provide your team with a deeper and more reliable understanding of service health and behavior while automating the routing process for smooth traffic flow.
What is Istio?
Istio functions as the first open-source service mesh and features exclusive native compatibility with Kubernetes. The service mesh offers greater ease of use when applied to Kubernetes clusters. Additionally,, Istio’s open-source design allows your team to create extensions, which enable the service mesh to run on other environments. Your organization can apply Istio to effectively manage applications and infrastructures by securing, containing, and monitoring microservices within your systems.
How Istio works in microservices
The Istio service mesh features a control plane that enables you to define how your microservices communicate with each other. Istio derives its core functionality from the Envoy proxy that caters to single services and applications. The control plane coordinates the behavior of Istio proxies, which are deployed as sidecars (i.e., supporting processes) to your microservices, augmenting features like fault injection, load balancing, and TLS termination. Istio’s data plane translates, forwards, and monitors network packets throughout your data clusters. The plane applies an Envoy proxy alongside each service in a cluster for seamlessly managing and observing every inbound and outbound data request.
Istio abstracts communication logic with sidecar proxies, removing the hassle of copying entire service codes. Through Istio, your team can essentially develop business logic across microservices without tediously sorting through communication logic and security considerations. The open-sourced service mesh allows your team to extend its use across diverse data environments that include on-premise networks and Kubernetes clusters for seamless management of microservice-based apps.
Key Istio features
Istio offers a range of technical features that help you boost network management and expedite software development and delivery. These key features include:
Enhanced security
The Istio service mesh provides users with access control, authentication, and authorization policies that lay the foundation of a secure data environment for your microservice applications.
Smooth Traffic Management
Istio includes built-in traffic management mechanisms such as health checks and load balancing that run with diverse algorithms. The service mesh’s health checks consistently assess the availability of service instances before confirming a routing request. Istio provides automatic load balancing for HTTP, gRPC, WebSocket, and TCP traffic, facilitating smooth data flow through various channels.
Observability
Istio users can access detailed telemetry for assessing and reviewing service behaviors. Through Istio, your team can pinpoint system concerns such as latency issues and make the necessary service improvements, adjustments, and optimizations without delay.
Advanced Deployment
The service mesh contains advanced network controls for managing workloads like containers and virtual machines. Istio makes it convenient to connect user groups to specific applications according to their network management needs.
Dynamic Service Discovery
DevOps teams can rely on Istio’s service discovery function to monitor the number of active network nodes at any point in time. Istio’s efficient service discovery system enables your organization to allocate available nodes for smoother microservice requests.
Benefits of using Istio
By using Istio, your development teams can boost software delivery by leveraging the service mesh’s rules and policies within its control plane. Proxies within your data environments route traffic through techniques like canary deployments without causing changes to the service’s code. Through Istio, developers can conveniently manage complex applications within microservice infrastructures via systematic routing capabilities. Other popular advantages of the Istio service mesh include:
Software Resilience
The service mesh improves the resilience of your applications by implementing fault-tolerant mechanisms like circuit breakers and timeouts. These advanced features enhance the reliability and consistency of your applications, keeping them running smoothly and optimally even in the event of network issues.
User-friendly communication security
Istio features an abstracted network layer that supports service-to-service security via authentication, encryption, and authorization. The service mesh is built upon the component known as Citadel which secures communications between clients and servers by managing service certificates and encrypted keys. Istio’s Citadel structure enables you to configure and control your inter-service communications via mechanisms like failovers and routing rules.
Multi-cluster support
Your developers can use Istio for multi-cluster support in microservice functions beyond Kubernetes environments. Istio helps you scale and troubleshoot your software infrastructures with consistent policies and security. Additionally, Istio centralizes policy management at the service mesh level, preventing the overload of a single service source.
Enhanced security
Istio enforces mutual Transport Layer Security (mTLS) authentication and encryption between microservices. As such, your team can implement fine-grained role-based access control (RBAC) policies for secure communications throughout your data environments.
Industry compliance
Istio supports teams in meeting the latest industry and data security compliance, such as the General Data Protection Regulation (GDPR) and Payment Card Industry Data Security Standard PCI DSS. By using the service mesh, your organization can keep up with the latest regulations and best practices for application and network management.
Closing thoughts
Istio serves as an effective platform-independent service mesh that allows your team to optimize software development and delivery as your network scales. The advanced service mesh also empowers DevOps teams by fine-tuning developer focus with managed service-to-service communications. Ultimately, the service mesh helps boost your business decisions with enhanced software visibility, driving optimal application performance across rapidly evolving microservice infrastructures.
At LogicMonitor, ingesting and processing time series metric data is arguably the most critical portion of our AI-powered hybrid observability platform. In order to fully prepare for growth, scale, and fault-tolerance, we have evolved what we refer to as our Metrics Processing Pipeline from a monolith to a microservice-driven architecture. We previously detailed our evolutionary journey in a series of articles:
However, the further we ventured into our evolution from a monolith system into a distributed microservice and message-driven architecture, new problems arose. In this article, we will detail one such problem and how we architected the solution.
Our Kafka-based Microservices architecture and scaling challenges
Using Quarkus and Kubernetes to consume from Kafka
First, let’s consider a high-level partial architectural overview. After ingesting time series metric data, the data eventually makes its way onto a Kafka topic where it is consumed and processed by a microservice. This runs on Kubernetes and was written using the Quarkus framework. We run multiple instances of this microservice, and they join the same Kafka consumer group. The partitions of the Kafka topic are assigned to the consumers in the group, and when the service scales out, more instances are created and join the consumer group. The partition assignments will be rebalanced among the consumers, and each instance gets one or more partitions to work on.
This microservice is a highly compute-intensive application, and we leverage the Kubernetes Horizontal Pod Autoscaler (HPA) to automatically scale instances of the application based on cpu utilization metrics.
At LogicMonitor, we support multiple different datapoint metric types for the time series data we ingest. After collecting the data from the source, we need to have some additional processing of the raw data in order to produce the actual value of a datapoint as dictated by its metric type. As a requirement of this processing, we need to cache some prior existing data for each datapoint as we process incoming messages from Kafka. For more details about how we use Kafka in this way, check out this article.
Stateful Kubernetes Microservice Scaling Challenges
Now, we arrive at the crux of the problem. In order to maximize our scalability and throughput, we’ve built a multi-instance message-consuming application, which scales in and out based on computational load. Additionally, the membership of Kafka consumer group is extremely dynamic in nature, where various partitions can move over from one consumer to another in the same group.
However, as we mentioned above, each datapoint we process has some state associated with it – the cached existing data. Thus, a Kubernetes pod getting killed due to a scale-down event is not a loss-less incident. Now we lose the context associated with the data points that this pod was processing. Similarly, a Kafka partition reassignment is also not a loss-less incident. The new consumer that gets a partition either doesn’t have the context of the data points in the partition, or it has older, out-dated context.
Whenever this loss of context occurs, we experience ephemeral inconsistencies with our metrics processing. We need to address this loss of context that occurs due to a Kubernetes pod shutdown or Kafka partition reassignment.
Cost-Performance considerations for choosing a distributed cache
At first glance, it would seem like there is an obvious solution for this: replace the in-memory cache we have been using to save the context with a distributed cache of some sort. However, there are other factors which make that solution more complicated:
- Speed – Due to the sheer volume of data that LogicMonitor ingests, our metrics processing pipeline relies on speed. If we introduce a distributed cache for every single raw metrics message evaluation, we are replacing a very cheap in-memory lookup with a lookup to an external system over the network. There’s a high probability that such a lookup will negatively affect the speed of the pipeline.
- Cost – There is a high volume of processed messages , so calling to a distributed cache for each message has non-trivial cost implications. For example, the cache will require sufficient resource allocation to handle such frequent traffic, and the additional required network bandwidth will also have cost implications.
- Nature of the data being cached – In order to store context associated with the data points, we built an in-house data structure specifically for metrics processing purposes. Initial investigation into various caching systems indicated that none of them offer a direct alternative, and instead we will have to massage/modify the data in order to store them in an external cache. However, if we need to serialize/deserialize the data every time for each write/read,the overall processing speed will diminish.
Using Redis to preserve scalable microservice’s state
Balancing state storage between distributed and in-memory cache
The natural solution is a middle ground between in-memory cache and external distributed cache. We continue to store the contextual data in memory. There are two scenarios which cause the loss of this data:
- the container is shut down by Kubernetes (due to scale down event or deployment)
- partition rebalancing is triggered in the Kafka consumer group
If we can detect when these two events occur and trigger a persistence of the contextual data to an external distributed cache, we should be able to save the “state.” Subsequently, when we’re looking up contextual data, if we do not find it present in the in-memory cache, we can look it up from the external cache and if found, insert it back into the in-memory cache, thus restoring the “state.”
We can lose context without incurring too much overhead by saving the contextual data into an external distributed persistent cache during container shutdown and partition rebalancing, we avoid losing the contextual data. By only looking up the contextual data from the external cache (if it’s not found in the in-memory cache), we avoid incurring too much increased overhead.

Why we chose AWS ElastiCache Redis
We chose Cluster-mode AWS ElastiCache Redis as our distributed cache. Here are a few of the main reasons:
- We need to quickly look up contextual data for one specific datasource instance. So, a key-value based data store like Redis is ideal.
- Redis has exceptional write and access times, which meets our requirement to be able to quickly dump and read back the contextual data.
- We want the contextual data that we’re backing up to be resilient. AWS ElasticCache for Redis in cluster-mode provides the flexibility that we’re looking for by distributing the data across multiple shards and also providing replication
- As the LogicMonitor platform grows, we want to use a distributed caching that can scale horizontally. AWS ElastiCache Redis provides non-disruptive horizontal scaling for Redis clusters.
Leveraging Quarkus shutdown hooks, Kafka listeners, and Redisson
Here is how we implemented our solution:
- We used the Redisson as Redis client
- We used Quarkus framework’s shutdown hook to listen for Kubernetes container shutdown and trigger the backup of contextual data
- We used the Kafka ConsumerRebalanceListener to listen for Kafka consumer rebalance events and trigger backup of contextual data for the partitions which were revoked in the event

- We implemented our own in-house serialization and deserialization logic geared towards quickly writing cached data in-memory to Redis and quickly reading backed-up data from Redis
- In order to speed up the data backup, we parallelized the process
- When reading back persisted data from Redis, we implemented a check to ensure that we were not reading outdated information from Redis. If the data didn’t pass this check, it was discarded.
Using Compression and TTL to optimize Redis memory usage
- In order to minimize Redis cluster memory requirement and network I/O, we used the lz4 compression algorithm to compress the context data before we saved it onto Redis. On the other end, we use Redisson’s compression capabilities to simultaneously decompress the data after fetching it.
- The contextual data that we save to Redis does not need to stay on Redis for long periods of time, as the contextual data is only relevant for the next few polling intervals of the associated LogicMonitor datasources. To further optimize our Redis Cluster memory usage, we set a TTL (time-to-live) value for each contextual data we save to Redis, based on the collection interval of the associated LM datasource. This allows automatic freeing up of Redis memory once the data is no longer needed
- Once we’ve backed up contextual data to Redis, we invalidate and remove the data from the local in-memory cache. This has the following advantages:
- ensures that when contextual data is backed up to Redis, it is no longer backed up again in the future. This also ensures that only the latest contextual data is present in Redis
- ensures that the in-app cache no longer contains unnecessary and potentially contextual data
- frees up in-app memory
Summary
LogicMonitor continues to migrate our monolithic services to microservices to improve how we develop, deploy, and maintain our services. Check back for more articles about our experience during the journey.
LogicMonitor currently provides a solution for monitoring groups of nodes with the same functionality, which we call services. With companies moving towards more auto-scalable and transient architecture, LogicMonitor is able to continually monitor these services, which are always changing. We also needed a way of determining if these nodes are being used effectively. It can become an unnecessary cost if there are multiple underutilized nodes. So we decided to take a look at a statistical solution for determining how well a service’s nodes are being used. This led to looking into using outlier detection as well as research into ways of determining a service’s overall balance thus allowing LogicMonitor to provide additional metrics that can be utilized alongside anomaly detection to find discrepancies in node utilization over time.
In this article, we will cover:
- What Is an Outlier?
- What Is an Unbalanced Service?
- Why Use Unbalanced Service Detection Over Outlier Detection for Aggregated Metrics?
- How To Use Anomaly Detection for an Unbalanced Service
- How Does LogicMonitor Use Unbalanced Metrics?
What Is an Outlier?
Outliers are defined as data points that are significantly different from other points in a dataset. Usually, outliers determine some kind of anomaly or error in a group of collected data. Outliers usually cause issues with statistical analysis leading to false conclusions especially when a calculation depends on the data’s mean or standard deviation. Usually detecting an outlier is done using the Tukey’s Fences method where any values that exceed the calculated upper and lower bounds are considered outliers. Most people see these examples visualized using a box plot showing the three quartiles and the upper and lower limits.
What Is an Unbalanced Service?
An unbalanced service refers to a group of instances that on some metric are not being utilized evenly. With the increased usage of microservice architecture, there is a need to make sure that every resource is being used efficiently and effectively. Otherwise, money is being wasted and there was no need to expand horizontally in the first place. In load balancing, usually, a round-robin strategy is taken but there can be a case where a node may be getting the smaller tasks while another is receiving larger, more complex requests. This is where we would need to see unbalanced metrics so that there is insight into these issues.
Why Use Unbalanced Service Detection Over Outlier Detection for Aggregated Metrics?
Using outlier detection to find irregular nodes while relying on aggregated metric collection can show promise depending on the user’s needs. In metrics, such as request count and HTTPS calls, there are opportunities to see larger differences in data points that in cases where other nodes are not being used or some are being overused, we would see these differences as outliers. As for other cases (CPU, memory, other percentile measurements), it is very difficult to calculate an outlier due to the set bounds for percentages (0-100). This is where an unbalance detection algorithm would be much more effective.
An Example of How Outlier Detection Does Not Work
If you have ten services with nine having 10% CPU utilization and one having 90%, here we have an outlier but let us say if we have five nodes with 90% and the five have 10%. In this case, the nodes certainly are not being used efficiently all around but if we relied on outlier detection there wouldn’t be any indication of an issue. Another difficulty with using outlier detection is that it requires both a larger dataset and must contain some extreme value(s) while statistically determining an unbalance can be used on any amount of nodes and the smallest differences are found.
How To Use Anomaly Detection for an Unbalanced Service

Figure 1: Adding the unbalanced aggregation to your service.

Figure 2: Reviewing the data points for the new unbalanced aggregation function.

Figure 3: Showing related data points for each instance within the service.

Figure 4: Here we set up dynamic alerting which is determined based on anomaly detection.

Figure 5: Setting up static alerting for when users know how unbalanced their service can get before needing to be notified.
How Does LogicMonitor Use Unbalanced Metrics?
At LogicMonitor, we use our own product to monitor our services. This allows us to take full advantage of the unbalanced metric to determine how well our services are being utilized and be able to take necessary actions to have better performance.
How New Version Deployment Impacted Our Own Service?
An example of a service that we are currently monitoring is the Collector Adapter that has multiple services across pods that in cases where there are large customers, we have noticed nodes not being used equally. This has been determined to be caused by our load management system that separates requests based on the customer so for larger customers, the request rate is much larger than smaller ones even though they all exist in the same pod.

Figure 6: Unbalanced metric being used to find inefficiencies in the Collector Adapter services’ rate requests.
Having this metric available allows us to find these issues earlier and makes it easier to pinpoint the services and nodes that need to be reviewed. We are able to take more in-depth views into other utilization metrics such as CPU and then we can spend the time researching solutions rather than trying to find the initial issue. In the case where we had recently deployed a new version of the Collector Adapter, we saw a huge change in CPU utilization which was also followed by the larger unbalanced index shown in Figure 6. This led us to determine that there was something to look into and we were able to find more information using the other aggregated metrics gathered and anomaly detection.

Figure 7: Service with Unbalanced index of 45% having CPU aggregation metrics with large differences between the max, min, and mean due to deployment.

Figure 8: Anomaly detection analysis showing a large drop in CPU utilization and a note stating the cause being a recent deployment.
Conclusion
After reviewing both options as possible solutions, we determined that our use case would be better handled using an unbalanced service detection algorithm rather than relying on finding outliers. It provided more usability for smaller services while still providing support for larger ones all without relying on extreme value scenarios.
Originally Published July 16, 2021. Updated December 2022.
At LogicMonitor, we deal primarily with large quantities of time series data. Our backend infrastructure processes billions of metrics, events, and configurations daily.
In previous blogs, we discussed our transition from monolith to microservice. We also explained why we chose Quarkus as our microservices framework for our Java-based microservices.
In this blog we will cover:
- The LogicMonitor Microservice Technology Stack
- How We Used A Kafka Partition Layout in a Multi-Tenant Environment
- How We Used Quarkus With Kafka
- How We Scale in and Out of Microservice Containers
- The Top 5 KPIs
LogicMonitor Microservice Technology Stack
LogicMonitor’s Metric Pipeline, where we built out multiple microservices with Quarkus in our environment, is deployed on the following technology stack:
- Java 11 (corretto, cuz licenses)
- Kafka (managed in AWS MSK)
- Kubernetes
- Nginx (ingress controller within Kubernetes)

How We Used A Kafka Partition Layout in a Multi-Tenant Environment
Our microservices use Kafka topics to communicate. Each microservice gets data messages from some Kafka topics and publishes the processing results to other topics.
Each Kafka topic is divided into partitions. The data messages of multiple tenants that are sharing the same Kafka cluster are sent to the same topics.
When a microservice publishes a data message to a partition of a Kafka topic, the partition can be decided randomly or based on a partitioning algorithm based on the message’s key. We chose to use some internal ID as the message key so that the time-series data messages from the same device can arrive at the same partition in order and be processed in that order.

The data on a topic across the multiple partitions sometimes can be out of balance. In our case, some data messages require more processing time than others and some partitions have more messages than the other partitions. This leads to some microservice instances falling behind. To solve this problem, we separated the data messages to different topics based on their complexity and configured the consumer groups differently. This allows us to scale in and out services more efficiently.
The microservice that consumes the data from the topic has multiple instances running and they are joining the same consumer group. The partitions are assigned to the consumers in the group and when the service scales out, more instances are created and join the consumer group. The partition assignments will be rebalanced among the consumers and each instance gets one or more partitions to work on.
In this case, the total number of partitions decides the maximum number of instances that the microservice can scale up to. When configuring the partitions of a topic, we should consider how many instances of the microservice that will be needed to process the volume of the data.
How We Used Quarkus With Kafka
We started with Quarkus’s Kafka extension based on MicroProfile Reactive Messaging: smallrye-reactive-messaging-kafka. It’s easy to use and has great support for health checks.
We set up the Kafka producer with imperative usage. There are a couple of configurations that need to be adjusted to make sure the throughput of the producer is good, which we mentioned in our Quarkus vs Spring blog.
- Overflow Strategy: By default, the producer’s overflow strategy is that of a small memory buffer. The Kafka Emitter will wait for a signal from the Kafka consumer (reactive messaging) to know that a given message will be processed correctly. This is bad news though, if your Kafka consumer is in a different application and unable to send any signal to the Emitter. So, we set this strategy to NONE. The risk here is that we don’t have anything within the application to know if the Kafka consumer is keeping up or not. We solved this by using the Kafka client JMX metrics directly in our monitoring solution.

- WaitForWriteCompletion: By default, the producer was waiting for an ack from Kafka that the message was accepted correctly and fully even if acks was set to 0. By default, this config value is true, so we had to set it to false in order to keep up with the volume of data we were processing.
However, we did have some challenges while setting up the Kafka consumers. These are also mentioned in the Quarkus vs. Spring blog.
- Auto Commit: by default, the Quarkus consumer was committing to Kafka after every message was received, causing a big pile-up in consumer lag.
- Single-Threaded Consumer: this caused us to actually avoid using the Quarkus Kafka consumer for metrics processing. After a lot of troubleshooting hours and headaches, our team found that not only was it single-threaded, it was processing messages serially. It just couldn’t keep up with our volume, so we ended up building a Kafka consumer based on the Apache Kafka Java SDK directly so that we could have multiple consumer threads per application container. We did, however, keep the Quarkus Kafka consumer for another use case that had a much lower volume of messages, simply because of the ease of use to configure it:

- Other “gotchas” with the Quarkus Kafka Consumer include:
- You have to be very careful to return a completedFuture, otherwise, we found that the reactive framework took way too long to process each message, sometimes hanging indefinitely.
- Exceptions thrown in the @Incoming method aren’t handled gracefully either (the consumer will stop), so be sure to be careful here too.
- The Reactive Messaging Framework’s channel implementation doesn’t allow consumption of topics based on a pattern (i.e. only a single topic can be consumed from per channel)
In the end, we chose to implement Kafka consumers with Apache Kafka Client. There have been multiple improvements added in Kafka support of MicroProfile Reactive Messaging, for example, allowing multiple consumer clients and supporting subscribing to topics by patterns. In the future, we may reevaluate the Kafka extension in Quarkus for the consumer implementation.
How We Scale in and Out of Microservice Containers
All of our microservices are deployed in Docker containers on Kubernetes clusters. In a Kubernetes cluster, multiple namespaces are used to divide the resources between the multiple tenants. Most of our microservices are deployed at the namespace level.
At the cluster level, the Kubernetes cluster can scale up and down by the Cluster Autoscaler. For each microservice in a namespace, we use the Horizontal Pod Autoscaler to automatically scale the number of container replicas based on the application CPU utilization. The number of replications of a microservice in a namespace is dependent on the load from the tenants belonging to that namespace. When the load goes up and CPU utilization of a microservice increases, more replicas of the service will be created automatically. Once the load goes down and the CPU utilization decreases, the number of replicas will scale down accordingly. Our next goal is to use the horizontal pod autoscaler with the custom metrics from the application.

All of our microservices are monitored with LogicMonitor. Here is an example from the monitor dashboard. It shows the number of container replicas was automatically scaled up and down because of CPU utilization changes.
The Top 5 KPIs
We use LogicMonitor for the microservice KPI monitoring. The KPI metrics include but are not limited to:
- Kafka consumer lag – The lag there is between Kafka producers and consumers
- Request rate or consume rate – The number of network requests per second
- Latency – Time it takes for a record produced to Kafka to be fetched by the consumer
- Error rate – The average per-second number of record sends that resulted in errors for a topic
- Resource usage (CPU, Memory)
Here is an example of our Anomaly Detection microservice dashboard:

Today, monolithic applications evolve to be too large to deal with as all the functionalities are placed in a single unit. Many enterprises are tasked with breaking them down into microservices architecture.
At LogicMonitor we have a few legacy monolithic services. As business rapidly grew we had to scale up these services, as scaleout was not an option.
Eventually, our biggest pain points became:
- The cost of scaling up a service was high.
- New features required ML/AI algorithms that were not optimized in Java.
- For any new feature, the overhead of QA, deployment, and maintenance was huge.
- Onboarding a new engineer was long and painful.
In this article, we will cover the benefits of both Monolith and Microservices, our specific requirements from Microservice, Kafka Microservice communication, and how to distribute data and balance the load.
Monolith vs. Microservices
A monolith application is an application with all the functionalities built in a single unit. Microservice applications are the smaller services that break down the single unit. They run independently and work together. Below are some benefits of both Monolith and Microservices.

Monolith:
As long as the application complexity is not high and fairly static and the number of engineers is “small”, then it is:
- Easier to Debug and Test – You can run end-to-end testing much faster.
- Simpler to Deploy – There’s only one deployment.
- Simpler to Develop – All of the knowledge usually exists in a few key engineers.
- Easier to Manage – Logging and performance monitoring are easy to set.
Microservices:
Microservices provide many advantages in building scalable applications and solving complex business problems:
- Simple – Each microservice has a very specific job and is not concerned with the jobs of other components.
- Performance Optimized – You can isolate hot services and scale them (in/out or up/down) independently of the rest of the applications.
- Simple to QA and Test – Each service can be self-testable with well-defined input and output.
- Decoupled – Decoupled services are also easier to recompose and reconfigure to serve the purposes of different apps (for example, web clients and public API).
- Different Development Stacks – Each service can be implemented with the most suitable development stacks for itself (for example, we are using Python Java and Go).
- Better Resilience and Fault Tolerance – Isolated modules will prevent a bug in one module from bringing down the entire service.
- Easy to Deploy – The development and deployment time of a microservice is much shorter.
Microservice Requirements
LogicMonitor processes billions of payloads (e.g data points, logs, events, configs) per day. The high-level architecture is a data processing pipeline.
Our requirements for each microservice in the pipeline are:
- Each microservice component should be stateless (if needed, the state is kept in datastore, e.g. Redis, Kafka)
- Each microservice component should complete its task in X ms
- Each microservice is k8s container-based that can dynamically scale out/in
- End to End pipeline should be less than X ms
- Microservice warm-up time should be less than X ms
- Each Microservice is limited by X CPU cores and Y GB Memory
- Cost (infrastructure/tools) should be less than $X per year per payload
- Each microservice should generate useful logs and metrics for monitoring
Today we have microservices implemented in Java, Python, and Go. Each microservice is deployed to Kubernetes clusters and can be automatically scaled out or in using Kubernetes’ Horizontal Pod Autoscaler based on a metric.
For Java, after evaluating multiple microservice frameworks, we decided to use Quarkus in our new Java microservices. Quarkus is a Kubernetes-native Java framework tailored for Java virtual machines (JVMs).
To learn more about why we chose Quarkus, check out our Quarkus vs. Spring blog.
How to Distribute Data and Balance the Load
We have implemented microservices to process and analyze the data points that are monitored by LogicMonitor. Each microservice performs a certain task on the incoming data.
After evaluating a few technologies, we decided to use Kafka as the communication mechanism between the microservices. Kafka is a distributed streaming message platform that can be used to publish and subscribe to streaming messages. Kafka provides a fast, scalable, and durable message platform for our large amount of streaming data.
How to Partition Kafka Topics

Our microservices use Kafka topics to communicate. Each microservice gets data messages from some Kafka topics and publishes the processing results to some other topics.
Each Kafka topic is divided into partitions. The microservice that consumes the data from the topic has multiple instances running and they are joining the same consumer group. The partitions are assigned to the consumers in the group. When the service scales out, more instances are created and join the consumer group. The partition assignments will be rebalanced among the consumers. Each instance gets one or more partitions to work on.
In this case, the total number of partitions decides the maximum number of instances that the microservice can scale up to. When configuring the partitions of a topic, we should consider how many instances of the microservice that will be needed to process the volume of the data.
Distribute and Balance the Data
When a microservice publishes a data message to a partition of a Kafka topic, the partition can be decided randomly or based on a partitioning algorithm based on the message’s key.
We chose to use some internal ID as the message key so that the time-series data messages from the same device can arrive at the same partition in order and processed in the order.
The data on a topic across the multiple partitions sometimes can be out of balance. In our case, some data messages require more processing time than others and some partitions have more such messages than the other partitions. This leads to some microservice instances falling behind. To solve this problem, we separated the data messages to different topics based on their complexity and configure the consumer groups differently. This allows us to scale in and out services more efficiently.
Where to Keep the Microservice State
Some of our microservices are stateful, which makes it challenging to scale. To solve this problem, we use Redis Cluster to keep the states.
Redis Cluster is a distributed implementation of multiple Redis nodes which provides a fast in-memory data store. It allows us to store and load the algorithm models fast and can scale-out if needed.
Summary
Migrating Monolith to microservices is a journey that in some cases can take a few years.
At LogicMonitor we started this journey two years ago. The return on the investment is not arguable. The benefits include but are not limited to:
- The productivity of the development is increased and the technical debt is reduced.
- The services are more resilient and perform better.
- The continuous deployment is easier and there is no downtime of the services.
- It’s easier and more efficient to scale the services.