Learn how to monitor Kubernetes effectively with this comprehensive guide that covers essential metrics across cluster, pod, and application levels, helping CloudOps teams prevent outages and optimize performance in complex containerized environments.
Your Kubernetes environment feels perpetually sluggish. Applications that once met performance benchmarks and service-level agreements are now struggling to keep up and operating costs continue to rise. With no clear indicators, you’re left sifting through application logs and dependencies for a root cause.
For modern CloudOps teams, this scenario is all too familiar and it’s happening with increasing frequency as containerized applications become more complex. At the heart of this challenge lies the very nature of Kubernetes itself: an inherently dynamic system where resources like pods, nodes, and containers are constantly being created, scaled, and destroyed. In this environment, even a single pod failure can cascade into application-wide outages.
Robust monitoring isn’t just helpful—it’s critical for maintaining visibility across the Kubernetes ecosystem. Proactive management of these dynamic resources ensures smooth operations and prevents issues before they disrupt your users.
In this guide, you’ll learn about Kubernetes monitoring by exploring its role in maintaining the health and performance of your hybrid cloud applications.
Understanding Kubernetes monitoring
Kubernetes monitoring involves tracking and analyzing the applications and infrastructure running within your Kubernetes cluster. It uses logs, metrics, and events to monitor health and performance, helping you identify potential issues, optimize workloads, and maintain high availability. In addition, Kubernetes deployments are often spread across development teams where limited visibility can lead to forms of cloud sprawl and infrastructure inefficiencies.
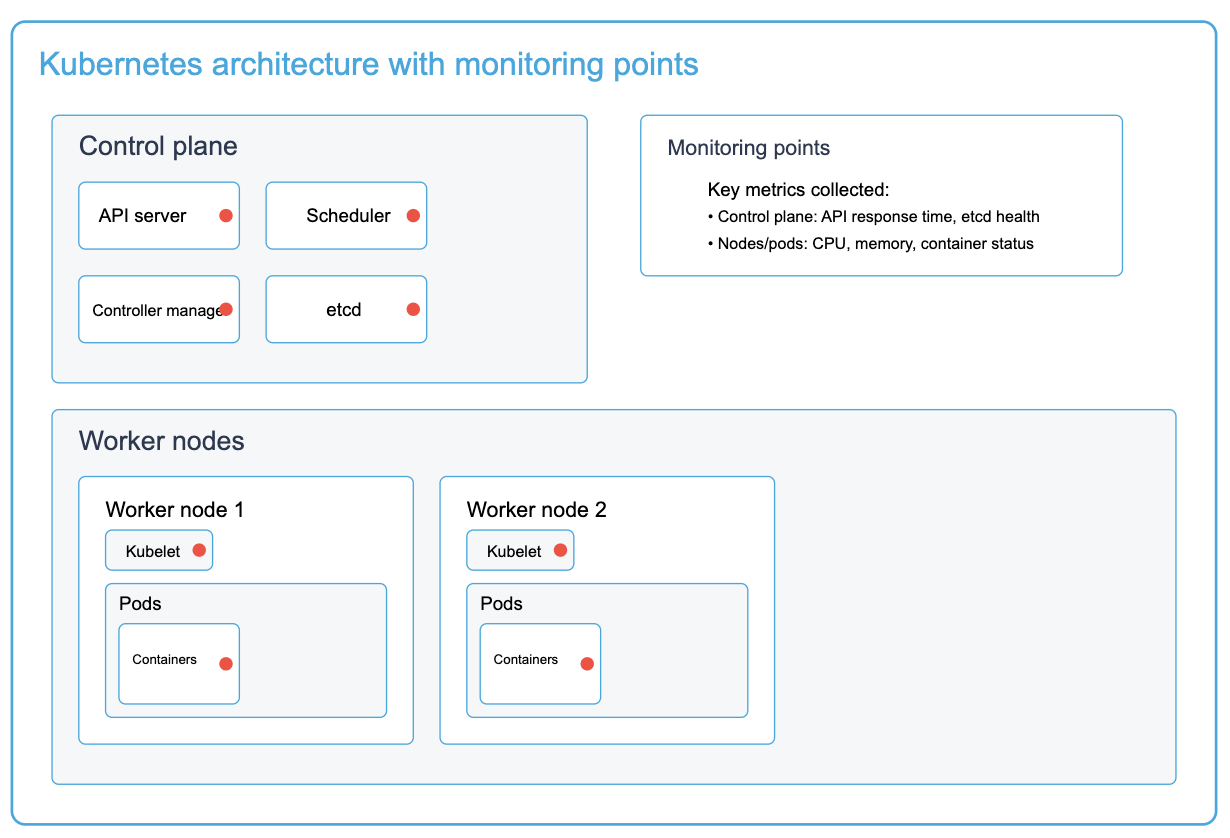
A comprehensive view of a Kubernetes cluster architecture showing key monitoring points across the control plane and worker nodes. Red indicators represent critical monitoring points where metrics are collected for observability
Strategies for monitoring Kubernetes deployments
Within your Kubernetes infrastructure, you have a master node with Kubernetes-specific components, like the scheduler and API server, as well as the worker nodes with their respective pods, containers, and containerized applications. To get a clear picture of your Kubernetes cluster and how it affects business services, tracking the health and performance of its components at every level is critical, including monitoring the Kubernetes cluster, individual pods, and application-specific metrics.
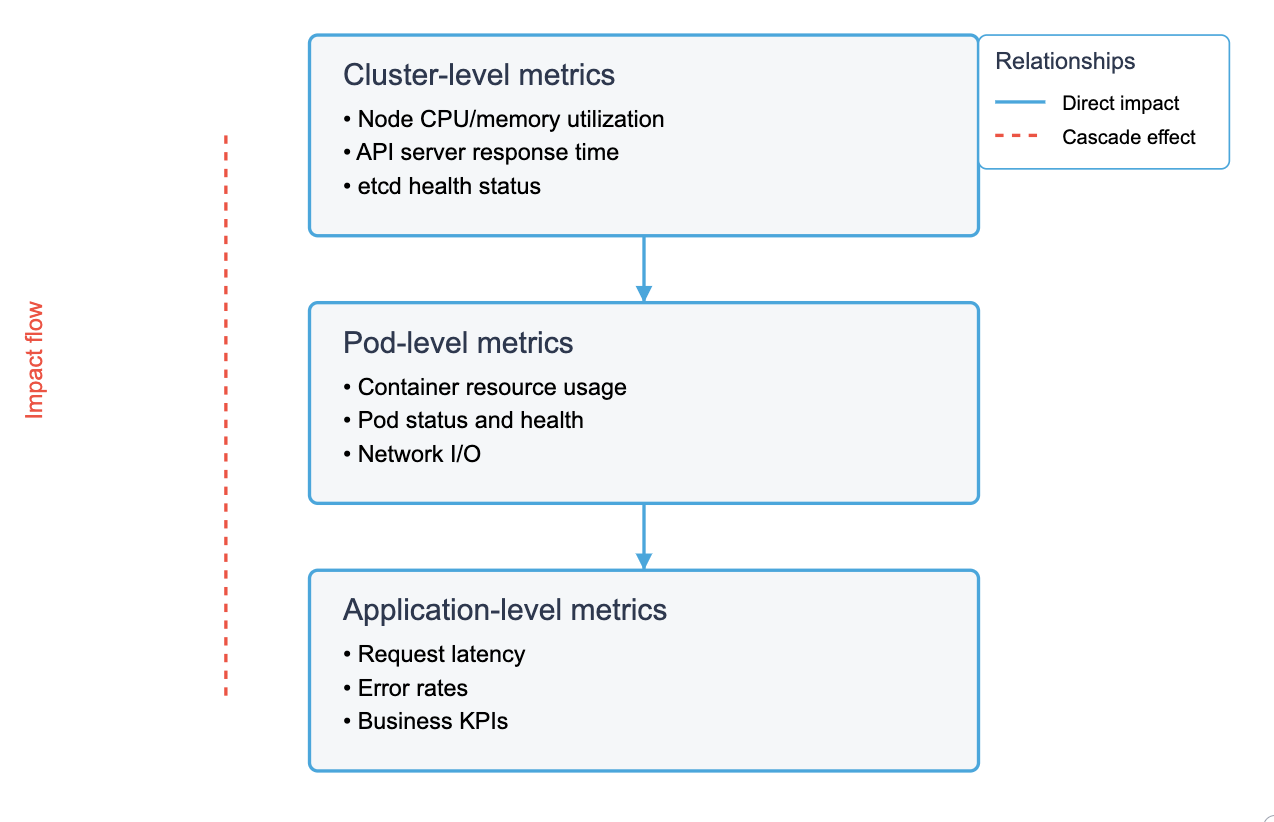
Hierarchical view of Kubernetes metrics showing the relationships between infrastructure, workload, and application monitoring. The cascade effect (red dashed line) demonstrates how issues at any level can impact overall system health and performance.
Let’s explore each layer of your Kubernetes infrastructure to understand what metrics matter and why.
Monitoring the Kubernetes cluster
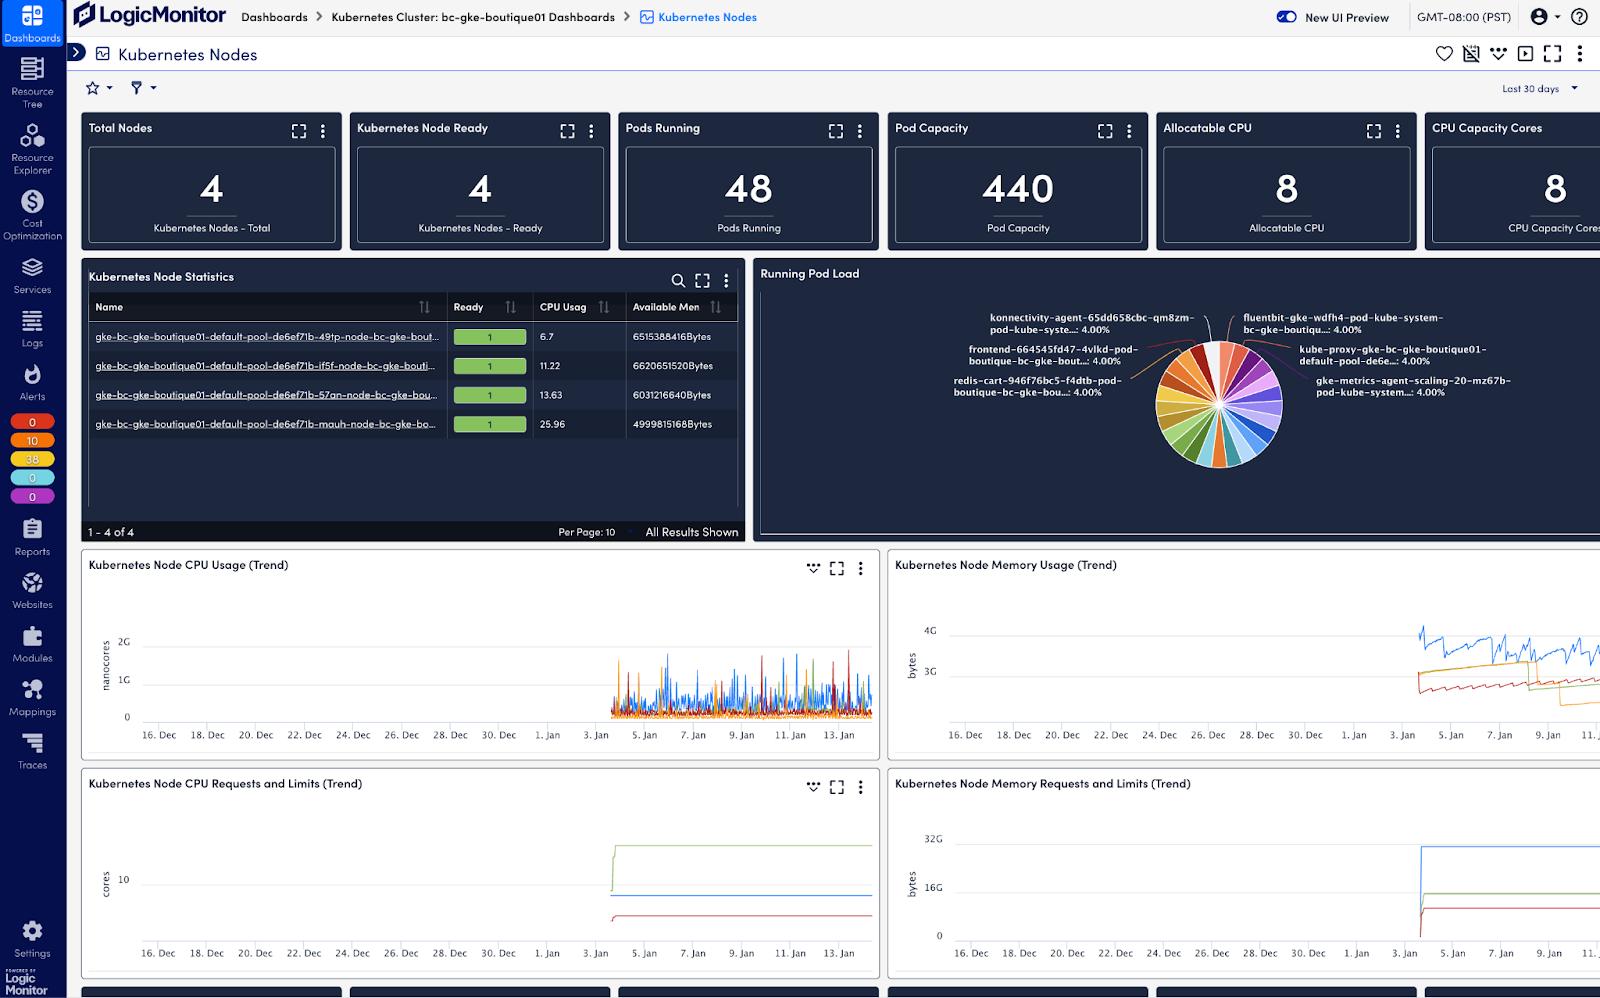
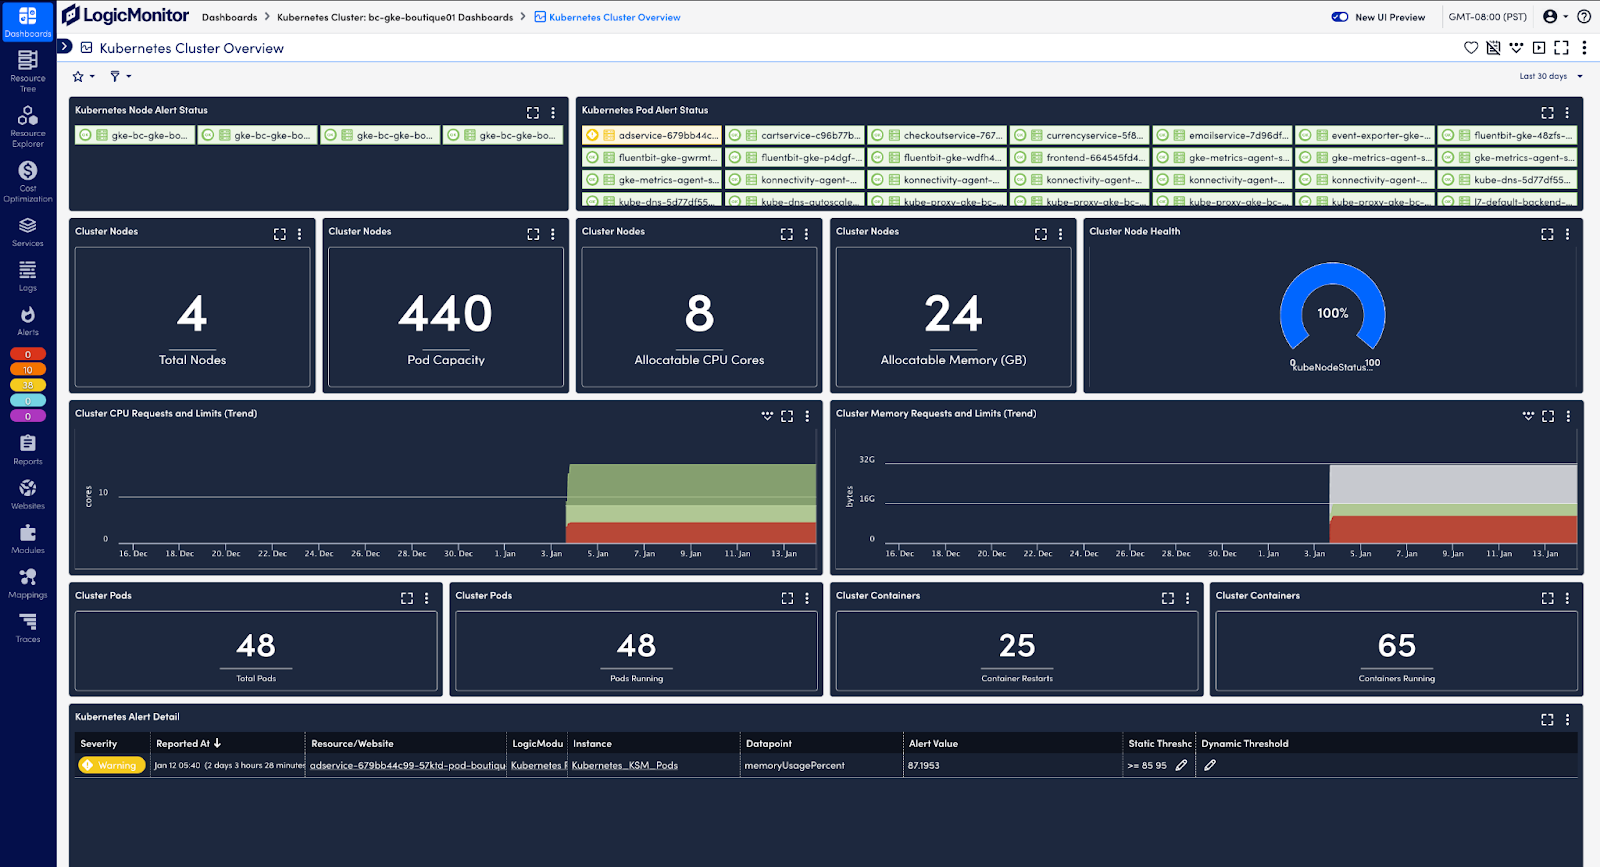
Gaining observability of your overall cluster is necessary to understand your Kubernetes environment effectively. This means: collecting resource metrics on what is being used within your cluster; identifying which elements, like pods, are currently running; and assessing the current status of components (e.g., API server, scheduler) within your Kubernetes environment. Kubernetes automatically collects these data points and exposes them through its API.
To collect and analyze metrics and resource data from the Kubernetes API, the Cloud Native Computing Foundation (CNCF) recommends solutions like LogicMonitor Envision. LM Envision integrates as a pod in your cluster, listening to the Kubernetes event stream without requiring additional monitoring agents. It automatically discovers new resources, aggregates operational data, and surfaces actionable insights through comprehensive dashboards. This enables effective monitoring of resource utilization metrics, providing the visibility needed to analyze nodes, pods, and applications and optimize cluster performance:
Resource utilization within the cluster
CPU, memory, network, and disk utilization metrics are key to monitoring the health of your Kubernetes cluster. They help you identify if resources are being used efficiently and detect potential bottlenecks or performance issues that could impact your workload. These metrics can be automatically discovered and tracked through regular queries to the Kubernetes API, ensuring your monitoring adapts to changes in the Kubernetes environment.
Pro tip: Monitor both real-time usage and trends over time to identify potential capacity issues before they impact performance.
For example, you should monitor the number of nodes and the status of pods to maintain visibility into your cluster’s infrastructure. Downed nodes may indicate capacity issues, while pod failures and restarts could suggest issues with your application or resource constraints:
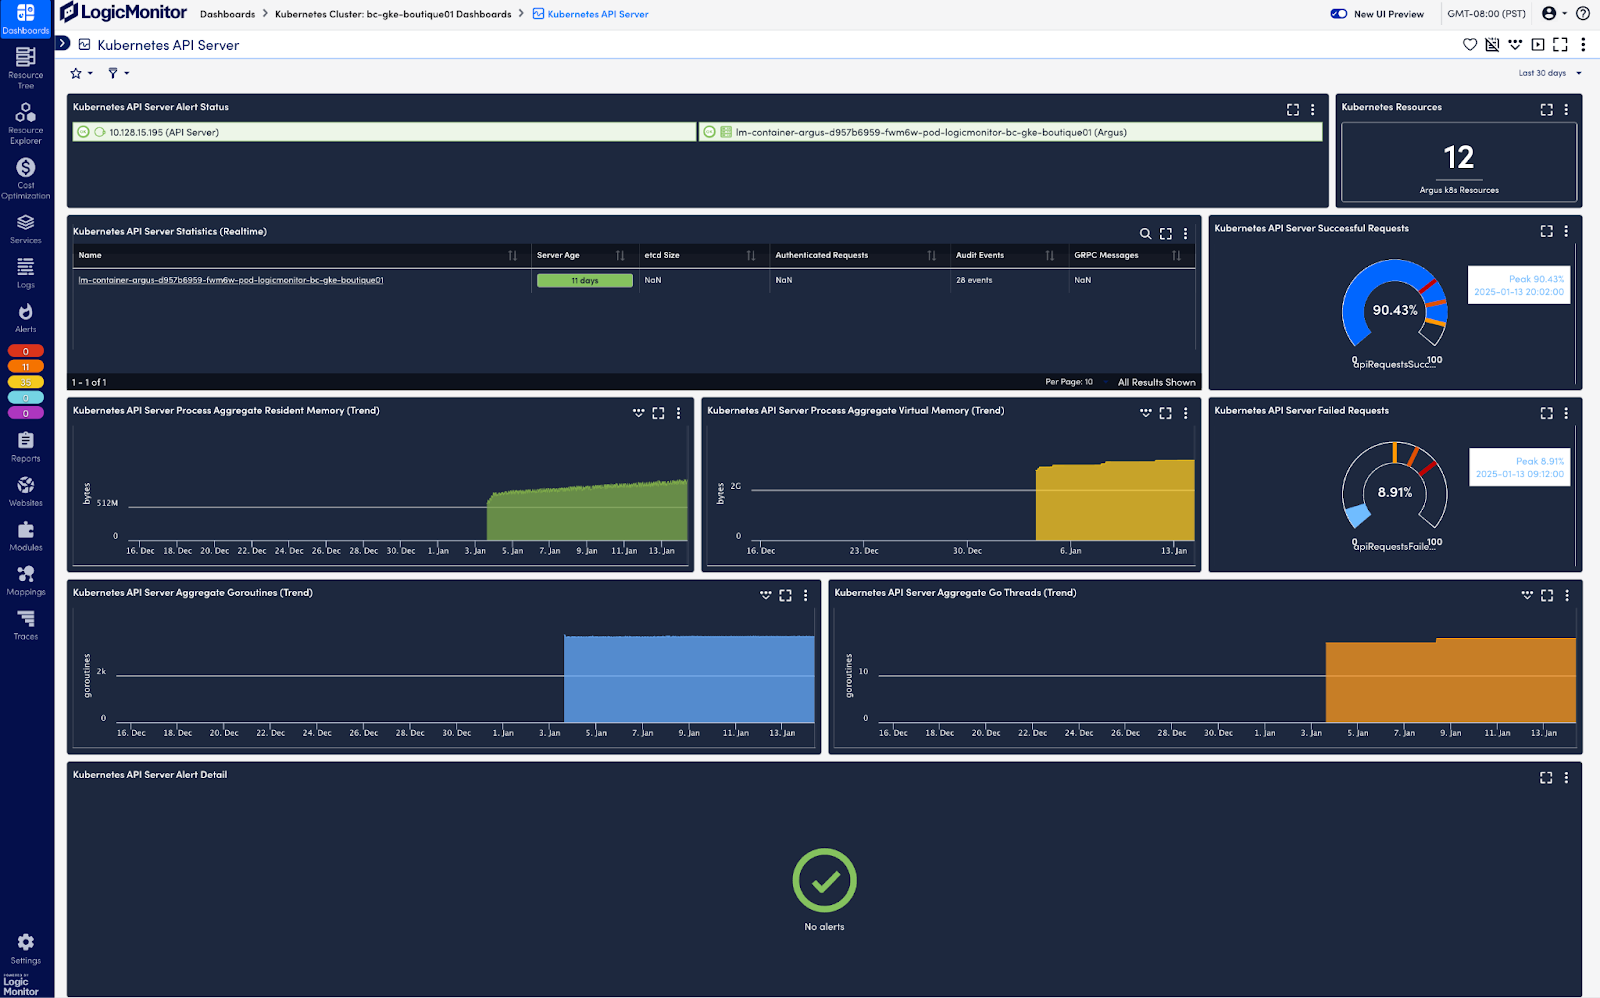
Tracking availability
Kubernetes components, such as the API server, form the core for all communication with the cluster and your Kubernetes operations. Monitoring the health and availability of your cluster’s API server can help with debugging and ensuring smooth executions within your cluster:
Paying attention to your Kubernetes network is important for tracking availability within your cluster. Set up alerts on network policy conflicts and service health checks to ensure network connectivity doesn’t affect service deployments, discovery, and pod operations.
Cluster-level metrics
The following are some critical data points to look for within your cluster. These metrics can help you proactively prevent large-scale Kubernetes outages:
Node CPU utilization: High CPU usage can lead to throttling and degraded performance across all pods on the node. Set up specific alerting thresholds for your CPU utilization, such as a warning threshold at 70 percent and a critical threshold at 85 percent. This helps you effectively intervene before CPU constraints cause widespread problems.
Node memory utilization: Low memory causes pod evictions and OOM kills. Configure alerts at 80 percent (warning) and 90 percent (critical) of total node memory to prevent these issues.
Pod scheduling failures and pending pods: are indicators of cluster capacity issues. They can be caused by resource constraints or configuration issues. Monitor for spikes in failures and pending pods, such as three pods within a five-minute window or five pods for more than ten minutes.
Node allocatable resources vs. requests/limits ratio: This ratio helps you maximize capacity and avoid resource depletion. It can also be used to forecast scalability needs and handle usage spikes. Try to maintain a buffer with about 20 percent of allocatable resources. Set up alerts when capacity falls below this value.
Kubelet response latency: Slow kubelet responses indicate node health issues. Delays above 800ms suggest that the node is struggling to manage its pods, which can affect pod lifecycle operations and health checks.
etcd health status and leader election rate: Issues with your etcd can disrupt the entire cluster. Leader election issues generally imply etcd network or consensus issues. Monitor the occurrence of leader elections, with two or more in 15 minutes or less being a warning sign.
API server latency: Latency over 200ms affects deployments, scaling, and kubectl commands. It can also hinder control plane operations and responsiveness.
Node not ready events: These events can indicate kubelet issues, network problems, or hardware failures affecting pod scheduling. Monitor their duration closely, as recurring events multiple nodes may point to cluster-wide problems.
Persistent volume claim failures: These failures affect stateful applications and data persistence. They may also block pod scheduling and application deployment. Set up capacity alerts on your storage classes to ensure adequate buffer for your operations.
Pro tip: Set appropriate thresholds and alerts for these metrics to prevent cluster-wise issues.
With your general cluster monitoring setup, you’ve addressed visibility gaps for cluster-wide and infrastructure-related issues. The next step is examining the more granular level of individual pods and their specific monitoring requirements.
Monitoring individual pods
While cluster-level monitoring provides the big picture, pod-level observability helps you catch issues before they impact your applications.
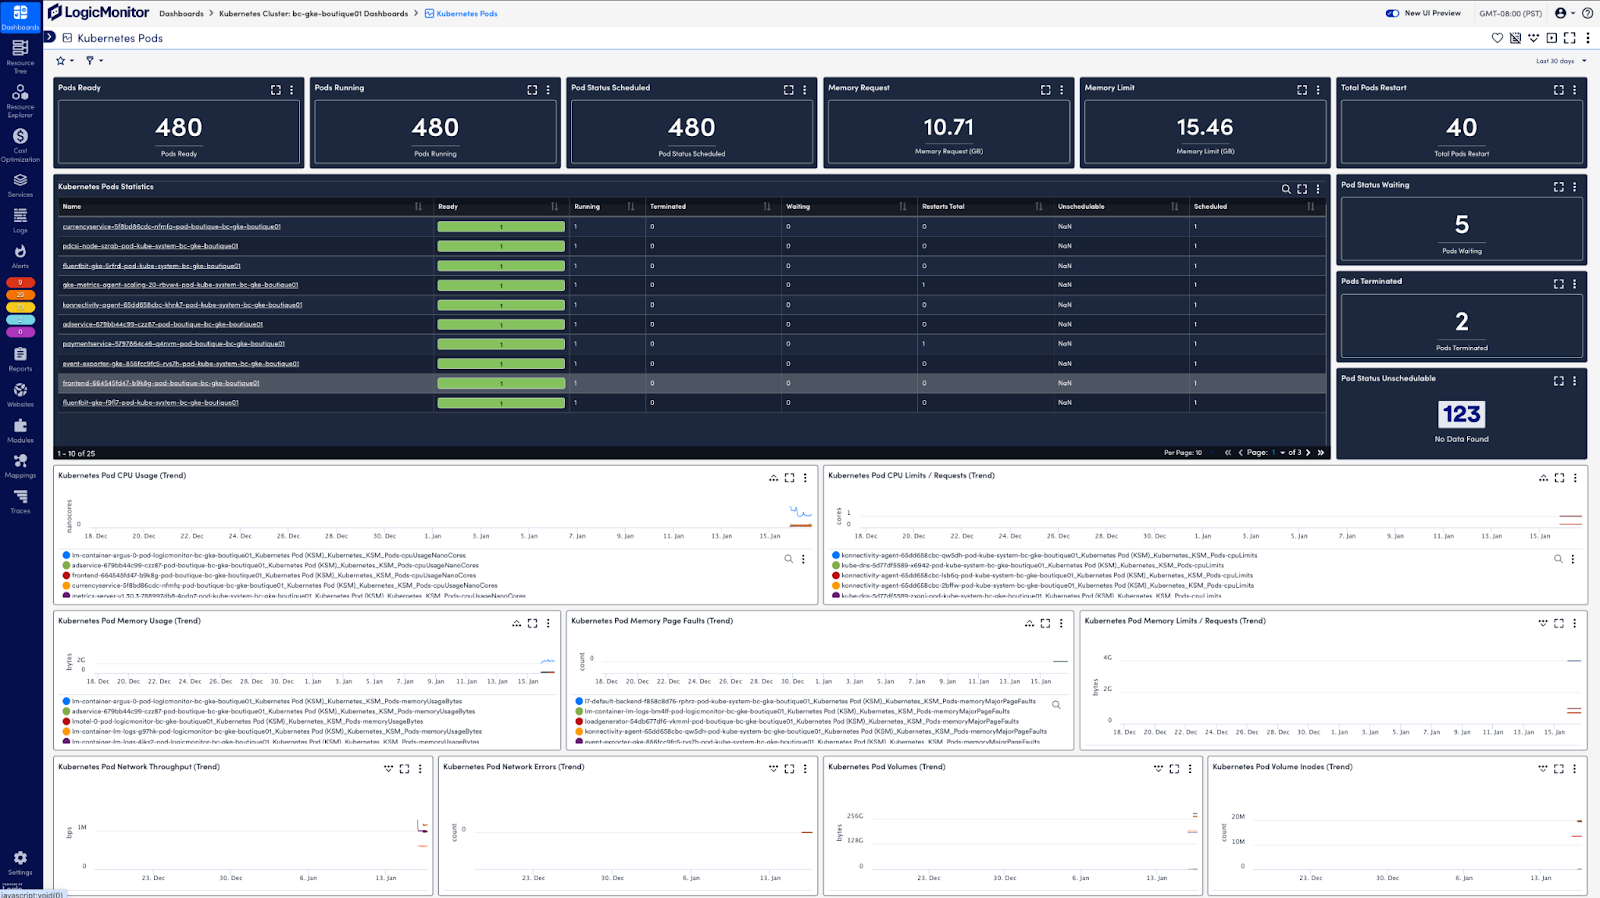
Within your individual pods, you need to know how the pod itself is functioning and the execution of operations within the pod. You can start by tracking resource utilization. For example, CPU utilization (both requests and limits), memory consumption, storage metrics (if persistent volumes are in use), and network throughput (ingress and egress traffic) are important factors to track. The pod’s current status (e.g., running, pending, unknown, succeeded, or failed) and restart counts are also good indicators of pod readiness. This information can be retrieved through queries to the Kubernetes API and can be collected and displayed automatically with tools like LogicMonitor:
Pod logs
Logs also provide insights into operations within your pod and their containers. You can analyze timestamps between operations to observe response time and optimize efficiency. Warning and error messages reveal failures and bottlenecks, offering critical information for troubleshooting. Kubernetes inherently provides logs, which can be forwarded to your monitoring solution through the API.
With LM Envision, you can ingest Kubernetes logs and events, such as pod creation and removal. You can also set up alerts on your resource metrics and logged events, helping you respond quickly to failed operations or unplanned spikes.
Pro tip: Use log aggregation to correlate events across multiple pods and identify patterns.
Tracking configuration changes
Configuration changes in your Kubernetes environment can lead to broad transformations across pods and services. This can be a source of problems in your deployed applications. Updates to deployment manifests, resource quotas, or network policies can destabilize previously running workloads. Solutions like LM Envision offer configuration monitoring, giving you a detailed log of modifications to deployment and network configurations. This enables you to directly correlate changes to performance metrics and set up alerts and triggers on these monitored datapoints. Monitoring and storing your configuration changes also gives you a detailed audit trail for troubleshooting and debugging.
Resource grouping
You can also group and aggregate Kubernetes resources and components to better correlate observed behavior across your pods, applications, and the general cluster. This is usually done using key-value labels attached to your Kubernetes resources or using Kubernetes namespaces to delineate resources. With this setup, you can navigate between high-level metrics and granular events, moving from an overview of cluster and pod performance to detailed information on operations within individual components.
Pod-level metrics
Let’s look at some specific pod-level metrics that are critical to the health of your infrastructure and can help you debug and predict issues:
Container restart count: The kubelet restarts containers to handle faults and failures in the container. Frequent restarts indicate application instability or resource constraint issues. For example, more than three restarts in 15 minutes is a warning sign.
Pod scheduling latency: refers to the speed at which new pods are placed—long scheduling times affect your deployment speed and scaling efficiency. If new pods take more than ten seconds to be scheduled, you might have issues with your pods.
Pending pod count: A pod is considered pending when it can’t be scheduled onto a node. Explore your resources, node taints, affinity rules, and PVC bindings if this count exceeds observed benchmarks.
Pod startup time: Prolonged startup times during updates or failures can disrupt application availability. A pod taking more than 30 seconds to start can indicate resource or application failures.
OOMKilled events: These events point to memory limit issues or memory leaks within your applications. Set up alerts for their occurrence, with spikes of more than two within 30 minutes being critical.
Container throttling metrics: Examples include the number of times the container has been throttled and how long it has been throttled. Monitor these metrics to optimize your resource allocation and operations.
Pod network I/O errors: Errors in network I/O directly affects services and operations within your pod.
Volume I/O latency: Important for database applications and transaction-intensive workloads. It helps with storage inefficiencies and bottlenecks. Delays above 100ms could lead to further clogs in your workflow.
Init container failures: Crucial for application and pod startup. It can indicate issues within your application logic.
Probe failures: Liveness and readiness probes are important indicators for application health and service availability.
ImagePullBackOff errors: Indicate faulty container images and affect pod deployments and updates.
Understanding cluster and pod health is crucial, but ultimately, application performance is what matters to your end users.
Application logging and tracing
To effectively monitor your application, start by collecting and querying your application logs for error messages, debugging information, and request details. Consistent log metadata is essential for enabling distributed tracing. The distributed tracing capability of LM Envision uses OpenTelemetry collectors to track and forward trace data for analysis. Your application and services may span multiple pods and nodes, with requests passing through various applications. Distributed tracing provides the visibility you need to track these requests and gain insights into service interactions and bottlenecks.
Pro tip: Use distributed tracing to track requests across microservices and identify bottlenecks.
Integrating tools like Prometheus and OpenTelemetry enables more granular metrics and tracing within your application. These tools give you the control and flexibility you need to monitor specific areas and behavior within your application. With their support for interoperability and the OpenMetrics standard, you can easily expose custom data and integrate it into LM Envision for streamlined analysis.
Tailored monitoring
Different applications require different monitoring approaches and performance indicators. For a web application, focus on availability, content delivery metrics, and user behavior. For data-heavy or database applications, prioritize query performance, processing power, and storage capacity.
Using tools like LM Envision integrates both application and Kubernetes infrastructure metrics into one platform. For example, application metrics collected from Prometheus can be displayed alongside Kubernetes-specific infrastructure metrics correlating application performance with underlying infrastructure health. This provides unified dashboards for quick visibility, helping you pinpoint bottlenecks and fix infrastructure and application issues.
Application-level metrics
Lastly, let’s look at some key application-level data points for debugging and proactive optimization.
Request latency percentiles: Showcase the maximum response times influencing application performance, speed, and user experience. For example, a p95 of 150ms means 95 percent of the requests made by your users were completed within 150ms or less.
Error budget consumption rate: If your SLOs have explicit margins for errors, it’s important to track this and ensure you’re meeting service reliability targets. Try to monitor for repeated errors within a short period of time to debug issues quickly.
Service level indicator (SLI) metrics: are contractual markers for your service to your customers. They commonly include golden signals, such as latency, traffic, and errors. You can set up alert thresholds based on your service agreements (e.g., warnings on sudden drops in traffic (>20 percent) and more than 80 percent of resource utilization).
Wrapping up
When managing Kubernetes clusters in production, especially in hybrid cloud environments, your monitoring suite can make or break you. Operations span multiple environments and services, and failures in one component can trigger widespread issues. As you scale, having clear visibility and the ability to trace and resolve problems is crucial.