Monitor your HPE servers within a single system

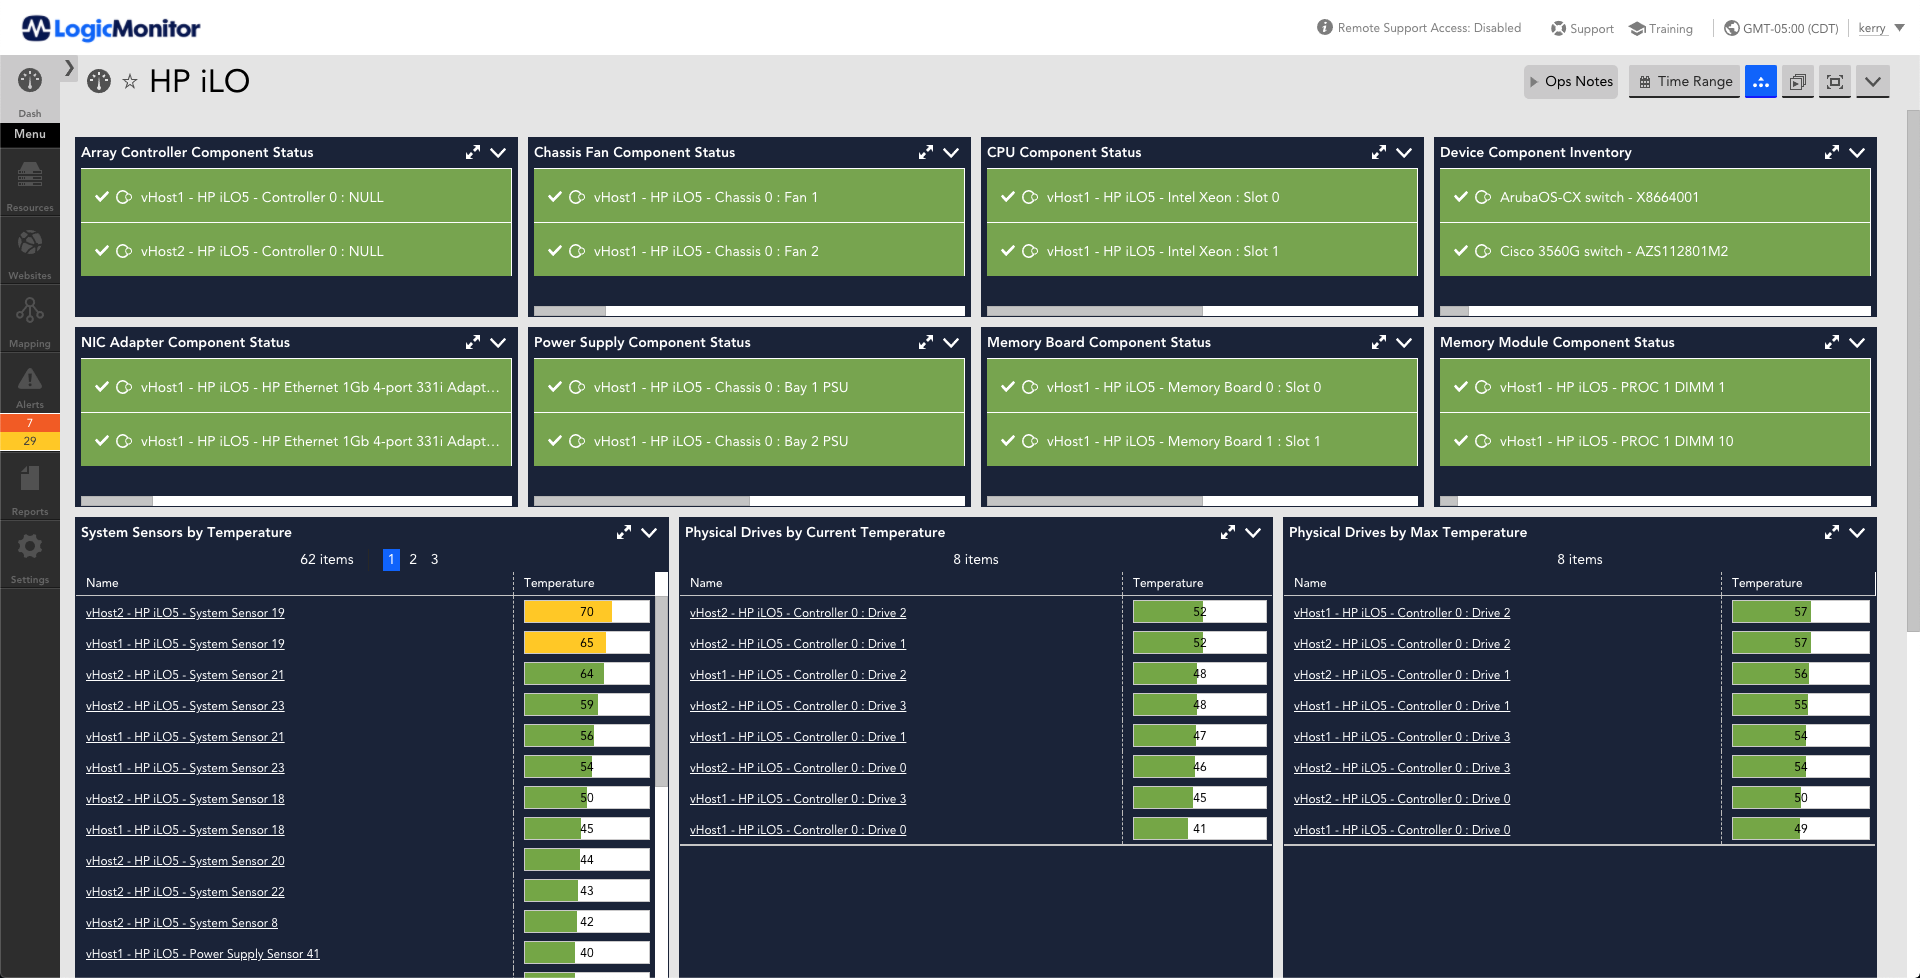
Consolidate  servers and improve utilization of your compute resources while staying ahead of issues that can affect your virtual machines. With LogicMonitor’s HPE management software, you don’t have to be an expert. Use our unique “Top 10” visualizations to identify problem hypervisors before they impact service health. When you have a service outage and need immediate root-cause analysis, see your entire environment with LogicMonitor. 

This dashboard provides an a listing of various metrics that are monitored for HP iLO. The metrics displayed are status, Alerts, current sensor temperature, current drive temperature, drive max temperature

A better way to collaborate, communicate, and automate

extensibility graphic

Monitor your entire HPE environment

LogicMonitor provides in-depth, agentless monitoring of your entire HPE ecosystem in a snap. We discover your HPE servers and applications automatically and begin monitoring. No manual configuration or additional hardware needed – just the end-to-end analysis and visualization you need, all within minutes. 

clarity graphic

Get deeper insights & proactively prevent downtime

Out-of-the-box dashboards provide deeper insight and will help you identify how you can optimize utilization on your HPE servers in real-time. Pre-configured alert thresholds ensure that you receive meaningful alerts from the start and help you proactively prevent latency, high response times, and downtime. 

Operational efficiency graphic

Pinpoint anomalies in all your HPE environments

Pinpoint anomalies for monitored HPE applications no matter where they’re running and compare that anomaly to key historical signals. Quickly understand where any performance issues lie, whether on a physical, virtual, or on-premises server and in both cloud and hybrid environments. 

HPE Integrations Include: