Hewlett Packard P4000
LogicMonitor includes support for monitoring technologies from HP. We include LogicModules out-of-the-box that monitor critical HP performance metrics to build out dashboards that show the data critical to your IT Operations.
HP P4000 Monitoring
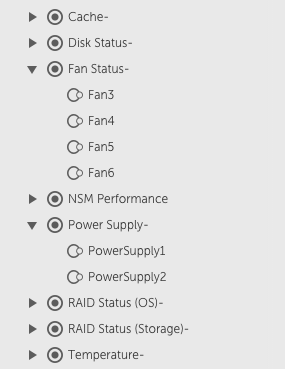
HP’s P4000 SAN scales in capacity and performance by adding new storage nodes – but with LogicMonitor, that doesn’t mean the monitoring scales in complexity. With no configuration, LogicMonitor will give you complete P4000 monitoring, trending and alerting, including:
- extensive health checks of every storage node: from fans and temperature to RAID and replication status
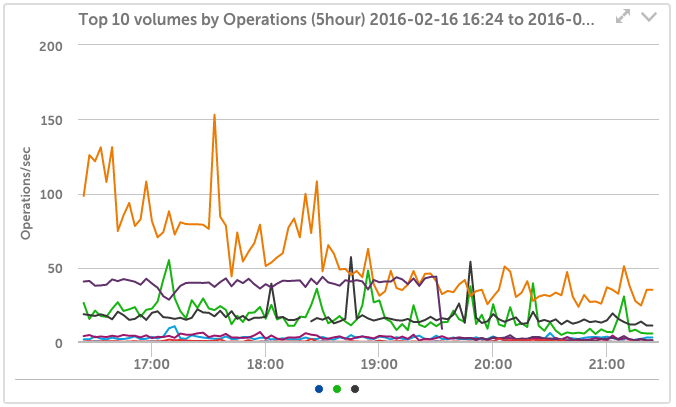
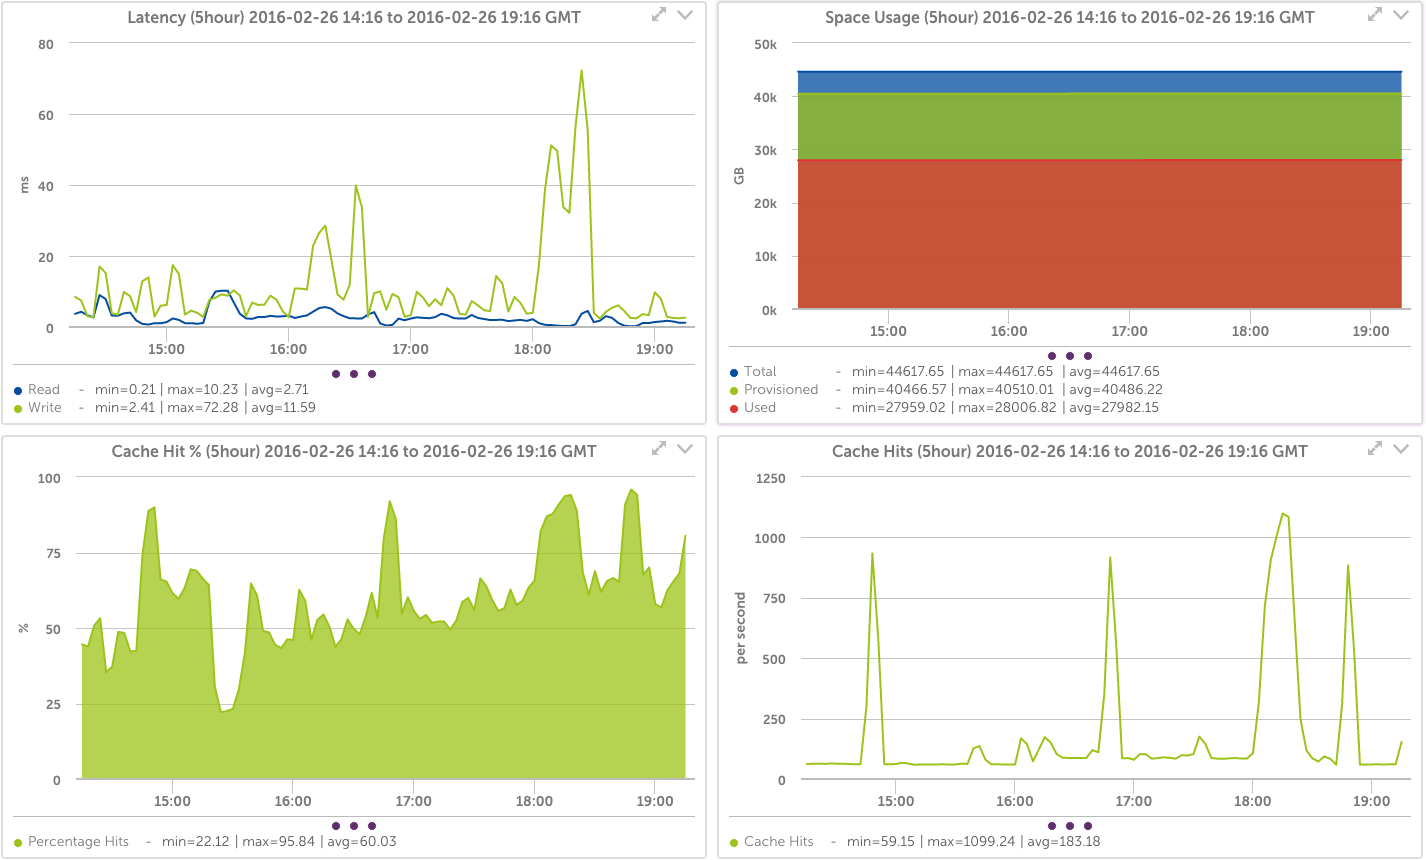
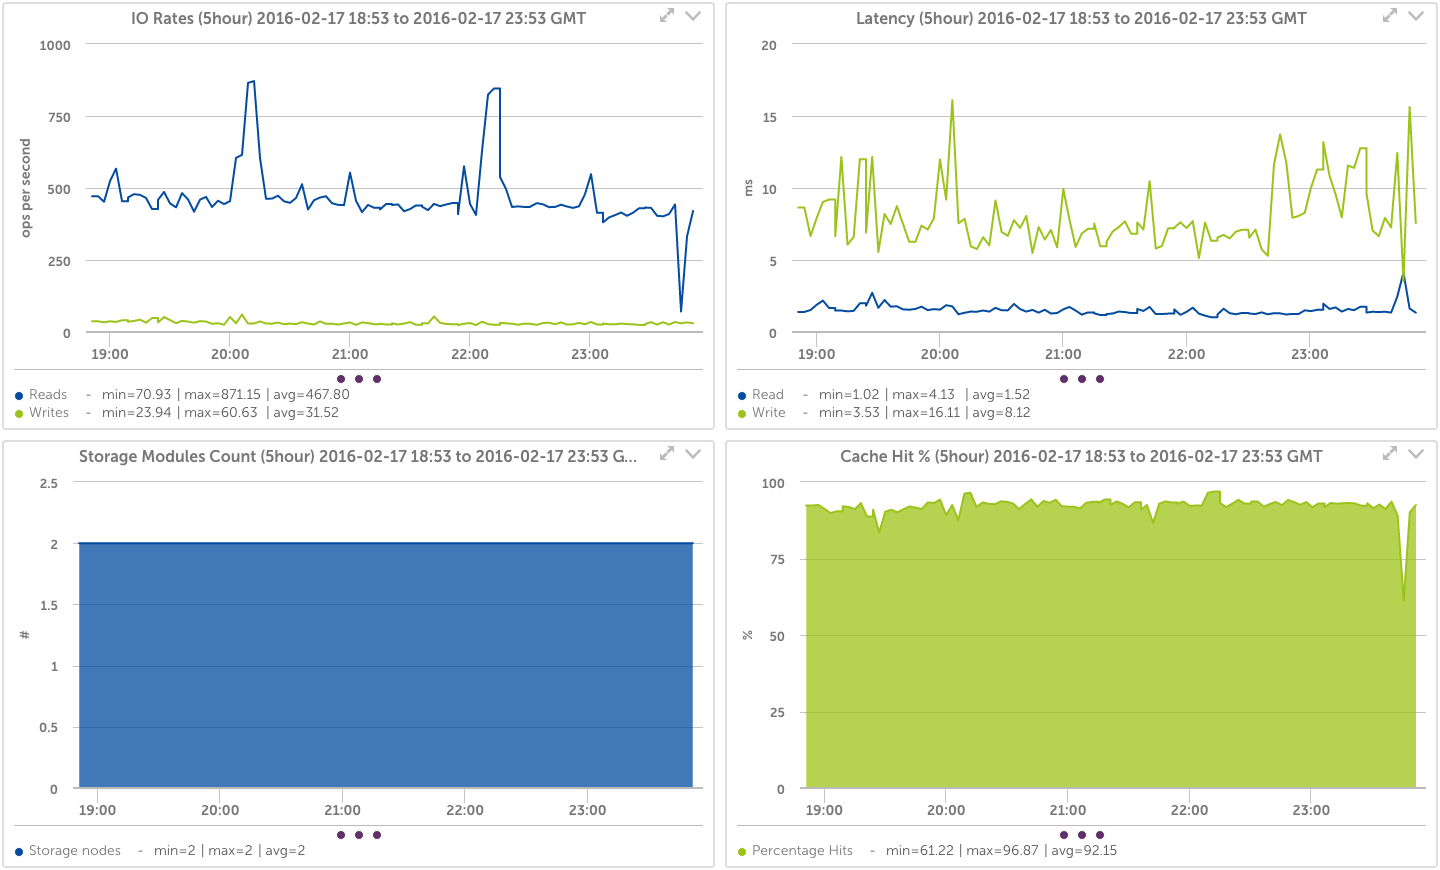
- performance of every node: data rates, IO rates, and node latency
- monitoring of every single disk, including SMART status, in the cluster
- cluster wide statistics and performance
- network, memory and CPU loads
- much more