LogicMonitor uses the JMX collection method to collect performance and configuration data from Java applications using exposed MBeans (Managed Beans). These MBeans represent manageable resources in the Java Virtual Machine (JVM), including memory, thread pools, and application-specific metrics.
To collect data using the JMX collection method, configure a datapoint that references a specific MBean and one of its attributes. Specify the following:
- MBean ObjectName— A domain and one or more key–value properties.
For example,domain=java.lang, propertiestype=Memory. - Attribute— The attribute to collect from the MBean.
Each MBean exposes one or more attributes that can be queried by name. These attributes return one of the following:
- A primitive Java data type (for example,
int,long,double, orstring) - An array of data (for example, an array of primitives or nested objects)
- A hash of data (for example, key–value pairs, including nested structures or attribute sets)
LogicMonitor supports data collection for all JMX attribute types.
Note:
LogicMonitor does not support JMX queries that include dots (periods) unless they are used to navigate nested structures.For example:
- rep.Container is invalid if it is a flat attribute name.
- MemoryUsage.used is valid if MemoryUsage is a composite object and used in a field inside it.
When configuring the JMX datapoint, LogicMonitor uses this information to identify and retrieve the correct value during each collection cycle.
For more technical details on MBeans and the JMX architecture, see Oracle’s JMX documentation.
Simple Attribute Example
If the attribute is a top-level primitive:
- MBean ObjectName:
java.lang:type=Threading - MBean Attribute:
ThreadCount
LogicMonitor collects the total number of threads in the JVM.
Nested Attribute Example
If the attribute is part of a composite or nested object, use the dot/period separator as follows:
- MBean ObjectName:
java.lang:type=Memory - MBean Attribute:
HeapMemoryUsage.used
LogicMonitor collects the amount of heap memory used.
Multi Level Selector Example
To collect data from a map or nested structure with indexed values:
- MBean ObjectName:
LogicMonitor:type=rrdfs - MBean Attribute:
QueueMetrics.move.key1
LogicMonitor retrieves the value associated with the key key1 from the map identified by index move under the QueueMetrics attribute of the MBean.
CompositeData and Map Support
Some JMX MBean attributes return structured data such as:
- CompositeData: A group of named values, like a mini object or dictionary.
- Map: A collection of key-value pairs.
LogicMonitor supports collecting values from both.
Accessing CompositeData Example
A CompositeData attribute is like a box of related values, where each value has a name (field). To collect a specific field from the structure, use a dot (.) separator.
MBean: java.lang:type=GarbageCollector,name=Copy
Attribute: LastGcInfo
Value Type: CompositeData
To access the specific value for the number of GC threads use: LastGcInfo.GcThreadCount
Note: Maps in JMX behave similarly to CompositeData, but instead of fixed fields, values are retrieved using a key.
TabularData Support
Some MBean attributes return data in the form of TabularData, a structure similar to a table, with rows and columns. LogicMonitor can extract specific values from these tables.
A TabularData object typically consists of:
- Index columns: Used to uniquely identify each row (like primary keys in a database)
- Value columns: Contain the actual data you want to collect
You can access a value by specifying:
- The row index (based on key columns)
- The column name for the value you want
Single Index TabluarData Example
The MBean java.lang:type=GarbageCollector,name=Copy has an attribute LastGcInfo. One of its child values, memoryUsageAfterGc, is a TabularData. 
The table has 2 columns – key and value. The column key is used to index the table so you can uniquely locate a row by specifying an index value.
For example, key=”Code Cache” returns the 1st row.
To retrieve the value from the value column of the row indexed by the key "Eden Space", use the expression: LastGcInfo.memoryUsageAfterGc.Eden Space.value
In this expression, "Eden Space" is the key used to identify the specific row, and value is the column from which the data will be collected.
Multi-Index TabularData Example
Some tables use multiple index columns to identify rows.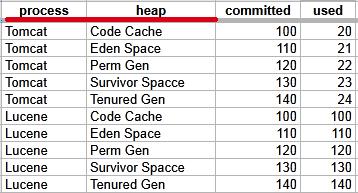
This TabularData structure has four columns, with process and heap serving as index columns. A unique row is identified by the combination of these index values.
To retrieve the value from the committed column in the row where process=Tomcat and heap=Perm Gen, use the expression: LastGcInfo.memoryUsageAfterGc.Tomcat,Perm Gen.committed
Here, Tomcat,Perm Gen specifies the row, and committed is the column containing the desired value.
Array or List Support
Some MBean attributes return arrays or lists of values. LogicMonitor supports collecting data from these array or list values using index-based access.
For example, the MBean: java.lang:type=GarbageCollector,name=Copy has an Attribute: MemoryPoolNames with Type: String[] 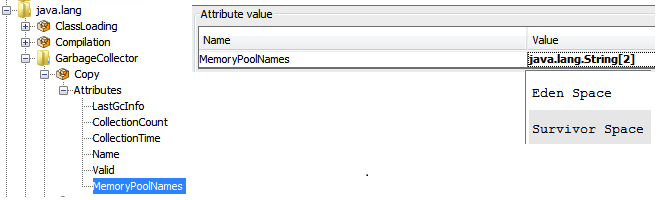
To access/collect the first element of this array, the expression “MemoryPoolNames.0“ can be used, where “0” is the index to the array (0-based).
You can access the array elements by changing the index as follows:
MemoryPoolNames.0 = "Eden Space"MemoryPoolNames.1="Survivor Space"
The same rule applies if the attribute is a Java List. Use the same dot and index notation.
To enable JMX collection for array or list attributes:
- Make sure your Java application exposes JMX metrics.
- Confirm that the username and password for JMX access are correctly set as device properties:
jmx.userjmx.pass
These credentials allow the Collector to connect to the JMX endpoint and retrieve the attribute data, including elements in arrays or lists.
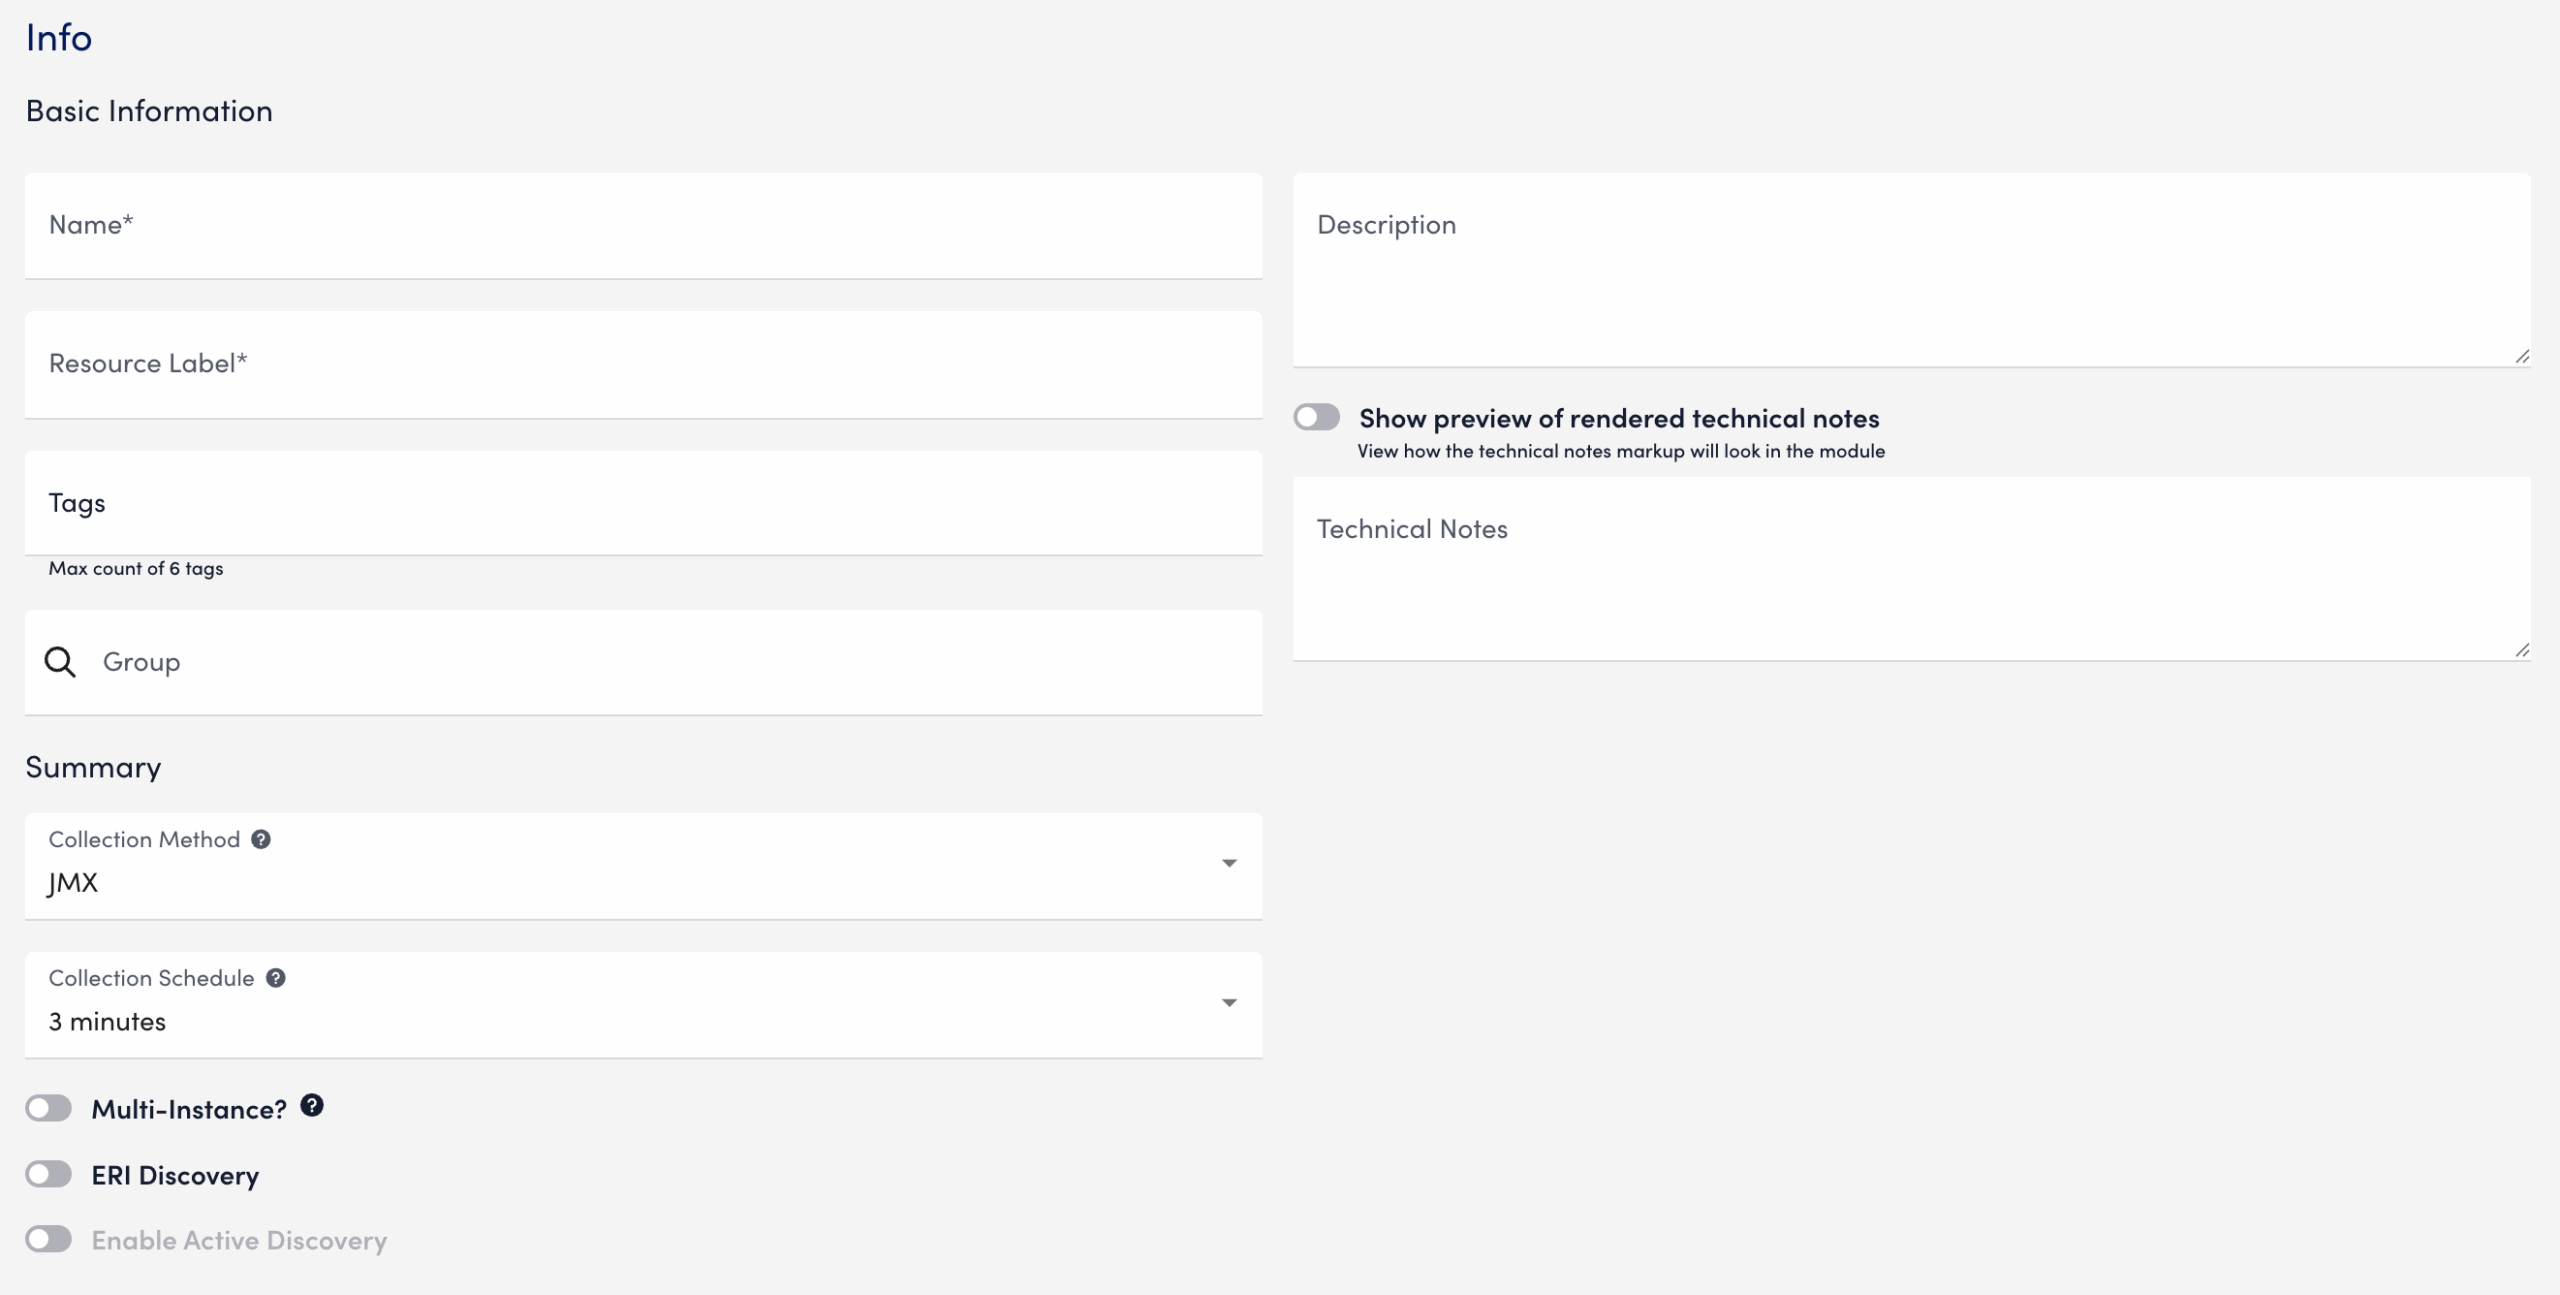
Configuring a Datapoint using the JMX Collection Method
- In LogicMonitor, navigate to Modules. Add a new DataSource or open an existing module to add a datapoint for JMX collection.
For more information, see Custom Module Creation or Modules Management in the product documentation. - In the Collection Method field, select “JMX”.
- Select Add a Normal Datapoint.
- In the Name field, enter a name for the datapoint.
- In the Description field, enter a description.
- In the MBean object field, enter the MBean path, including the domain and properties.
- In the MBean attribute field, enter the specific attribute or nested field to collect.
- In the Metric Type field, select the metric type for the response.
- Configure any additional settings, if applicable.
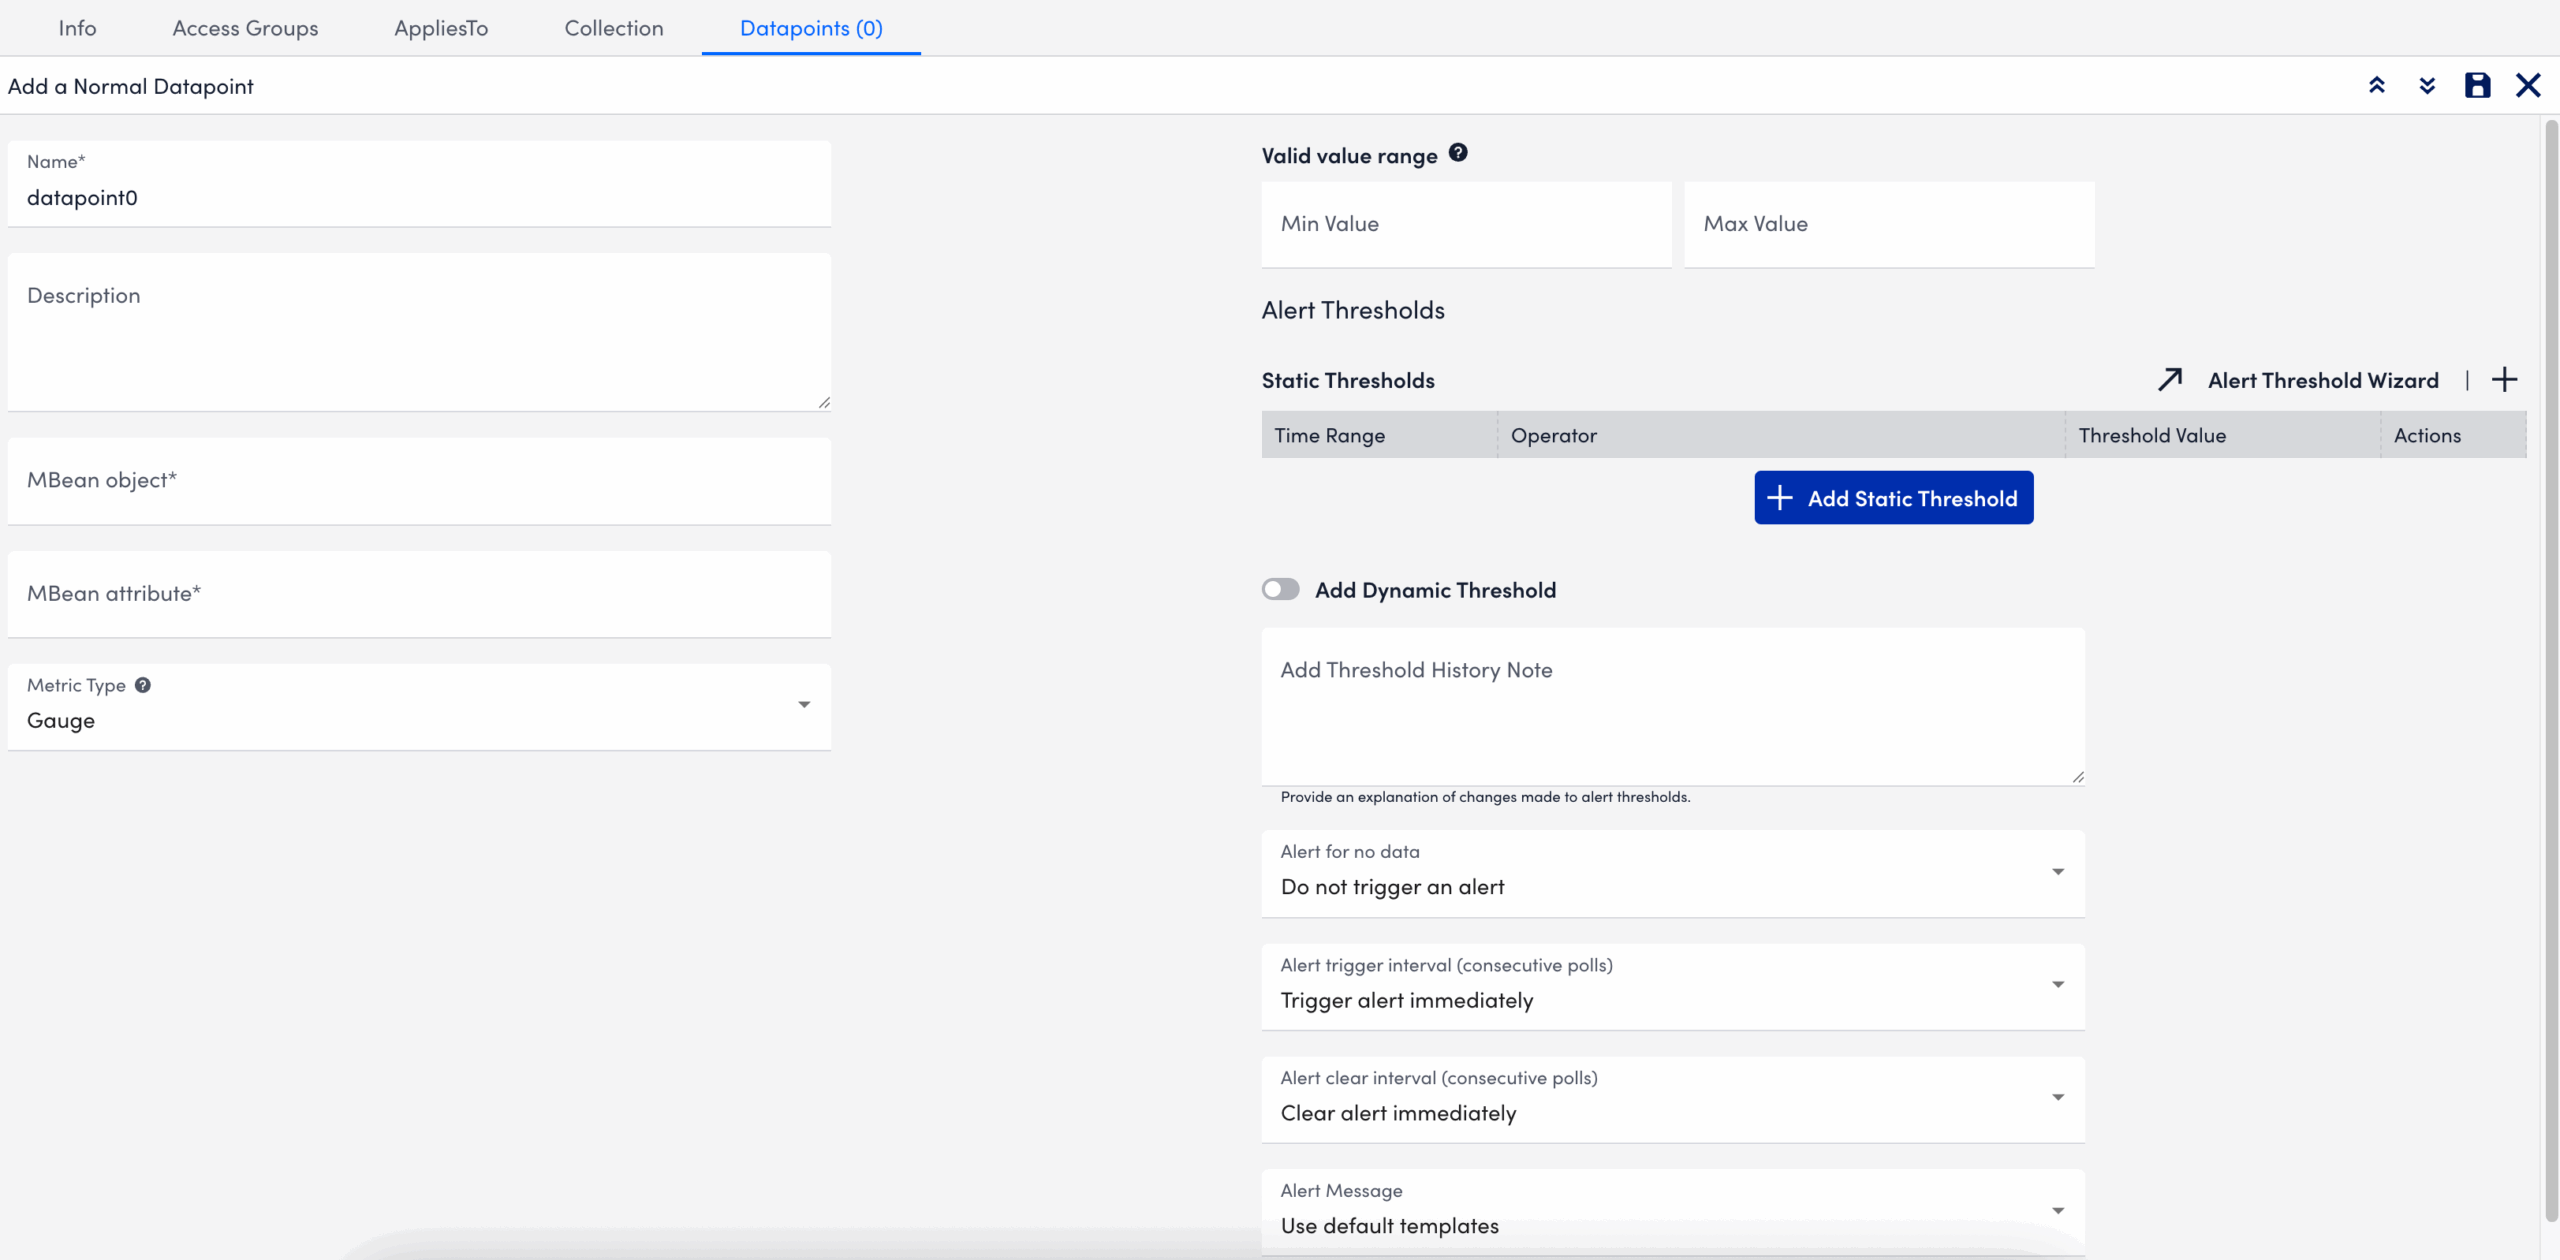
- Select
 Save.
Save.
The datapoint is saved for the module and you can configure additional settings for the module as needed. For more information, see Custom Module Creation or Modules Management.
Troubleshooting JMX Data Collection
Collector does not support the first-level JMX attributes that contain dots(.). By default, the Collector treats dots as path separators to access nested data. If the dot is simply a part of the attribute’s name and not intended to indicate a hierarchy, it can cause:
- ANullPointerException in the JMX debug window,
- NaN (Not a Number) values in the Poll Now results, and
- Failure to collect data correctly
Mitigating JMX Data Collection Issues
To prevent data collection errors with attributes that include dots, do the following:
- Identify the attribute name in your MBean that contains dots.
For example (attribute name):jira-software.max.user.count - Determine whether the dots are part of the attribute name or indicate a nested path.
- If the dots are part of the attribute name, escape each dot with a backslash (
\.).
For example:jira-software\.max\.user\.count - If the dots indicate navigation inside a structure, do not escape them.
- If the dots are part of the attribute name, escape each dot with a backslash (
- Enter the attribute in the LogicModule or JMX Debug window, using the escaped form only when the dots are part of the attribute name.
- Verify the data collection using the Poll Now feature or JMX debug window.
Attribute Interpretation Examples
| Attribute Format | Interpreted in Collector Code as |
jira-software.max.user.count | jira-software, max, user, count (incorrect if flat attribute) |
jira-software\.max\.user\.count | jira-software.max.user.count (correct interpretation) |
jira-software\.max.user\.count | jira-software.max, user.count |
jira-software.max.user\.count | jira-software, max, user.count |
Use the SNMP Trap MIBs to upload MIB files for SNMP Trap Logs ingestion. When you upload a MIB and dependent files, LogicMonitor automatically validates the files and uses them for SNMP trap translation. This provides an efficient method for uploading MIB files in LogicMonitor.
Note: If you are leveraging the MIBs to JSON Converter Utility to convert MIB files, see Translating SNMP Traps using Custom MIBs for more information.
Note: For SNMP Trap logs translation, the Collector prioritizes MIBs uploaded through the SNMP Trap MIBs setting over JSON files placed in the
SNMP Trap MIB Validation
MIB validation consist of the following:
- During validation, LogicMonitor verifies the file extension and content of the MIBs. It also validates the MIB dependencies (the MIB names mentioned in the
IMPORTSsection of the MIB being uploaded) across files currently being uploaded and the previously uploaded MIB files. - Validation results are retained for two hours. You must add the valid MIB files within two hours or start a new validation request.
Uploaded SNMP Trap MIB Details
You can view the following details about the uploaded MIBs on the SNMP Trap MIBs page:
| Column Name | Description |
| MIB | Displays the MIB definition. Note: The uploaded MIB file contains the MIB definition. The MIB is not necessarily named after the MIB definition. |
| Status | Displays the following supported statuses of the uploaded MIBs:
|
| Time Processed | Displays the date and time when the MIB was uploaded and processed. |
| Status Details | Displays the error message and the reason for failing to process the MIB file. |
Note: You cannot delete MIB files uploaded to LogicMonitor portal.
Requirements for Uploading SNMP Trap MIBs
To upload SNMP trap MIBs, you need the following:
- To upload MIB files, you need a LogicMonitor user with the “Manage” permission set. For more information, see LogicMonitor Roles.
- LogicMonitor Collector version must be EA 38.300 or later to consume the uploaded MIBs for trap translation.
- The Collector must be configured to ingest SNMP trap logs using any of the SNMP trap processing preferences. For more information, see SNMP Traps Processing Preference.
- The MIB and all dependent files must be available to upload.
- The MIB files that you want to upload must meet the following requirements:
- Size of a single MIB file must be less than 2 MB.
- Only a single MIB definition is allowed per MIB file.
- The cumulative limit across all uploaded files in a single request is 9 MB for a single upload request. The total MIB upload limit is 1000 MIB files.
- The supported file extensions are
.mib,.txt, or files with no extension.
Uploading SNMP Trap MIBs
- In LogicMonitor, navigate to Settings > SNMP Trap MIBs.
The SNMP Trap MIBs page is displayed.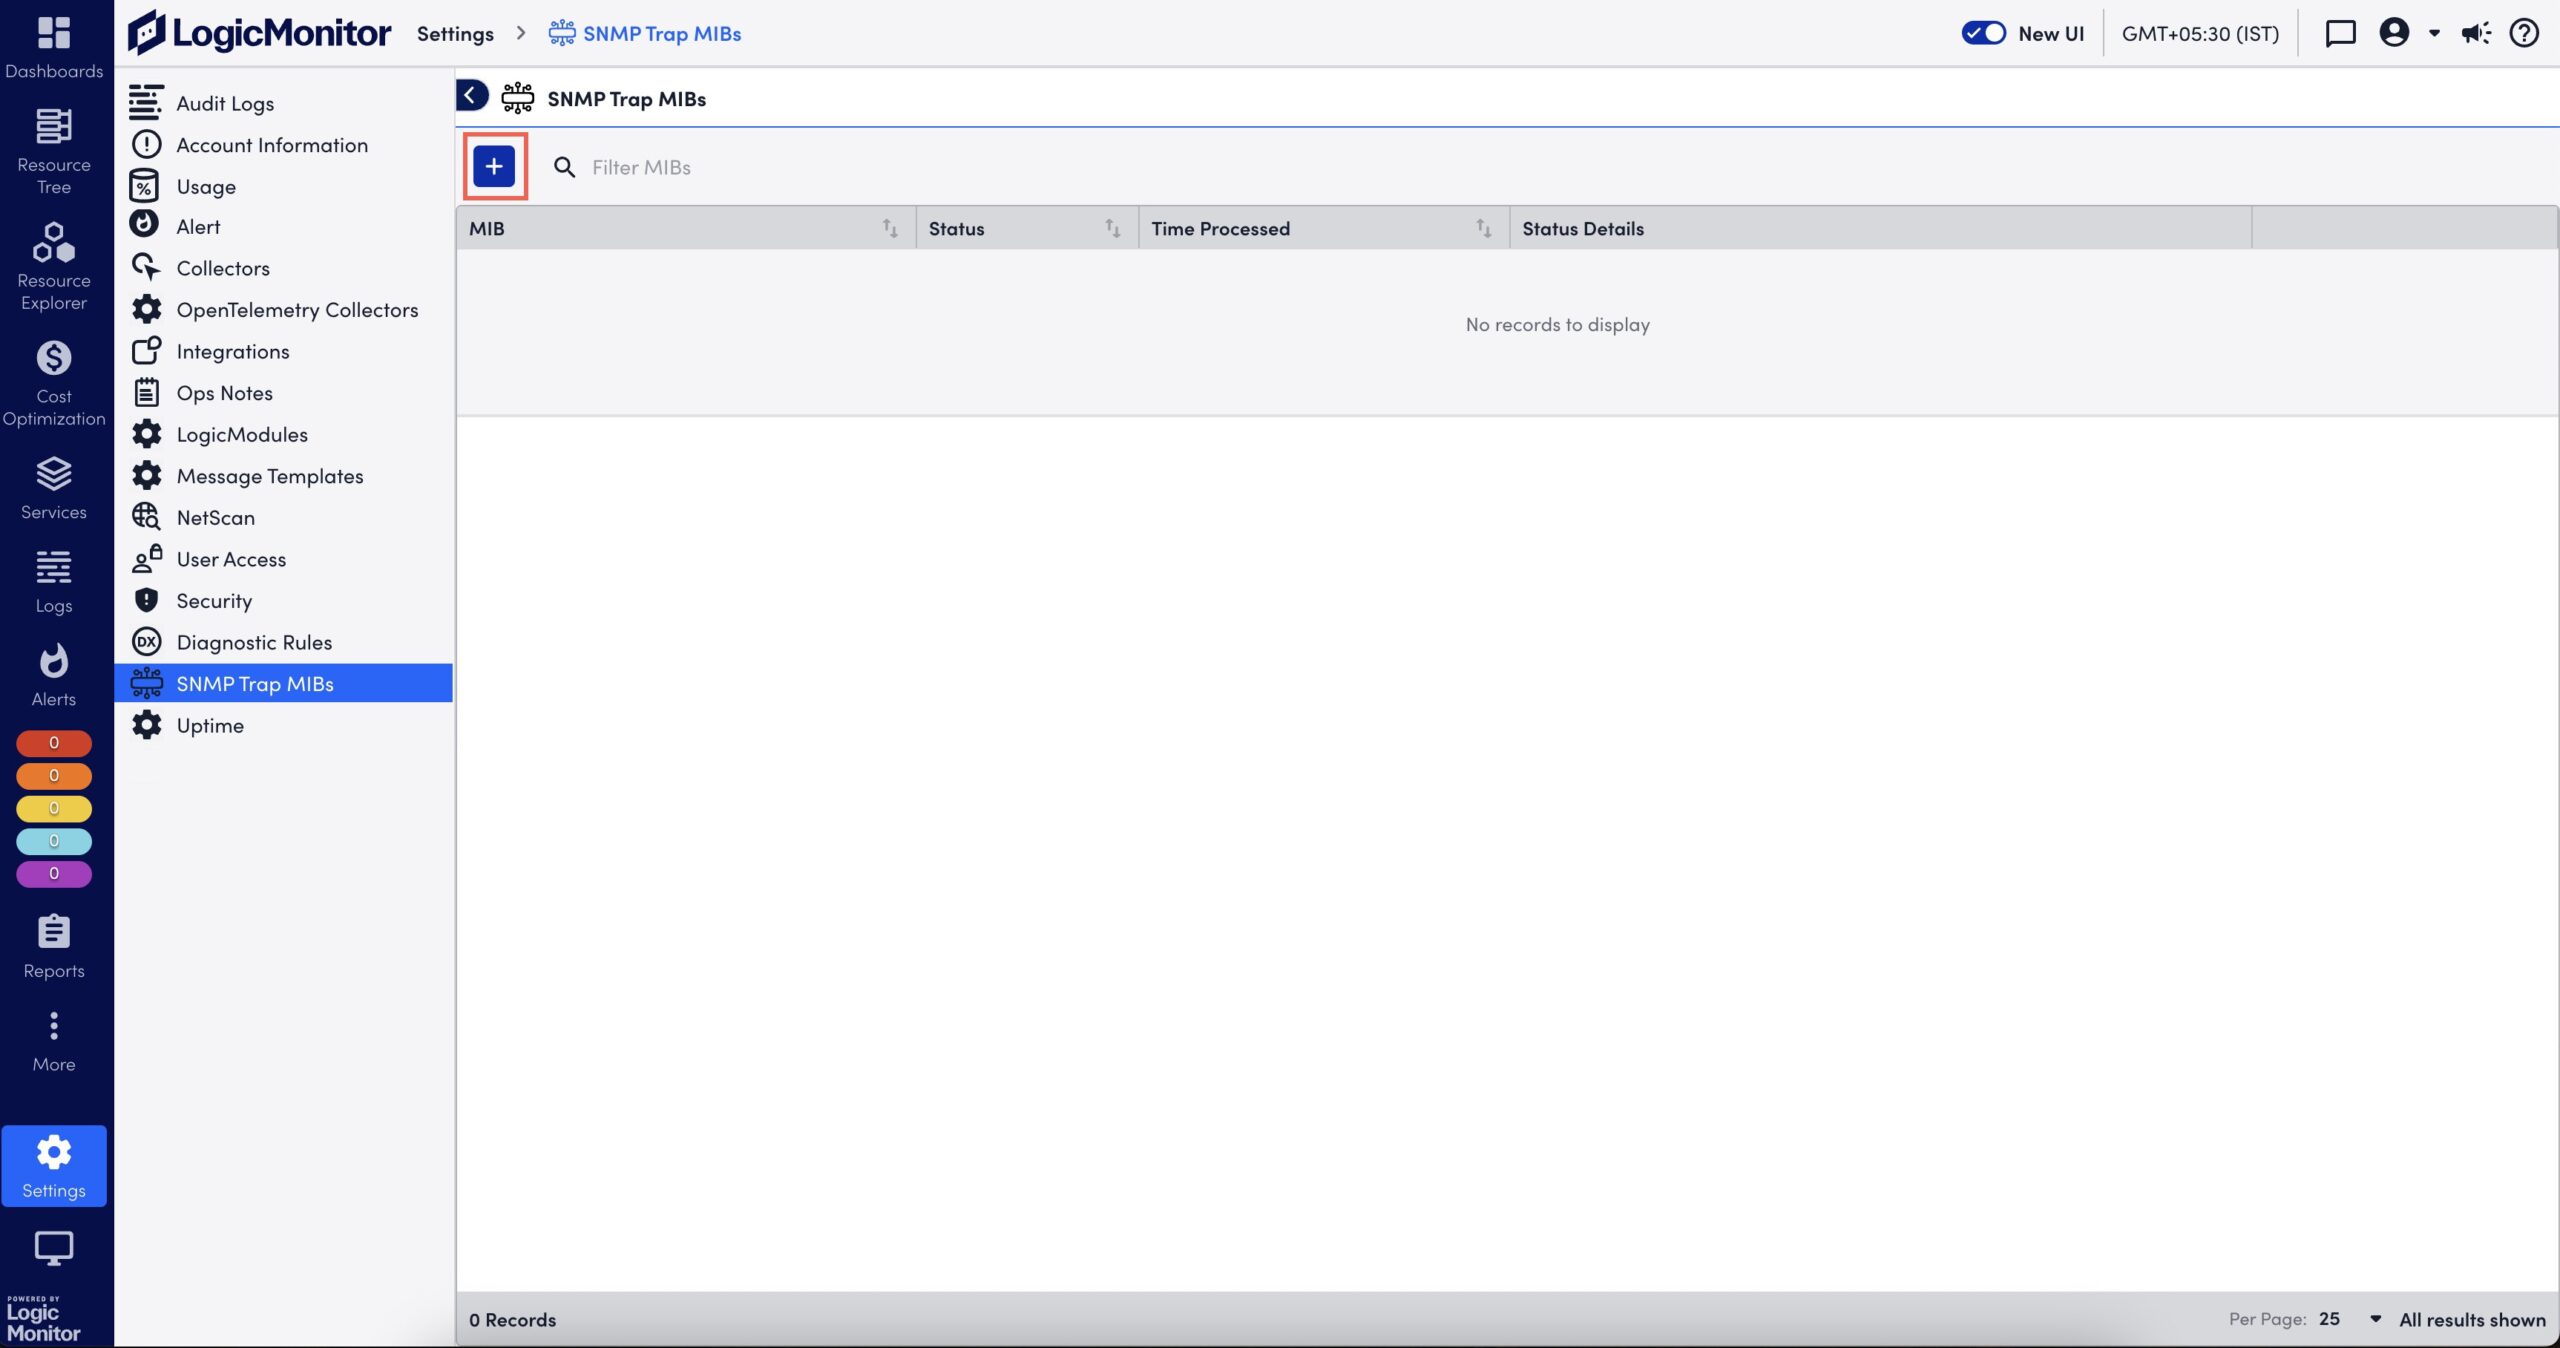
- Select
 to upload a MIB file.
The Add MIBs dialog box is displayed. - Browse and select one or multiple MIB files.
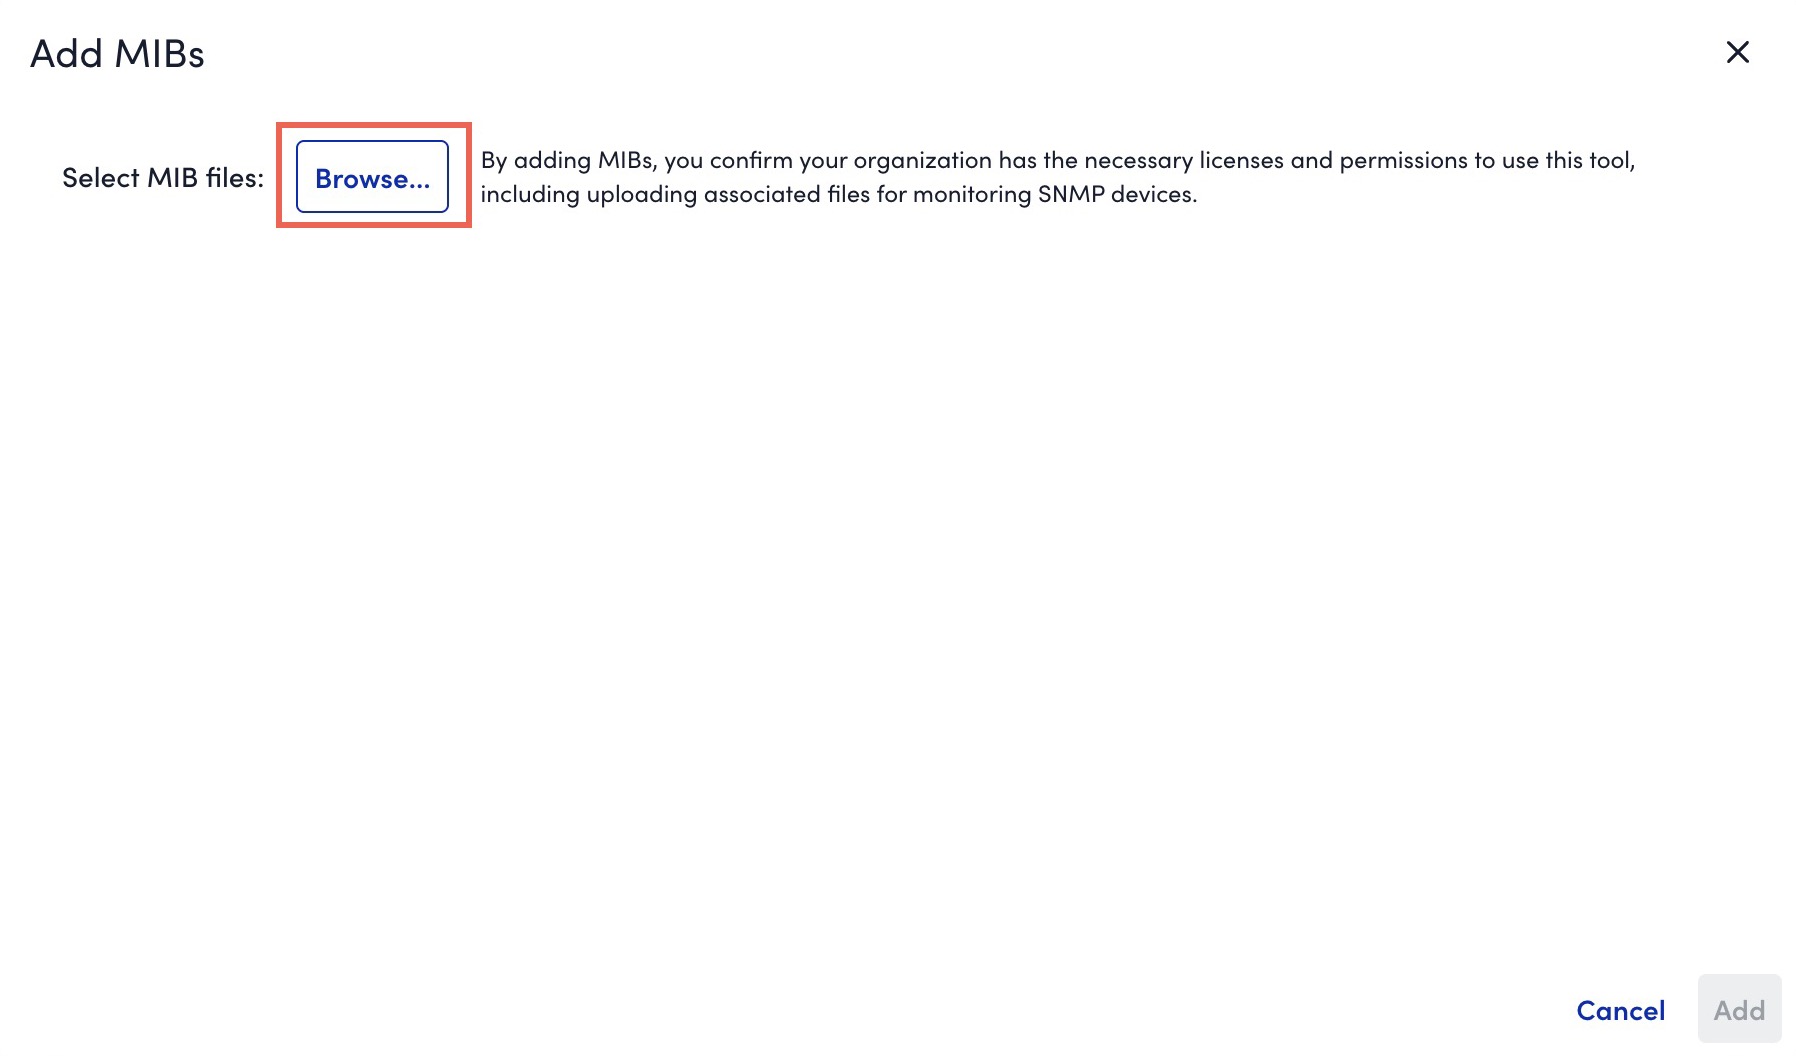
- If you are not able to upload all dependent MIBs together, you must first upload the parent MIBs (or the MIBs mentioned in Missing Dependencies message).
- If a MIB fails validation due to invalid file extension, you can rename it with
.mib,.txt, or a file without extension. - If a MIB file that you uploaded has a MIB definition that already exists in the system, during the MIB validation, a message indicating that the existing MIB will be replaced with the newly uploaded MIB is displayed. If you continue with the upload, the existing MIB definition is overwritten by the MIB definition in the new MIB file.
- If a file fails validation while other files succeed, you can do one of the following:
- Upload necessary MIBs to resolve dependency issues without losing prior result.
- Add valid MIBs immediately for further processing.
- If multiple files with the same MIB definition are included in a single upload request, only one of the files is considered for upload.
- The system validates the files and displays the validation result. If the validation fails due to a missing dependent file, upload the missing file.
- Select Add X valid MIBs.
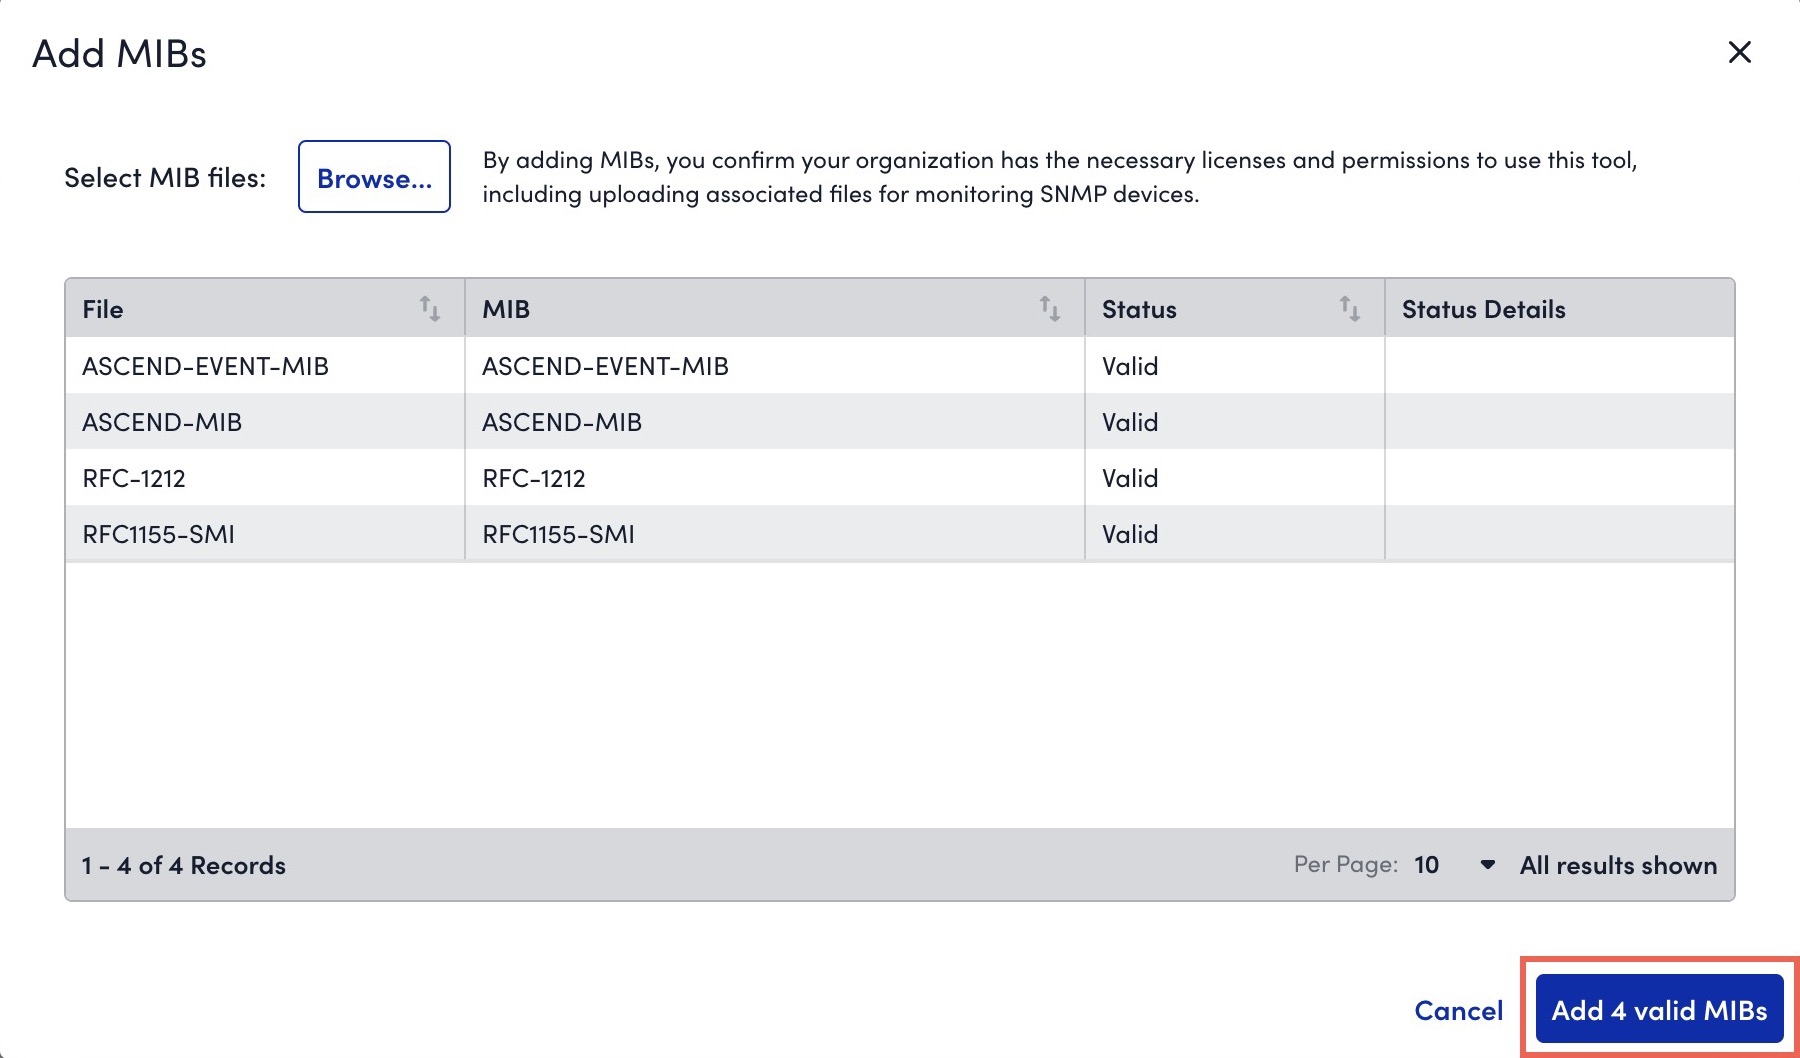
The valid MIBs are uploaded to LogicMonitor.
On the SNMP Trap MIBs page, the MIBs are processed and you can view status of the uploaded MIBs. For more information, see Uploaded SNMP Trap MIB Details.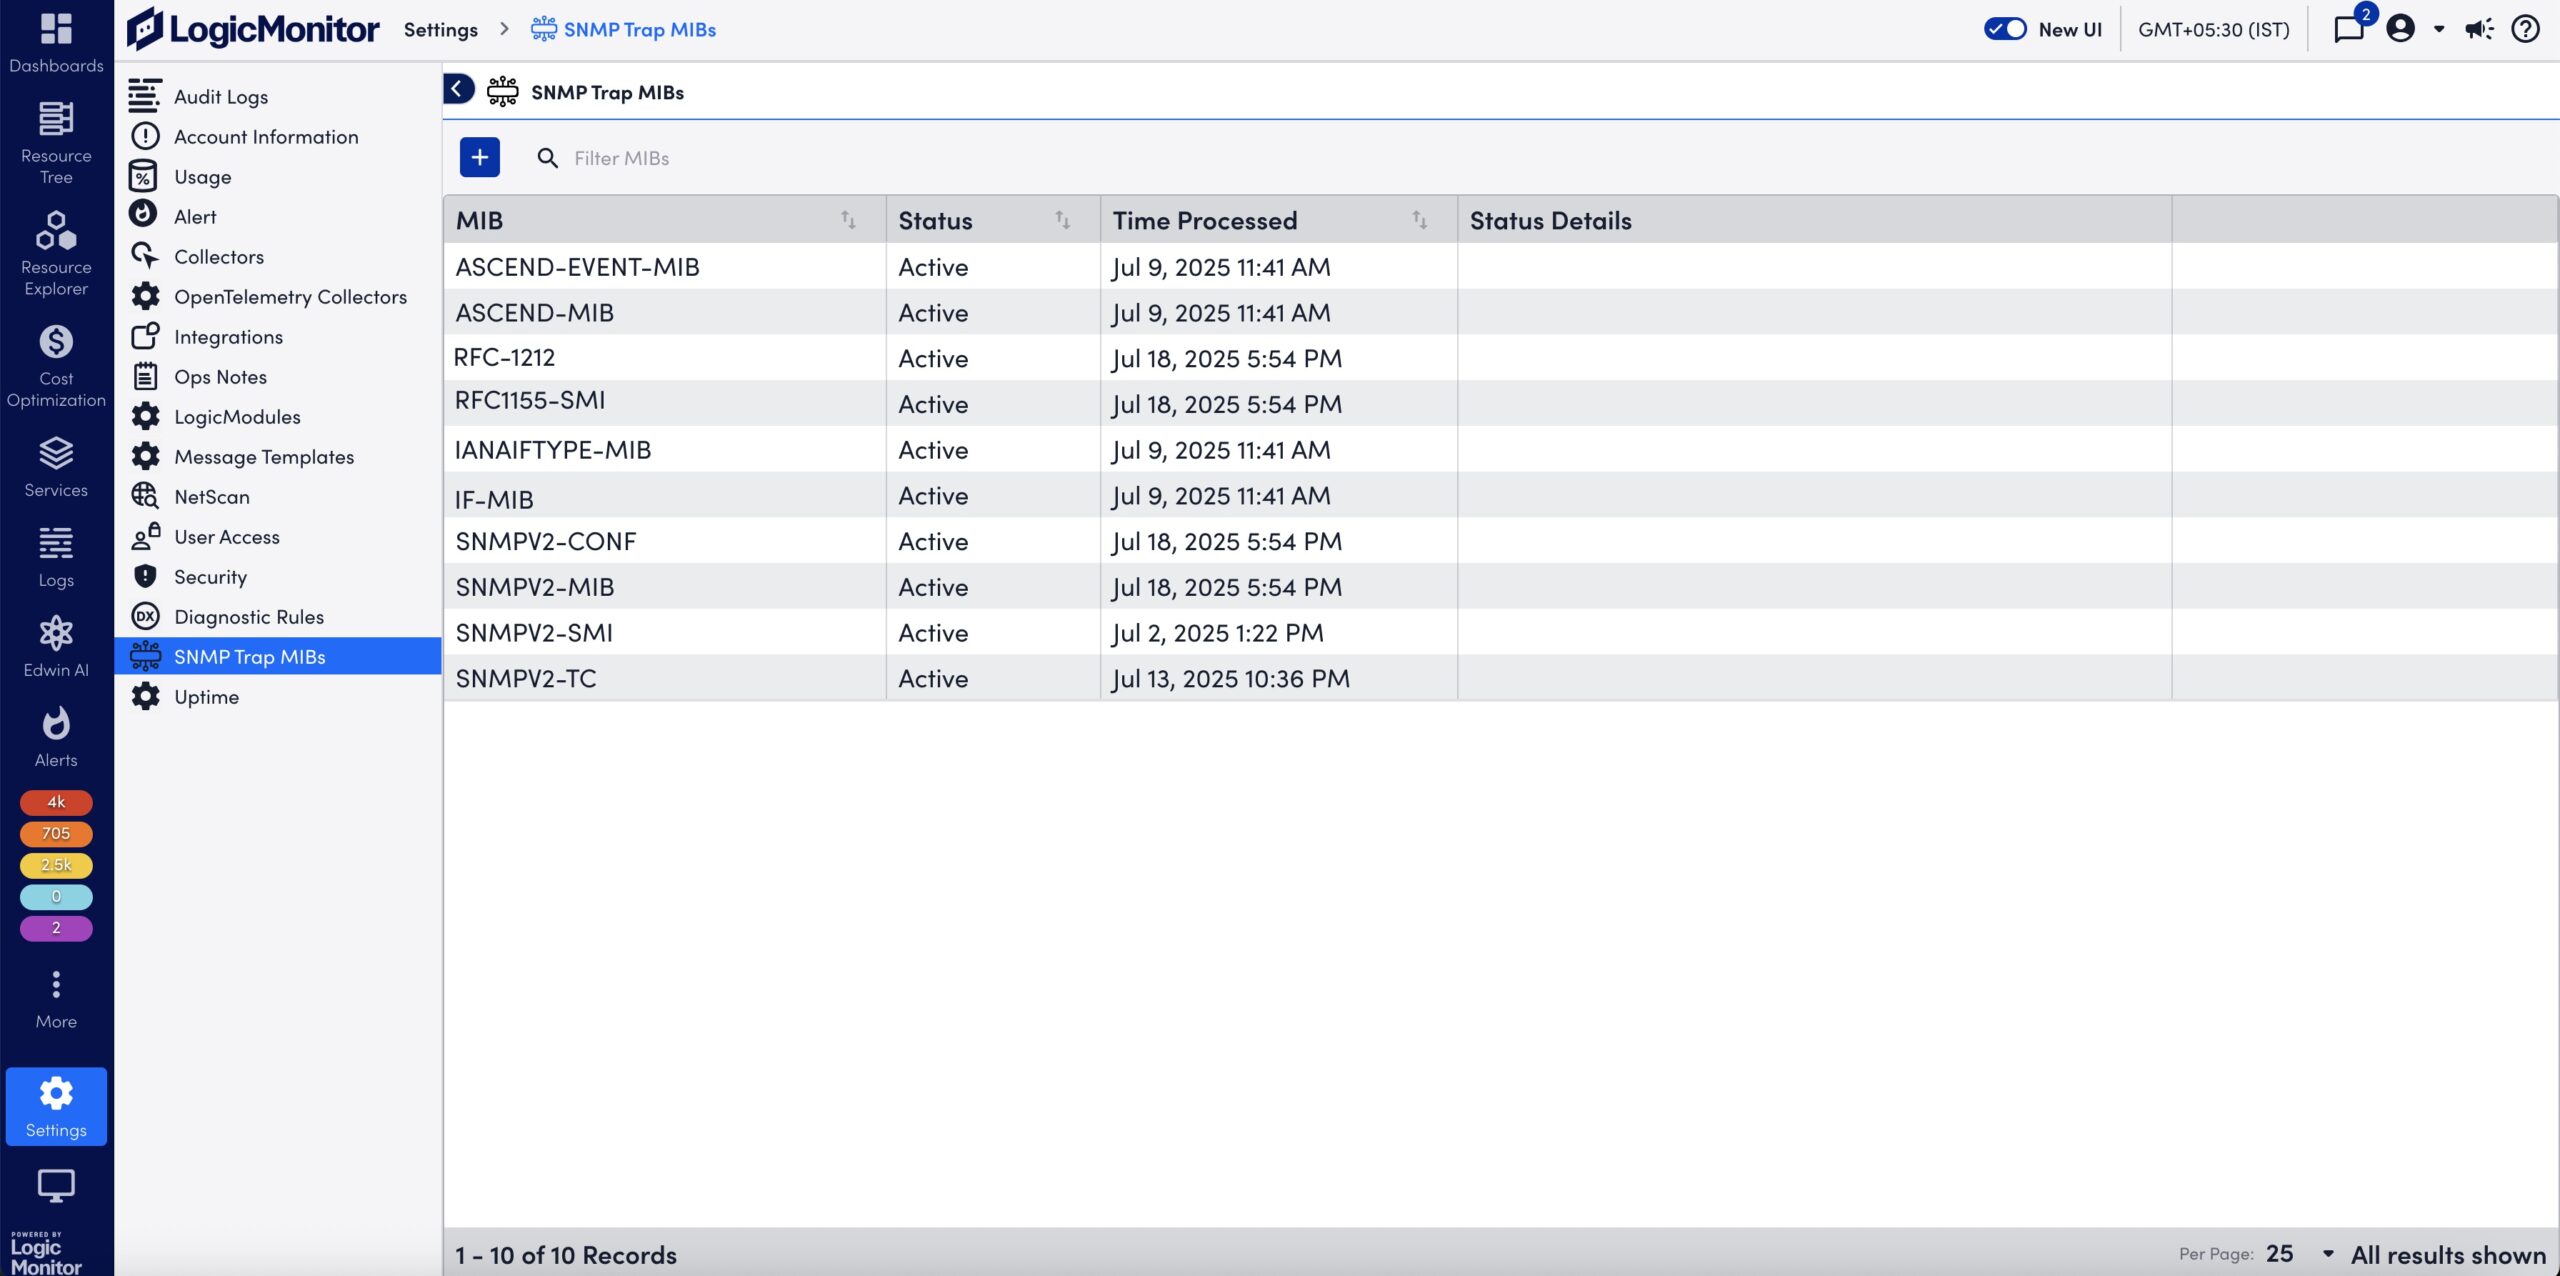
- Open the terminal and enter the following command:
$ crontab -e - Enter the password.
Note: If you log in as a root user, you are not be required to enter the password.
- Update the Cron Jobomonitor by running the following command:54 11 * * *
/usr/local/logicmonitor/agent/lib/lmbatchjobwrapper.sh <agent ip>:7214 nginx.corp.exactasystems.co "CORP-NGINX GixyTest 6am Daily" /etc/scripts/gixytest.sh > /<path>/anyfile.log 2>&1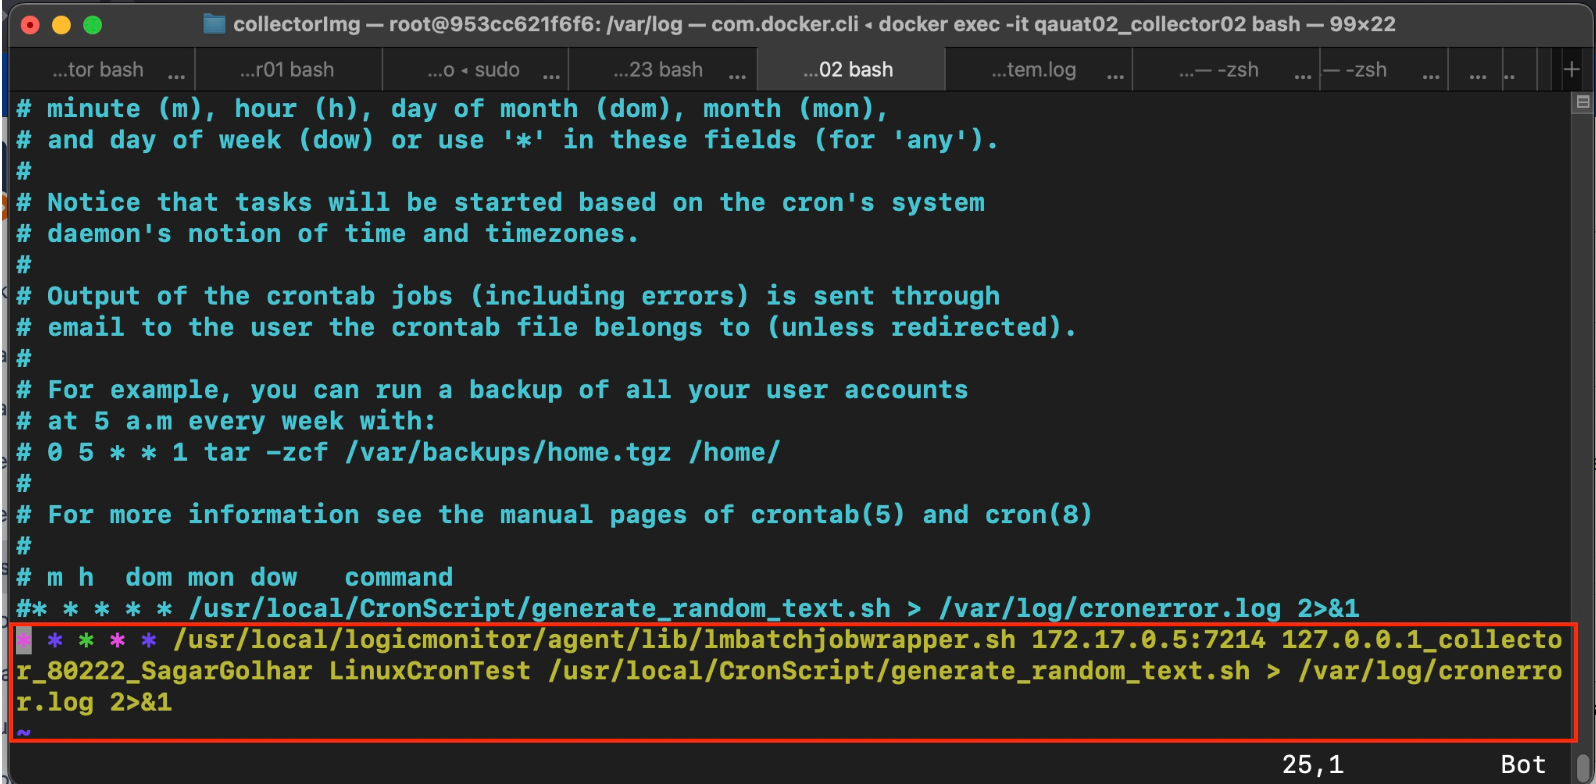
- To apply the changes, restart the Cron Jobmonitor by running the following command:
sudo systemctl restart cron - To see if the Cron jobs are running correctly, run the following command:
tail -f filename.log.
- To enable the Cron Jobmonitor logging, open
/etc/rsyslog.d/50-default.conffile by running the following command and uncommenting the code:# Uncomment the following line to enable cron logging to a separate file cron.* /var/log/cron.log cron.* /var/log/cron.log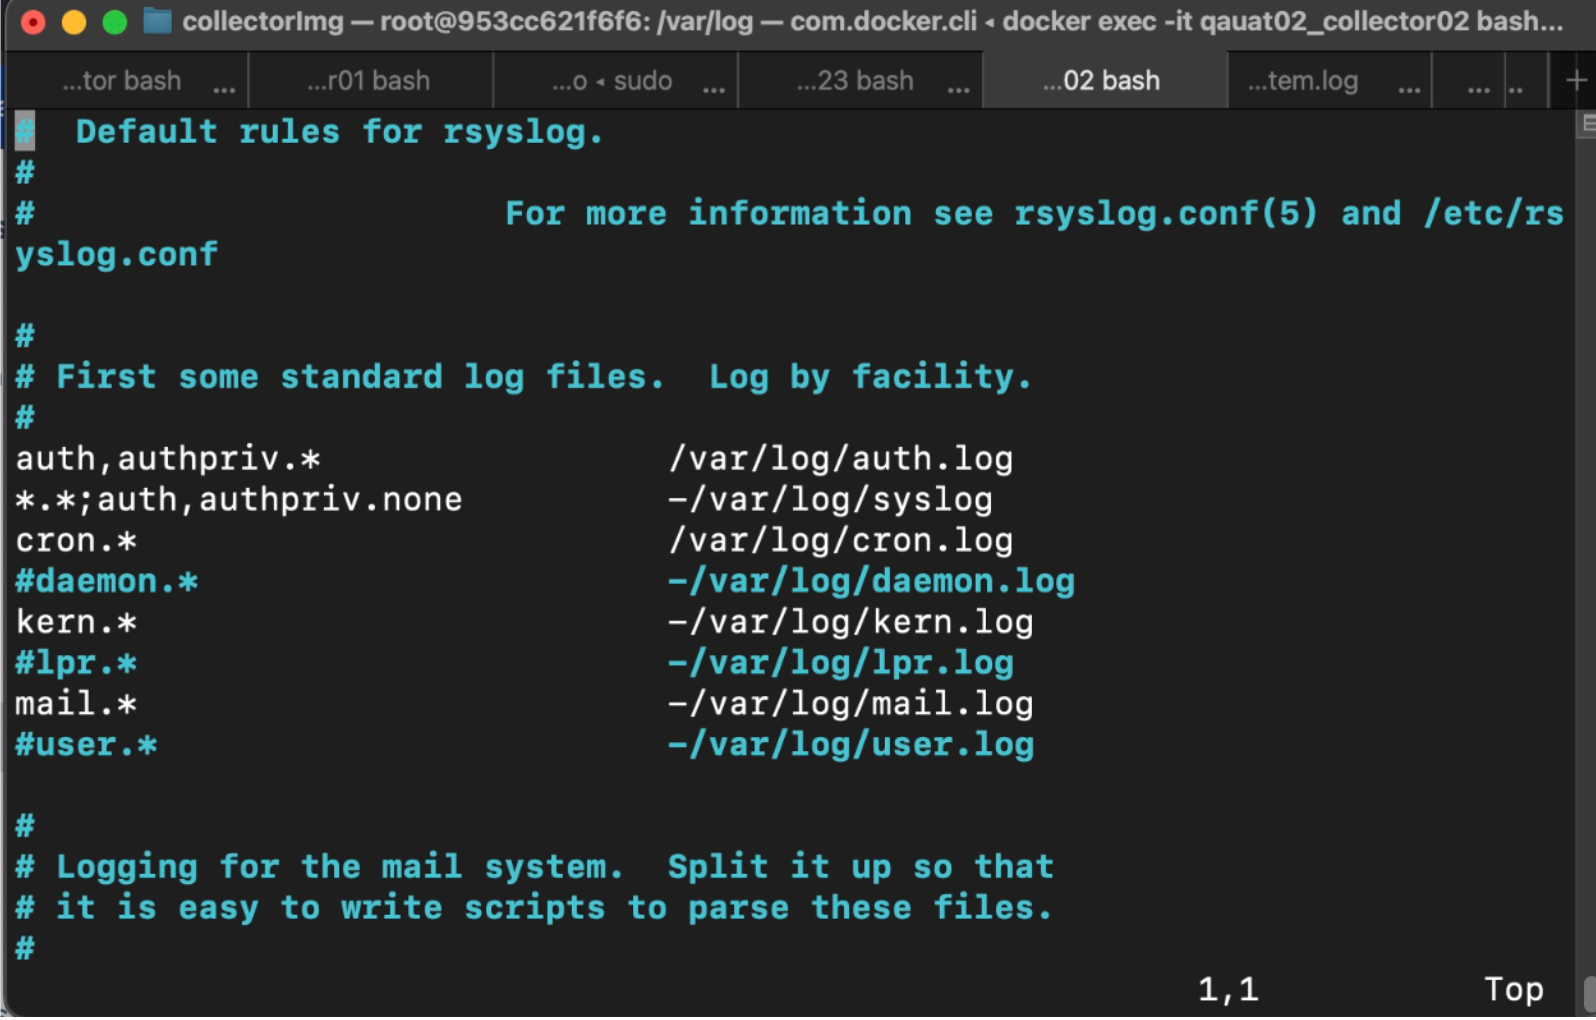
- Restart the Syslog service to ensure the logging configuration is updated and functional by running the following command:
sudo systemctl restart rsyslog - In the LogicMonitor portal, navigate to Resource Tree > select the resource on which jobmonitor module is applied.
- Select Job Monitor Executions tab.
The Cron Jobmonitor details are displayed.
Many resources and services use APIs to access logs. This can be cumbersome to customize and doesn’t support API filters. LogSource is a LogicModule that provides templates to help you enable LM Logs and configure log data collection and forwarding. LogSource contains details about which logs to get and where to get them, and which fields should be considered for parsing.
The Script Logs LogSource type helps you set up the import of API script type of logs to LogicMonitor. This LogSource type uses a script that calls an API and collects log data on a regular interval.
Configuration Options
The following describes configuration details specific to the Script Logs typeof LogSource. For general information on how to add a LogSource, see Configuring a LogSource.
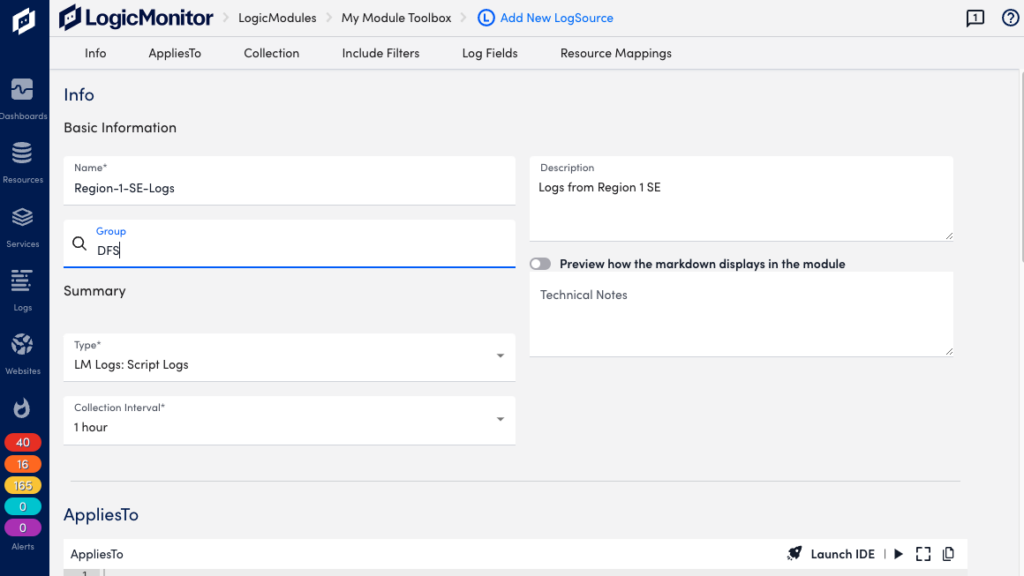
Basic Information
In the Collection Interval drop-down, select the time interval at which you want the script to be executed. Default is one hour.
Collection
In the Collection section, add an import script in Groovy format to collect log data from the resources you specified in the AppliesTo section.
Note: For the import to work, ensure that the AppliesTo criteria correctly matches the desired resources. You also need “Manage” permissions to at least one of the mapped resources. For more information, see Roles.
Include Filters
You can add filters to include resources of certain types, for example an application. The output matching the filter criteria is forwarded to the log ingestion process.
Available parameters
| Attributes | Comparison operator | Value example |
| Message | Contain, NotContain, RegexMatch, RegexNotMatch. | Any string that is part of the message. |
Log Fields
You can configure Log Fields (tags) to send additional metadata with the logs.
Available parameters
| Method | Key example | Value example | Description |
| Static | “Customer” | “Customer_XYZ” | |
| Dynamic(REGEX) | “Host” | “host=*” | The query will run on the message field. |
| LM Property(Token) | “Device” | “##system.deviceId##” | The DeviceID extracted from the existing device property in LM. |
Resource Mappings
Configure the LM log property to match a monitored resource.
Available parameters
| Method | Key example | Value example | Description |
| Static | “Customer_Id” | “1921” | |
| Dynamic(REGEX) | “system.ServiceName” | “service=*” | The query will run on the message field. |
| LM Property(Token) | “token.resourceMap” | “syslog_test_collector” | The DeviceID extracted from the existing device property in LogicMonitor. |
Examples
The following provides guidelines for creating import scripts for retrieving log events. You add scripts to the Collection section of the LogSource configuration.
A log event is a JSON object. When creating a JSON object for the output, ensure to follow these guidelines:
- The JSON object contains all the mandatory and customized event attributes.
- It contains a JSON array and other attributes indicating the status of the script, for example “status” and “message”.
- The JSON array contains all the events that will be reported to LogicMonitor.
The following syntax describes the output JSON object:
output            ::= "{" "events" : "[" event ["," event]+ "]"," scriptAttribute]+ "}"
event             ::= "{" messageAttribute ["," customAttribute]+}
messageAttribute  ::= "message" ":" messageText
customAttribute   ::= attributeName ":" attributeValue
messageText       ::= <any string text>
attributeName     ::= <any valid name string allowed in system>
attributeValue ::= <any string text>Note: messageAttribute is mandatory. If a parameter in the output cannot be parsed, the corresponding log event is discarded as being invalid.
Script Output as a Single Event
{
   "events": [
                {
                   "message":"This is the message of the event",
                   "customAttribute":"This is a custom attribute"
                }
            ]
}Exit code
The import script should also include a successExitCode to indicate successful execution.
- It can be any integer value. Default value is “0” indicating successful execution.
- The output is processed only if the script completes with exit code 0. If the exit code is not specified, the output is discarded to avoid partial event processing.
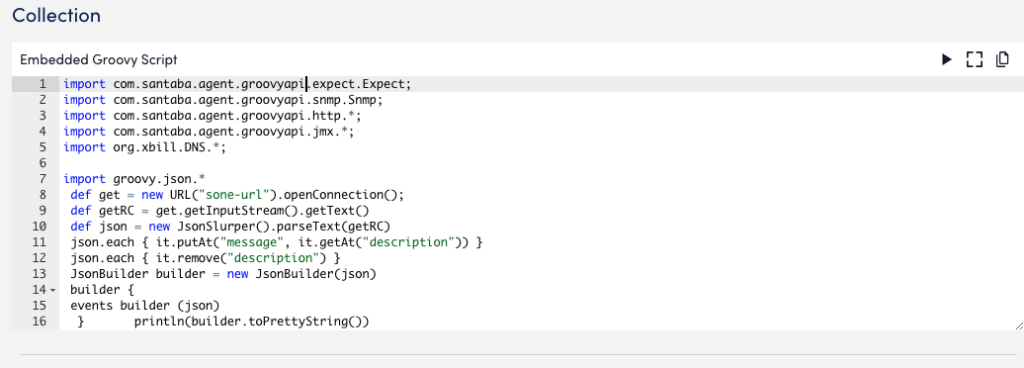
Script Output as Json(println line)
This sample script provides output as “json (println line)”, and contains the return code “0” to indicate successful execution. The script also includes the mandatory “message” attribute in the event array.
import groovy.json.*
 def get = new URL("sone-url").openConnection();
 def getRC = get.getInputStream().getText()
 def json = new JsonSlurper().parseText(getRC)
 json.each { it.putAt("message", it.getAt("description")) }
 json.each { it.remove("description") }
 JsonBuilder builder = new JsonBuilder(json)
 builder {
 events builder (json)
  }       println(builder.toPrettyString())
return 0LogSource is a LogicModule that provides templates to help you enable LM Logs and configure log data collection and forwarding. LogSource contains details about which logs to get and where to get them, and which fields should be considered for parsing. LogSource is available for common sources of log data.
Requirements
The Kubernetes Event Logging LogSource type uses the LM Collector. When using the LM Collector with LogSource, the LM Collectors installed in your infrastructure must be version EA 31.200 or later. For information on how to upgrade a collector, see Managing Collectors.
Configuration Options
The following describes configuration details specific to the Kubernetes Event Logging type of LogSource. For general information on how to add a LogSource, see Configuring a LogSource.
Include Filters
You can add filters to include resources of certain types, for example an application. The output matching the filter criteria will be forwarded to the log ingestion process.
Available Parameters
| Attributes | Comparison operator | Value example | Description |
| Message | Equal, NotEqual, Contain, NotContain, RegexMatch, RegexNotMatch. | ||
| Reason | Equal, NotEqual, Contain, NotContain, RegexMatch, RegexNotMatch. | Free text possible as list is too long. See the Kubernetes documentation for examples of event reasons. | |
| Type | Equal, NotEqual. | Normal, Warning. | Options are “Normal” and “Warning”. See the Kubernetes documentation for valid event types. A missing “Type” filter means including both “Normal” and “Warning” types. |
Log Fields
You can configure Log Fields (tags) to send additional metadata with the logs.
Available parameters
| Method | Key example | Value example | Description |
| Static | “Customer” | “Customer_XYZ” | |
| Dynamic(REGEX) | “Host” | “host=*” | The query will run on the message field. |
| LM Property(Token) | “Device” | “##system.deviceId##” | |
| Kubernetes Attribute | Type, Reason. | ||
| Dynamic Group Regex | “Scheme, Login” | “(https*):\/\/([]a-z]+)” | The query runs on the message field and captures the first group value from Regex. The keys for Dynamic Group Regex can be added as a comma separated list and values are read from same number of groups. For the Key and Value example provided in this table, the regex results in metadata for key and value, which is, Scheme and Login. For example, The URL: https://admin:[email protected]/lm/apps/agent/mfsagent:e1?status=Up Scheme: https Login: (username extracted from the message) Note: The Dynamic Group Regex method for log fields is available in EA Collector 36.100 and later versions. |
Example
Configuration example for a Kubernetes Event Logging type of LogSource.
Basic Information
- Name: Kubernetes_Events
- Description: Data collection for event logs from monitored Kubernetes clusters.
- AppliesTo (custom query): system.devicetype == “8”
- Type: LM Logs: Kubernetes Event Logging
- Group: Kubernetes
Log Fields
| Metod | Key | Value |
| Attribute | Kubernetes_Reason | Reason |
| Attribute | Event_type | Type |
LogSource is a LogicModule that provides templates to help you enable LM Logs and configure log data collection and forwarding. LogSource contains details about which logs to get and where to get them, and which fields should be considered for parsing. LogSource is available for common sources of log data.
Requirements
The Kubernetes Pods LogSource type uses the LM Collector. When using the LM Collector with LogSource, the LM Collectors installed in your infrastructure must be version EA 31.200 or later. For information on how to upgrade a collector, see Managing Collectors.
Configuration Options
The following describes configuration details specific to the Kubernetes Pods type of LogSource. For general information on how to add a LogSource, see Configuring a LogSource.
Include Filters
You can add filters to include resources of certain types, for example an application. The output matching the filter criteria will be forwarded to the log ingestion process.
Available parameters
| Attributes | Comparison operator | Value example |
| Message | Equal, NotEqual, Contain, NotContain, RegexMatch, RegexNotMatch. | Regular expression |
Log Fields
You can configure Log Fields (tags) to send additional metadata with the logs.
Available parameters
| Method | Key example | Value example | Description |
| Static | “Customer” | “Customer_XYZ” | |
| Dynamic(REGEX) | “Host” | “host=*” | The query will run on the message field. |
| LM Property(Token) | “Device” | “##system.deviceId##” | |
| Dynamic Group Regex | “Scheme, Login” | “(https*):\/\/([]a-z]+)” | The query runs on the message field and captures the first group value from Regex. The keys for Dynamic Group Regex can be added as a comma-separated list and values are read from the same number of groups. For the Key and Value example provided in this table, the regex results in metadata for key and value, which is, Scheme and Login. For example, The URL: https://admin:[email protected]/lm/apps/agent/mfsagent:e1?status=Up Scheme: https Login: (username extracted from the message) Note: The Dynamic Group Regex method for log fields is available in EA Collector 36.100 and later versions. |
Example
Configuration example for a Kubernetes Pods type of LogSource.
Basic Information
- Name: Kubernetes_Pods
- Description: Data collection for pod logs from monitored Kubernetes clusters.
- AppliesTo (custom query): system.devicetype == “8”
- Type: LM Logs: Kubernetes Pods
- Group: Kubernetes
LogSource is a LogicModule that provides templates to help you enable LM Logs and configure log data collection and forwarding. LogSource contains details about which logs to get and where to get them, and which fields should be considered for parsing. LogSource is available for common sources of log data.
Note: Starting with OpenTelemetry Collector version 5.2.0.0, LogicMonitor uses improved log-to-resource mapping to associate logs with the correct cloud resource instead of defaulting them to the Collector host. If logs are not mapped to a resource, they are classified as “deviceless”. To manually associate logs with a resource, set the LM_DEVICE_ATTRIBUTES environment variable using key-value pairs (for example, LM_DEVICE_ATTRIBUTES="key1=value1".)
Requirements
The Log Files LogSource type uses the LM OpenTelemetry Collector (LM OTEL Collector) to forward traces from your instrumented applications to the LM platform. For more information see OpenTelemetry Collector for LogicMonitor Overview.
Configuration Options
The following describes configuration details specific to the Log Files type of LogSource. For general information on how to add a LogSource, see Configuring a LogSource.
Basic Information
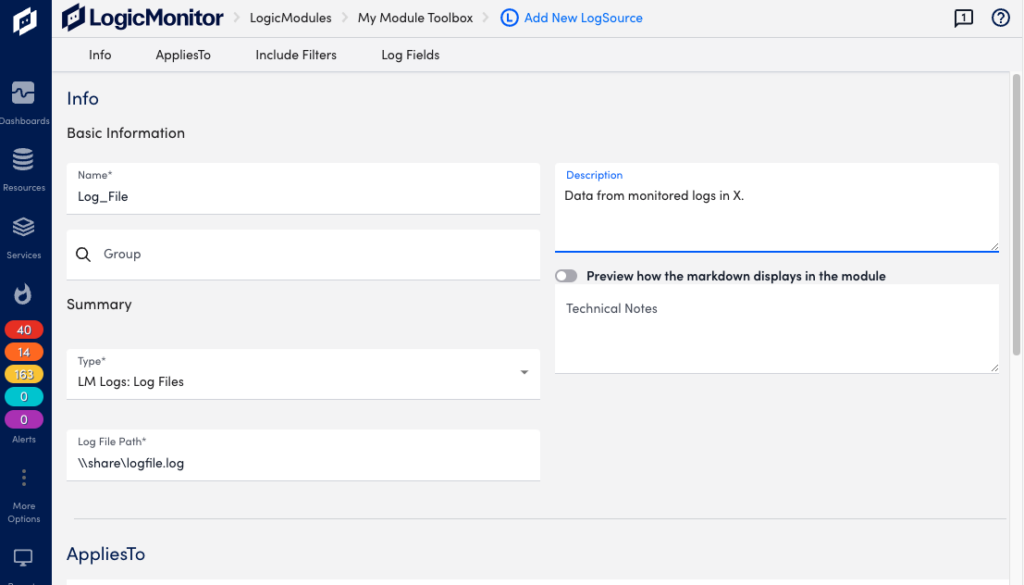
Provide the path name for the log file in XML format in the Log File Path field (required).
Include Filters
You can add filters to include resources of certain types, for example an application. The output matching the filter criteria will be forwarded to the log ingestion process.
Available parameters
| Attributes | Comparison operator | Value example |
| Message | RegexMatch, RegexNotMatch. | Regular expression |
Log Fields
You can configure Log Fields (tags) to send additional metadata with the logs.
Available parameters
| Method | Key example | Value example | Description |
| Static | “Customer” | “Customer_XYZ” | |
| Dynamic(REGEX) | “Host” | “host=*” | The query will run on the message field. |
| LM Property(Token) | “Device” | “##system.deviceId##” |
Example
Configuration example for a Log Files type of LogSource.
Basic Information
- Name: Log_File
- Description: Data from monitored logs in X.
- Type: LM Logs: Log Files
- Group: Log Files
- Log File Path: \\share\logfile.log
LogSource is a LogicModule that provides streamlined log data collection, forwarding, and parsing. It contains predefined templates that simplify the process of enabling LM Logs and configuring log ingestion. LogSource enables you specify which logs to collect, their sources, and the key fields for parsing, and includes a wide range of common log sources.
LogSource is the recommended method to collect logs because it requires fewer system resources.
The following describes configuration details specific to the Windows Event Logging type of LogSource. For general information on how to add a LogSource, see LogSource Configuration.
Exclude Filters
When configuring LogSource, you can filter log collection by using the following Exclude Filter parameters. Utilizing these parameters helps you remove unnecessary data and enhances the performance of your environment.
| Attributes | Comparison operator | Value example | Description |
| Level | Equal, MoreUrgentThan. | “Error”, “Warning”, “Information”, “Security Audit Success”, and “Security Audit Failure” | |
| LogName | Equal, In. | “System|Application|Key Management Service|Internet Explorer|Windows PowerShell” | “In” and “NotIn” can have multiple comma or pipe separated values. |
| Message | Equal, NotEqual, Contain, NotContain, RegexMatch, RegexNotMatch, Exist, NotExist. | The Value field is disabled if you select “Exist” or “NotExist”. | |
| SourceName | Equal, NotEqual, Contain, NotContain, RegexMatch, RegexNotMatch, Exist, NotExist. | The Value field is disabled if you select “Exist” or “NotExist”. | |
| EventId | Equal, In, NotIn, RegexNotMatch. | “In” and “NotIn” can have multiple comma or pipe separated values. |
Note: The Critical severity level is not supported, because LogSource only supports event types listed by Microsoft. For details, see Event Types.
Include Filters
When configuring LogSource, you can add Include Filter parameters to include certain types of resources, such as applications. The data that matches the filter criteria will be forwarded to the log ingestion process.
| Attributes | Comparison operator | Value example | Description |
| Level | Equal, MoreUrgentThan. | “Error”, “Warning”, “Information”, “Security Audit Success”, and “Security Audit Failure” | |
| LogName | Equal, In. | “System|Application|Key Management Service|Internet Explorer|Windows PowerShell” | “In” can have multiple comma or pipe separated vaues. |
| Message | Equal, NotEqual, Contain, NotContain, RegexMatch, RegexNotMatch, Exist, NotExist. | The Value field is disabled if you select “Exist” or “NotExist”. | |
| SourceName | Equal, NotEqual, Contain, NotContain, RegexMatch, RegexNotMatch, Exist, NotExist. | The Value field is disabled if you select “Exist” or “NotExist”. | |
| EventId | Equal, In, NotIn, RegexNotMatch. | “In” and “NotIn” can have multiple comma or pipe separated values. |
Note: The Critical severity level is not supported, because LogSource only supports event types listed by Microsoft. For details, see Event Types.
Log Fields
You can configure Log Fields (tags) to send additional metadata with the logs.
| Method | Key example | Value example | Description |
| Static | “Customer” | “Customer_XYZ” | |
| Dynamic(REGEX) | “Host” | “host=*” | The query will run on the message field. |
| LM Property(Token) | “Device” | “##system.deviceId##” | The DeviceID extracted from the existing device property in LogicMonitor. |
| Windows Event Attribute | Event ID, LEVEL, LOG NAME, SOURCE NAME. | ||
| Dynamic Group Regex | “Scheme, Login” | “(https*):\/\/([]a-z]+)” | The query runs on the message field and captures the first group value from the regex. The keys for Dynamic Group Regex can be added as a comma separated list and values are read from same number of groups. For the key and value example provided in this table, the regex results in metadata for key and value, which is, Scheme and Login. For example, The URL: https://admin:[email protected]/lm/apps/agent/mfsagent:e1?status=Up Scheme: httpsLogin: admin (username extracted from the message)Note: The Dynamic Group Regex method for log fields is available in EA Collector 36.100 and later versions. |
Resource Mappings
When configuring LogSource, you can configure the resource mappings to match LM log properties with the relevant monitored resources to ensure accurate data collection. Use these mappings to reduce manual setup and apply consistent labels and fields to logs.
| Method | Key example | Value example | Description |
| Static | “Customer_Id” | “1234” | Text field, any value. |
| Dynamic(Regex) | “system.ServiceName” | “service=*” | The query will run on the message field. |
| LM Property(Token) | “##system.deviceId##” | The DeviceID extracted from the existing device property in LogicMonitor. |
Note: The Key and Value parameters are mandatory items.
Requirements for Configuring the Windows Event Logging LogSource
To configure LogSource for Windows Event Logging, you need the following:
- LM Collector — Windows Event Logs use the LM Collector. For details, see About the LogicMonitor Collector.
- Define Windows Event Channels — To use LogSource, you must define Windows Event Channels to help categorize logs based on their source.
Configuring a Windows Event Logging LogSource
- In the LogicMonitor navigation menu, select Modules.
- Add a new LogSource, or edit an existing one, in My Module Toolbox. For more information, see Custom Module Creation and Modules Management.
- In the Info tab, do the following:
- In the Name field, enter “Windows_Events”.
- In the Description field, enter the following: “Data collection for Windows Events logs from monitored Windows resources.”
- In the Type field, select LM Logs: Windows Event Logging.
- In the Group field, select Windows Event Logs.
- Select the AppliesTo tab and enter the appropriate AppliesTo formula for applying to relevant devices.
For example, system.deviceId == “13581” || system.deviceId == “1894” - Select the IncludeFilters tab.
- Select Add Filters and add the following attribute:
| Attribute | Comparison operator | Value |
| LogName | In | System|Application |
Recommendation: Exclude the Security Audit Success log level, as it generates a high volume of data with minimal value for troubleshooting.
- Select the Log Fields tab.
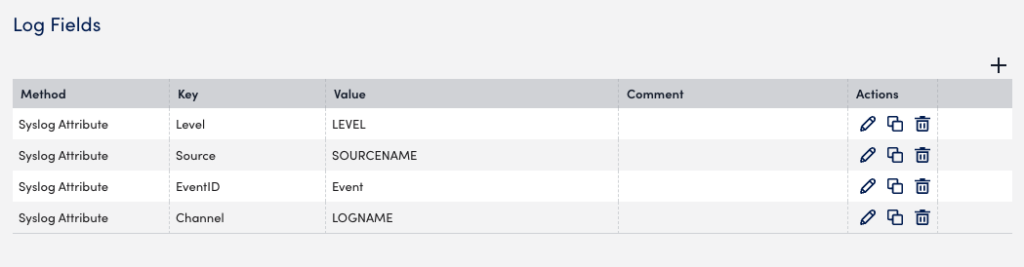
- Select Add Log Fields and ensure that the following methods are auto-filled:
| Method | Key | Value |
| Attribute | Level | Level |
| Attribute | Source | SourceName |
| Attribute | EventID | EventId |
| Attribute | Channel | LogName |
- Select the Resource Mappings tab.
- Select Add Resource Mappings and add the following method:
| Method | Key | Value |
| Token | system.deviceId | ##system.deviceId## |
- Select Save.
Recommendation: LogSource is the recommended method for ingesting syslog logs. For more information, see LogSource Overview.
You can ingest syslog logs using LogSource, a LogicModule that enables you to configure which syslog logs are ingested into LM Logs and how they are mapped to resources. You can configure a Syslog LogSource to apply to the Collector itself for broad control over syslog handling, or to individual resources for more specific control.
Every LM Collector includes a pre-configured default LogSource for syslog ingestion. This LogSource is the best out-of-the-box solution for ingesting syslogs because of its simple setup, searchable log views and alerts, ease of filtering, and no required licensing or agents from additional sources.
Collector Syslog Processing
While applying LogSource on a collector, the collector can process Syslog in the following ways:
- If the requirement is to ingest the Syslog events received by the collector, Collector’s agent.conf property “lmlogs.syslog.enabled” can be enabled. This property can also be enabled by turning on Enable log collection for Syslog and SNMP trap option on the Add collector page. With this property enabled, the collector will ingest all the Syslog events without any customization such as Filters, Resource Mapping, and others.
- If the requirement is to add some customisation such as filtering some Syslog events or adding a different method for resource mapping, a LogSource can be created and applied on the Syslog receiving collector using the Apply to Collector(s) option on the LogSource.
- If the requirement is to handle the Syslog events from a device using a specific LogSource definition, a usual LogSource can be applied on a device that is forwarding the Syslog events to the collector.
A usual LogSource that is applied on a device, will be preferred over the LogSource applied on a collector for processing the syslog.
A LogSource that is applied on a collector, will be preferred over collector’s agent.conf property “lmlogs.syslog.enabled” for processing the syslog.
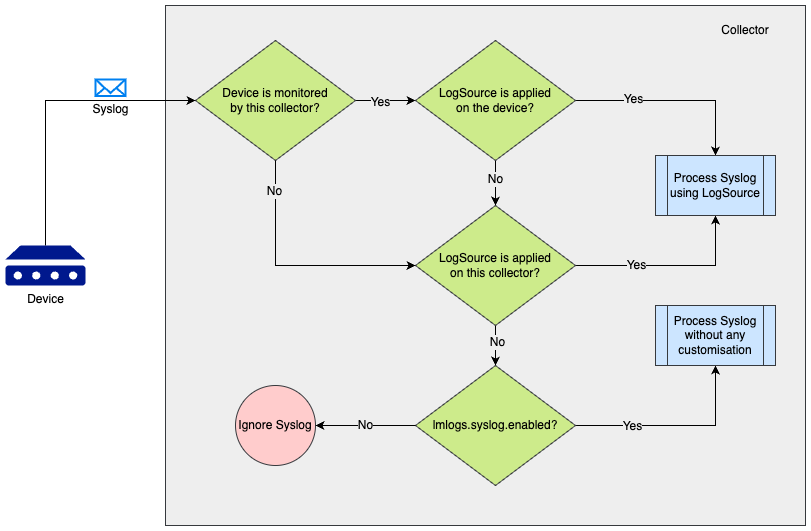
The following scenarios can be referred to understand the syslog processing preference by a collector which is receiving the syslog.
| Scenario | Is the device monitored by the collector* | Is a usual LogSource applied on the device | Is a LogSource applied on collector using the Apply to Collector(s) switch | Is collector’s agent.conf property lmlogs.syslog.enabled set to true | Outcome |
| 1 | Yes | Yes | Any (Yes/No) | Any (Yes/No) | Syslog will be processed using the usual LogSource applied on the device that forwards the Syslog. |
| 2 | Yes | No | Yes | Any (Yes/No) | Syslog will be processed using the LogSource which is applied to the collector that receives the Syslog. |
| 3 | No | Any (Yes/No) | Yes | Any (Yes/No) | Syslog will be processed using the LogSource which is applied to the collector that receives the Syslog. |
| 4 | No | Any (Yes/No) | No | Yes | Syslog will be processed using the agent.conf property (“lmlogs.syslog.enabled”) of the collector that receives the Syslog. |
*A device is said to be monitored by a collector if
- The collector is assigned as a Preferred Collector on Manage Resource page
-or- - The collector is assigned as Log Collector using Set LM Logs Collector option on Manage Resource page
For more information about applying a Collector to a LogSource to process Syslog logs, see Applying LogSource to Collectors.
Include Filters
You can add filters to include resources of certain types, such as an application. The output matching the filter criteria will be forwarded to the log ingestion process.
The following table details the available parameters:
| Attributes | Comparison operator | Value example | Description |
| Application | Equal, NotEqual, Contain, NotContain, Exist, NotExist, RegexMatch, RegexNotMatch. | nginx, apache | Used to filter syslog messages based on the application name that generated them. This filter relies on the presence of application metadata (for example, APP-NAME in syslog messages). Ensure that your syslog source includes this information, as it may not always be present depending on the syslog version or source configuration. |
| Facility | Equal, NotEqual, Contain, NotContain, RegexMatch, RegexNotMatch, Exist, NotExist, GreaterThan, GreaterEqual, LessThan, LessEqual. | Predefined options like “kernel messages”, “system daemons”, and “log alert” | A categorization tag used to specify the type or source of the system process generating the log message. |
| Message | Equal, NotEqual, Contain, NotContain, RegexMatch, RegexNotMatch, Exist, NotExist. | “Failed alert” | Include or exclude syslog logs based on the content of their messages. |
| Severity | Equal, MoreUrgentThan. | Emergency, Alert, Critical, Warning, Notice, Informational, Debug | Indicates the importance of the event, with levels ranging from 0 (Emergency) to 7 (Debug), as defined by the syslog protocol. |
Log Fields
You can configure Log Fields (tags) to send additional metadata with the logs. The following table details the available parameters:
| Method | Key example | Value example | Description |
| Static | “Customer” | “Customer_XYZ” | Attaches a fixed key-value pair to every log processed by the log source, ensuring consistent metadata tagging across all log entries. |
| Dynamic(REGEX) | “Host” | “host=*” | The query will run on the message field. |
| LM Property(Token) | “Device” | “##system.deviceId##” | The DeviceID value extracted from the existing device property in LogicMonitor. |
| Syslog Attribute | “Application, Facility, Log_Level” | Application, Facility, Severity. | Directly maps a specific syslog metadata field to a log field in LM Logs. |
| Dynamic Group Regex | “Scheme, Login” | “(https*):\/\/([]a-z]+)” | The query runs on the message field and captures the first group value from Regex. The keys for Dynamic Group Regex can be added as a comma separated list and values are read from same number of groups. For the Key and Value example provided in this table, the regex results in metadata for key and value, which is, Scheme and Login. For example: Scheme=https Login=<Actual username extracted from the message> Note: The Dynamic Group Regex method for log fields is available from the LM collector version 34.200 and later. |
Resource Mappings
Configure the LM log property to match a monitored resource. The following table details the available parameters:
| Method | Key example | Value example | Description |
| Static | “Customer_Id” | “1921” | Maps log messages to a specific monitored resource by matching a predetermined key-value pair corresponding to a resource property. |
| IP | “system.ips” | “10.20.30.40” | Use the syslog host field information and resolve it to IP (For example “10.20.30.40”). The Value field is disabled if you select this method, you can only enter a Key. |
| FQDN | “system.hostname” | “application.service.example.com” | Fully Qualified Domain Name, from DNS resolution of hostname received from syslog message or socket address. |
| HOSTNAME | “system.hostname” | “host1.example.com” | The Value field is disabled if you select this method, you can only enter a Key. |
| HOST WITHOUT DNS | “system.hostname” | “host1” | The Value field is disabled if you select this method, you can only enter a Key. |
| Dynamic(REGEX) | “system.ServiceName” | “service=*” | The query will run on the message field. |
| LM Property(Token) | “token.resourceMap” | “syslog_test_collector” | The DeviceID extracted from the existing device property in LogicMonitor. |
| Dynamic Group Regex | “Scheme, Login” | “(https*):\/\/([]a-z]+)” | The query runs on the message field and captures the first group value from Regex. The keys for Dynamic Group Regex can be added as a comma separated list and values are read from same number of groups. For the Key and Value example provided in this table, the regex results in metadata for key and value, which is, Scheme and Login. For example: Scheme=https Login=<Actual username extracted from the message> Note: The Dynamic Regex Group method for resource mapping is available from the LM collector version 35.200 and later. |
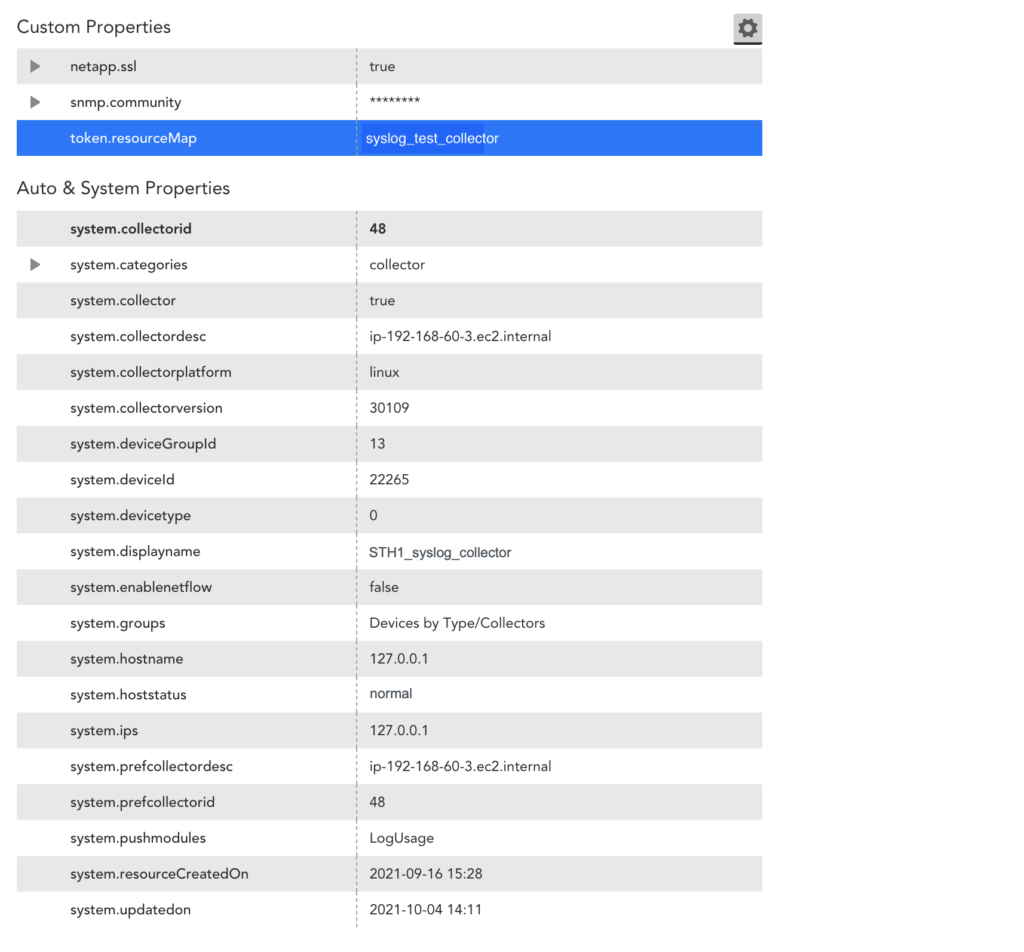
The following is an example of a resource mapping using the LM Property (Token) method. In this example, you provide a property to map to one of the monitored devices in the LM portal. The key for the LM Property is token.resourceMap and the value is syslog_test_collector.
When a LogSource is applied on the device, the resource mapping is processed with LM_property as token.resourceMap, the source as LM Property, the parse method as Token, and the value as any item starting with ##, such as ##token.resourceMap##.
The collector receives the hostEntry from the feed, and replaces the ##token.resourceMap## with the value received against the LM_property token.resourceMap for that particular host (for example, syslog_test_collector).
If there are multiple resources to which the log source is applied, the value for LM_property should be unique. Otherwise the Ingest API will not map it to the resource.
The following image is from the Resources information for the syslog_test_collector example.
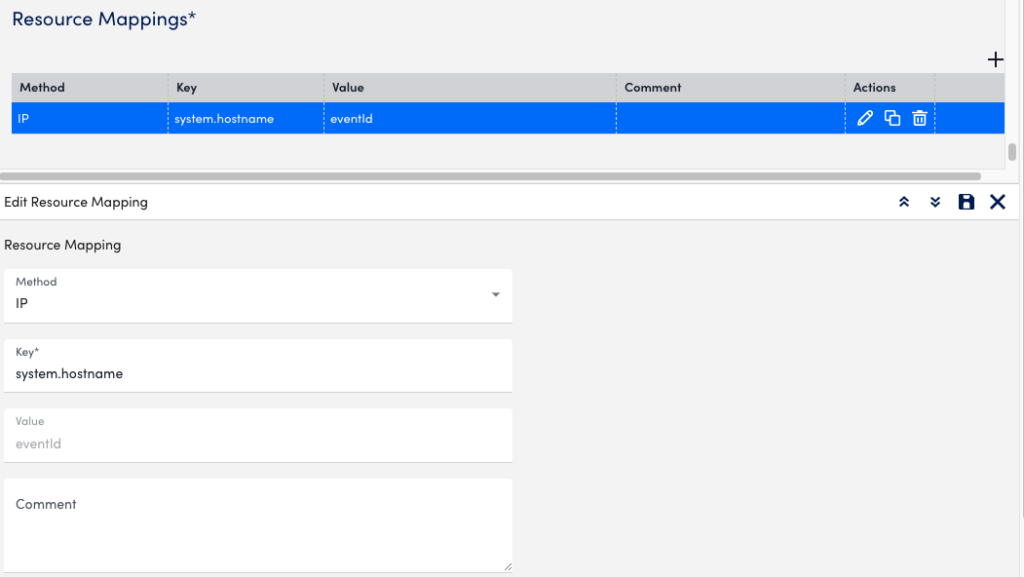
The following image is from the resource mapping in LogSource for the syslog_test_collector example.
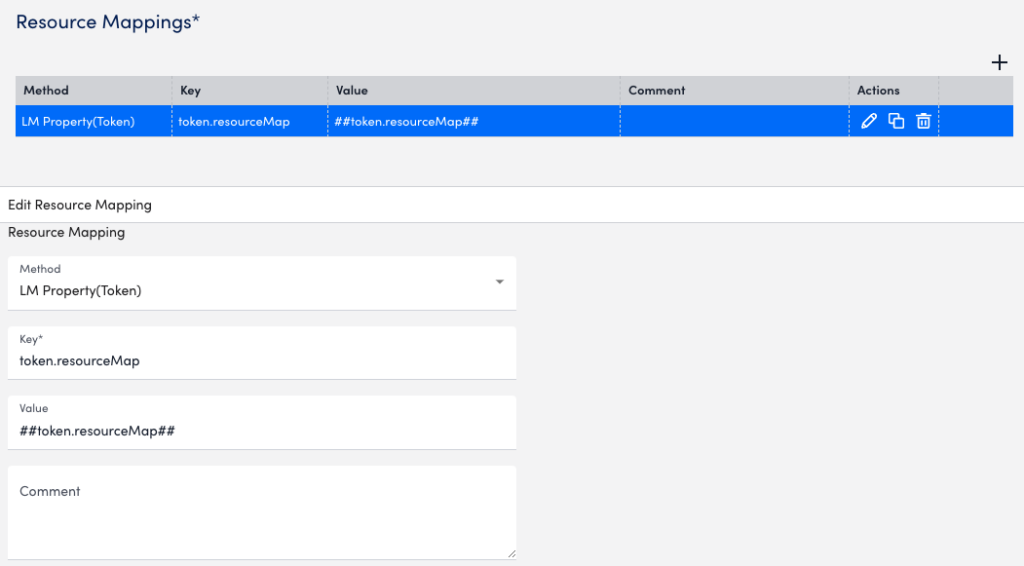
The resource mapping on the Collector side for this LogSource is as follows:
'{"metadata":{"logSource_id":"2249","logsource_name":"syslog_test_token"},"Severity":"3: Error","Host":"localhost","epochWhenAddedInQueue":1633501246808,"Facility":"1: user-level messages","message":"<11>Just a message with metadata test_md1 !!\u0000","_lm.resourceId":{"token.resourceMap":"syslog_test_collector"},"timestamp":1633501246808,"_lm.collectorId":"48"}', raw:'<11>Example message with metadata test_md1 !!'Requirements for Configuring a Syslog LogSource
You must have an LM Collector installed on the machine ingesting syslog logs. For more information, see About the LogicMonitor Collector.
Configuring a Syslog LogSource
- In LogicMonitor, navigate to Modules > My Module Toolbox.
- Select
 .
. - In the Add modal, select LogSource.
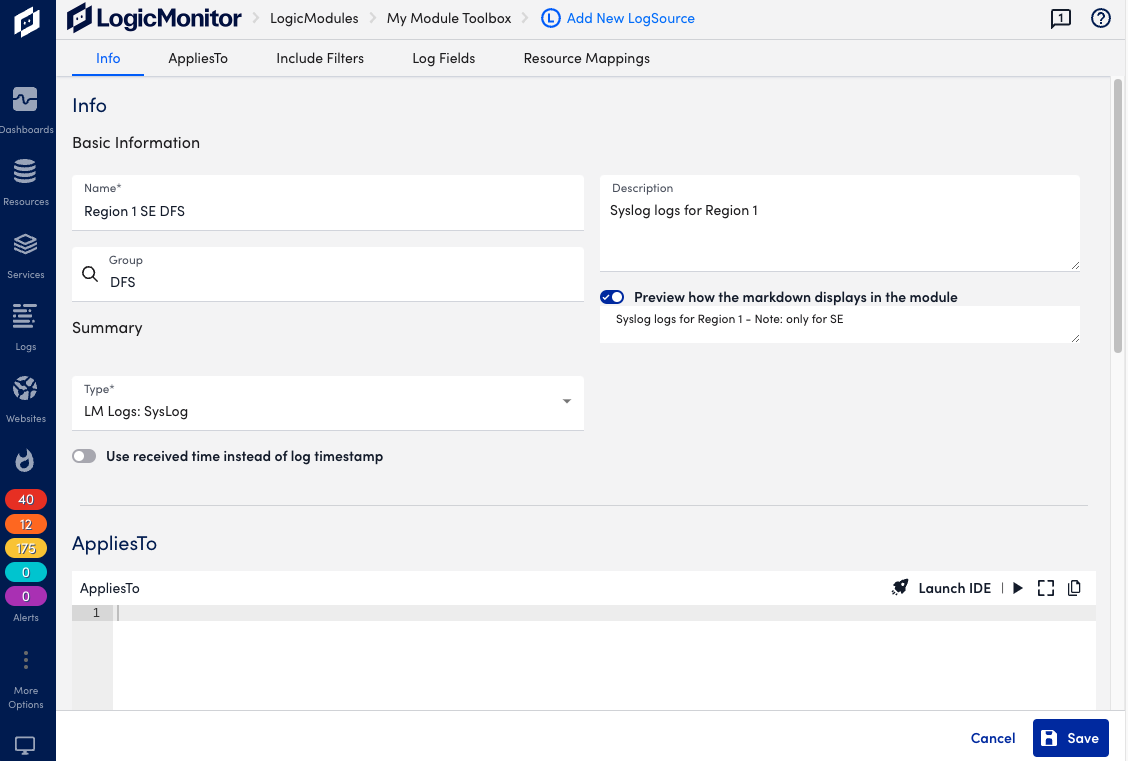
- In the Name field, enter a descriptive and unique name for the source of the syslog logs.
- In the Description field, enter a description of the source of the syslog logs. The description can provide additional context to help you and other users understand the purpose, function, or configuration details of the log source.
- In the Tags field, search for tags (also referred to as log fields) you want to assign to your log source.
Note: Tags are metadata fields used for filtering, grouping, and automation. For more information about tags, see the Log Fields table above. - In the Group field, select one or more groups that best categorize the log source. Groups typically reflect the function, location, or environment of the log origin.
- Use the Technical Notes field to provide detailed reference information that may assist with troubleshooting or maintenance.
- Toggle the Show preview of rendered technical notes switch to view how markdown-formatted content displays when rendered.
- Set the Type dropdown menu to LM Logs: SysLog.
- Toggle the Use received time instead of logstamp switch to use timestamps based on when LogicMonitor receives the syslog messages, rather than the timestamp embedded in the syslog message.
- Add Access Groups to enable who can view, manage, and interact with the logs.
- In the AppliesTo field, define which resources this LogSource should apply to. For example, you can apply the LogSource only to devices in a specified group, tag, or Collector, as seen below:
isInDeviceGroup("Network Devices") *Applies the logsource only to devices in the "Network Devices" group. system.env == "prod" *Applies to devices tagged with env:prod. collectorId == 27 *Applies only to devices using a specific Collector. - Add Filters using the available parameters listed above.
- Review the default Log Fields and edit as needed:

- Review the default Resource Mappings and edit as needed:

- Select Save.
Apply LogSource to Collectors
With collector version EA-35.200, you can apply LogSource to a collector directly using the Apply to Collector(s) option. The AppliesTo option is also available to apply LogSource to a device. But, if you are using a collector version prior to EA-35.200, you can only use AppliesTo to apply LogSource to a device.
Applying a LogSource to the collector is useful in the following scenarios:
- The device that is forwarding the Syslog to the collector is not monitored by the collector.
- The device that is forwarding the Syslog to the collector is not monitored in LogicMonitor at all.
To apply LogSource to collector:
- While creating a LogSource, on the AppliesTo tab, toggle Apply to Collector(s) switch.
- Under Collector Mappings, select Add Collector.
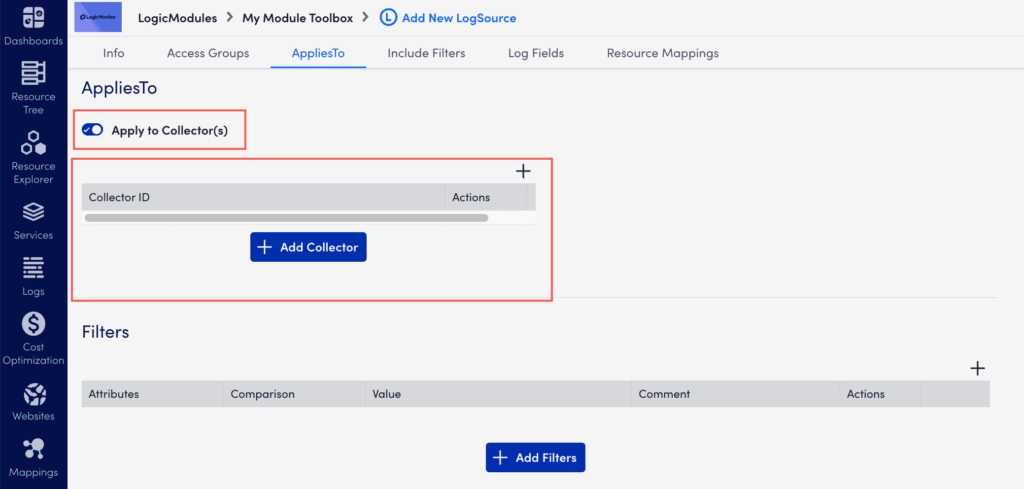
Note:
- When you select Apply to Collector(s) toggle, the AppliesTo field becomes unavailable. It is not possible to use both the options together.
- Only the self-monitoring collectors with a minimum version as EA-35.200 appear in the Collector Mapping field.
- Only one LogSource of type Syslog can be applied on a self-monitoring collector.
- If a device is monitored by a collector that is receiving the Syslog, then the LogSource that is applied on the device is preferred over the LogSource applied on the collector. To know more about it, refer Syslog Processing Preference.
LogSource is an LM LogicModule that provides templates to enable logs and configure the sending of log data for ingestion by LM Logs. LogSource helps you configure details about what logs to get, where to get them, and which fields should be considered for parsing.
Note: The following describes general steps to add and configure a LogSource. For information about configuration parameters for a specific type of LogSource, see configuration information for each type. For more information about the LogSource concept, see LogSource Overview.
Requirements
- When using the LM Collector with a LogSource, the LM Collectors installed in your infrastructure must be version EA 31.200 or later. For information on how to upgrade a collector, see Managing Collectors.
- To access the resource mapping prioritisation feature, you must have EA Collector 36.400 or later installed on your machine.
Step 1. Adding the LogSource
Do the following to add a new LogSource:
- In the LogicMonitor navigation menu, select Modules.
- From My Module Toolbox, select Add
 .
. - In the Add window, select LogSource. The Add New LogSource window displays.
- Continue by configuring the LogSource as described in the following steps.
Note: Depending on the type of LogSource selected in the next step, you will see different sections for entering information. For example Exclude filters, Include Filters, Log Fields, and so on. The tabs at the top provide quick access to the different sections.
Step 2. Configuring the LogSource
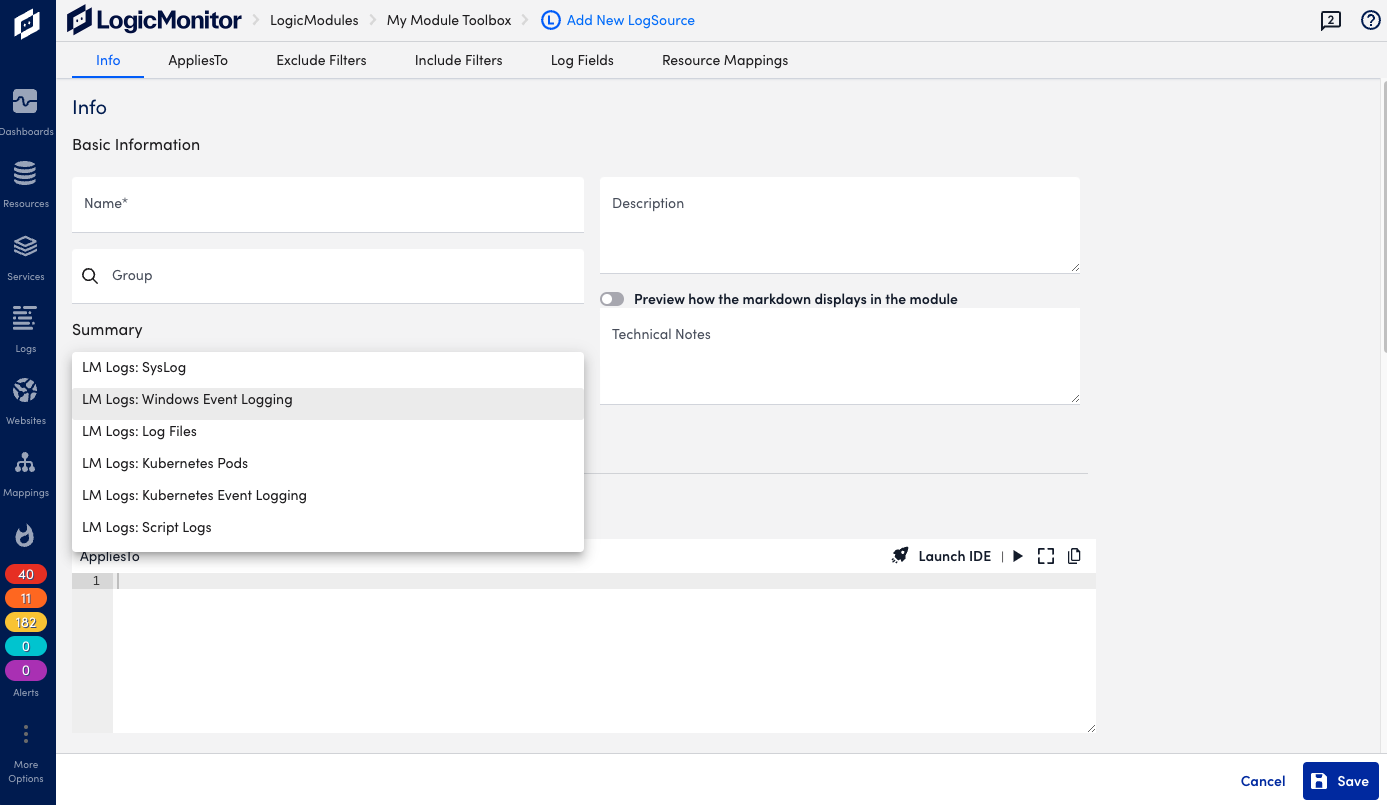
Basic Information
Provide general information about the LogSource, and select a type for it depending on the origin of the log data.
In the Info section, do the following:
- Name (required)—Add a descriptive name, this will be displayed in the list of logsources.
- Description and Technical Notes—Optional information about the LogSource.
- Group—The group under which the LogSource should be present. Select a LogSource group or create a new one. If no group is specified, the LogSource will be placed in “@ungrouped”.
- Preview how the markdown displays in the module—Toggle this to see how the information in technical notes will appear.
- Type (required)— Select the type of resource that the LogSource is applied to and continue the configuration of the rest of the applicable sections as described in the following.
AppliesTo
Configure the resources that will use the LogSource.
In the AppliesTo section, do the following:
- Enter the resources to which the LogSource is applied.
- Optionally, select Launch IDE for guidance through the resource selection. Select Done to save the configuration.
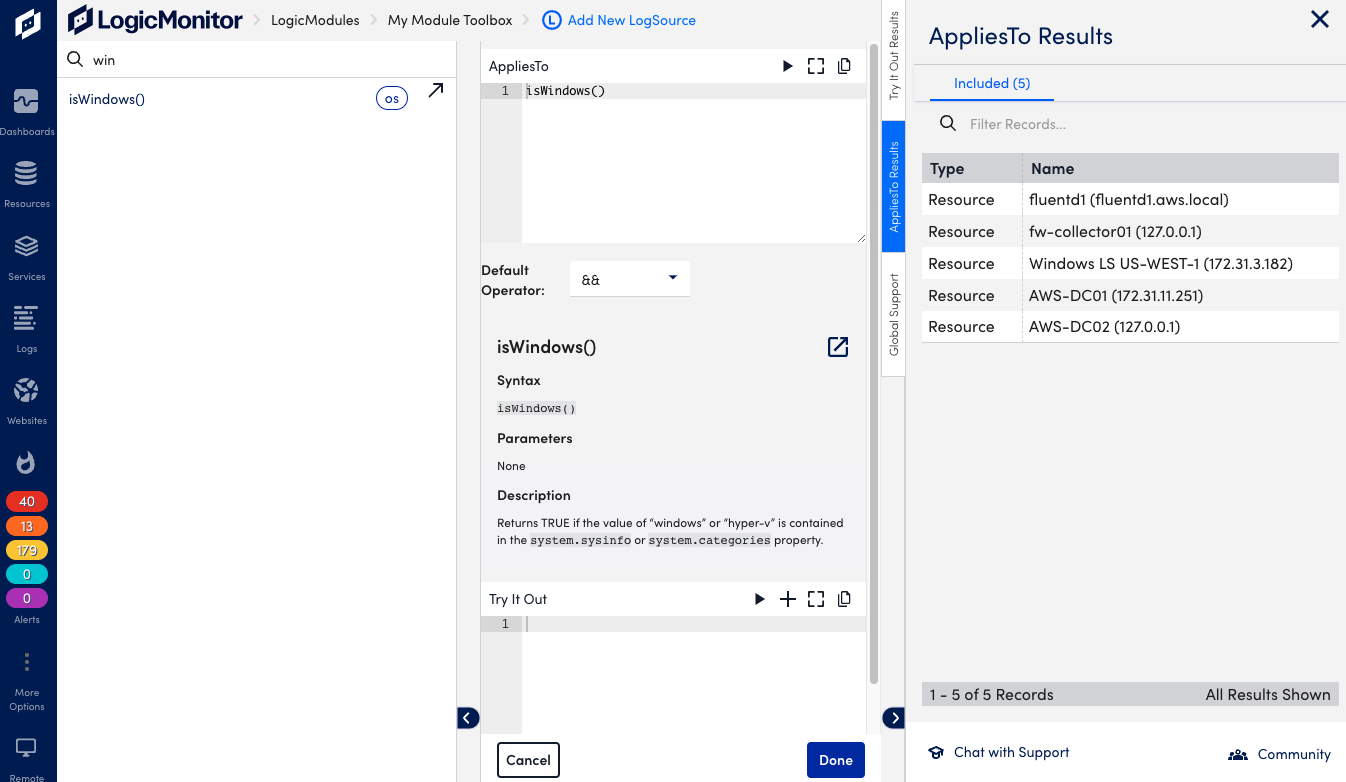
- Optionally, select the Test AppliesTo icon to test the resource selection, and refine the criteria as needed.
Exclude and Include Filters
Optionally, you can add filters to exclude or include events. If you add filters, events must meet the filter criteria in order to be detected and alerted on. Available filtering options depend on the selected LogSource type. If no filter is provided all log events will be included by default. If you add multiple filters they will be added (AND condition).
In the Exclude and Include Filters sections, do the following:
- Select Add Exlude Filter, or Add Include Filter.
- For Attribute, add the type of item to filter on, options depend on type of LogSource. Example: “Level” for a Windows Event Logging type of LogSource.
- Select a Comparison Operator, for example “Equal” or “RegexMatch”, depending on type of attribute.
- Add a Value, depends on attribute and comparison operator, for example “Warning”.
- Add an optional Comment.
- Select the Save icon to add the filter.
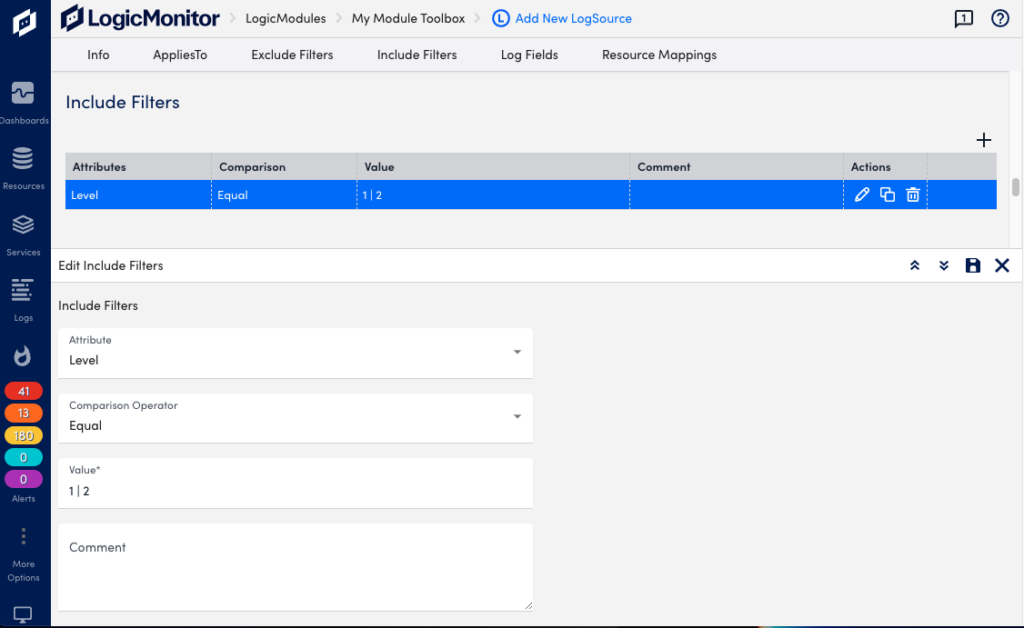
When defining the severity level to be included for incoming log messages, you can include multiple levels specified with a pipe separator. You can also use level numbers such as 1 for error, 2 for warning, and 3 for information.
Example: If you want to only include log messages for errors and warnings, you can set the filter with the attribute “Level”, comparison operator “In”, and value “1 | 2”.
As you’re defining filters, you can select Test AppliesTo to perform test runs to ensure events are filtered and captured as you intended. You can also use the testing capability before any filters are defined in order to return all messages from a device, and use this information to refine parameter values.
Log Fields
Optionally, you can configure Log Fields (tags) to include additional metadata to be sent with the logs. You can also add LogicMonitor resource properties as log metadata.
In the Log Fields section, do the following:
- Select Add Log Fields.
- For Method, add the method for collecting the metadata, options depend on type of LogSource. Example: “Windows Event Attribute” for a Windows Event Logging type of LogSource.
- Enter a Key, for example “Source”.
- Add a Value, for example “Source Name”.
- Add an optional Comment.
- Select the Save icon to add the log field.
Example: Log Fields configured for metadata.
Resource Mappings
This is required for some LogSource types and provides information about which resource the logs should map to. The settings define the resource properties to use for the collector device mapping. For more information see agent.conf Collector Settings.
You can identify and map resources using an OR operator instead of an AND operator using a single setting in your portal. For example, the system identifies the resource based on the first key, in this case, the system.hostname for the IP method. If there is no resource matching the IP method, the resource are identified using the second key system.hostname for the Hostname method, and so on.
To identify and map resources using the OR operator, toggle the Use OR instead of AND switch.
This setting is enabled by default.
If the switch is disabled, all resources are identified and mapped using the AND operator.
When enabled, you can use the Drag to Reorder column to reorder the sequence of the resource mappings based on your preference to identify the resources.
When the Syslog and SNMP Traps are processed through the agent.conf settings (that is, when lmlogs.syslog.enabled=true and lmlogs.snmptrap.enabled=true in the agent.conf settings), the resource attributes are added to ingested Syslog and SNMP traps based on the following default resource mappings sequence with the OR operator. The pre-populated default resource mappings are displayed on the LogSource creation page only for the Syslog and SNMP traps type of LogSources.
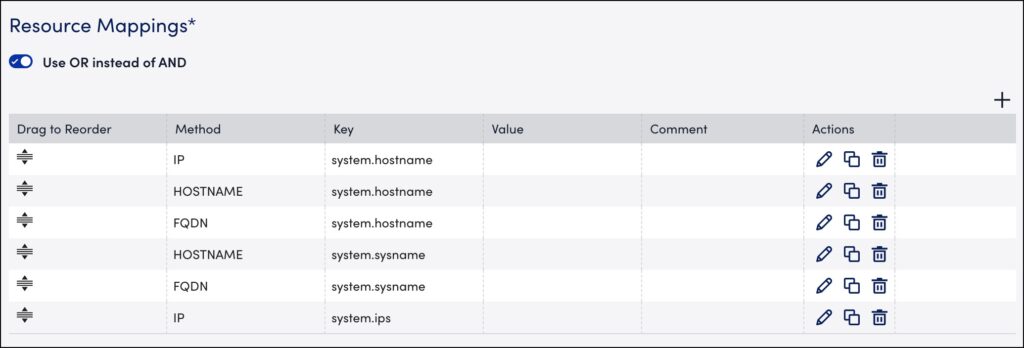
The Resource Mappings settings consider duplicate keys when identifying resources regardless of the method. For example, the system identifies the resource based on the first key (using system.hostname for the IP method), and if no resource matches the key and method, the system identifies the resource using the second, duplicate key (using system.hostname for the Hostname method). Identification continues in this manner until all the resources are matched using the key and method specified in the table.
Note: The resource mapping prioritisation is applicable for all types of LogSources wherever resource mapping is available on the LogSource creation page of the LogicMonitor portal.
In the Resource Mappings section, do the following:
- Select Add Resource Mappings.
- For Method, add the mapping method, for example “IP”.
- Add a mapping Key, for example “system.hostname”.
- Add a Value, depending on selected method.
- Add an optional Comment.
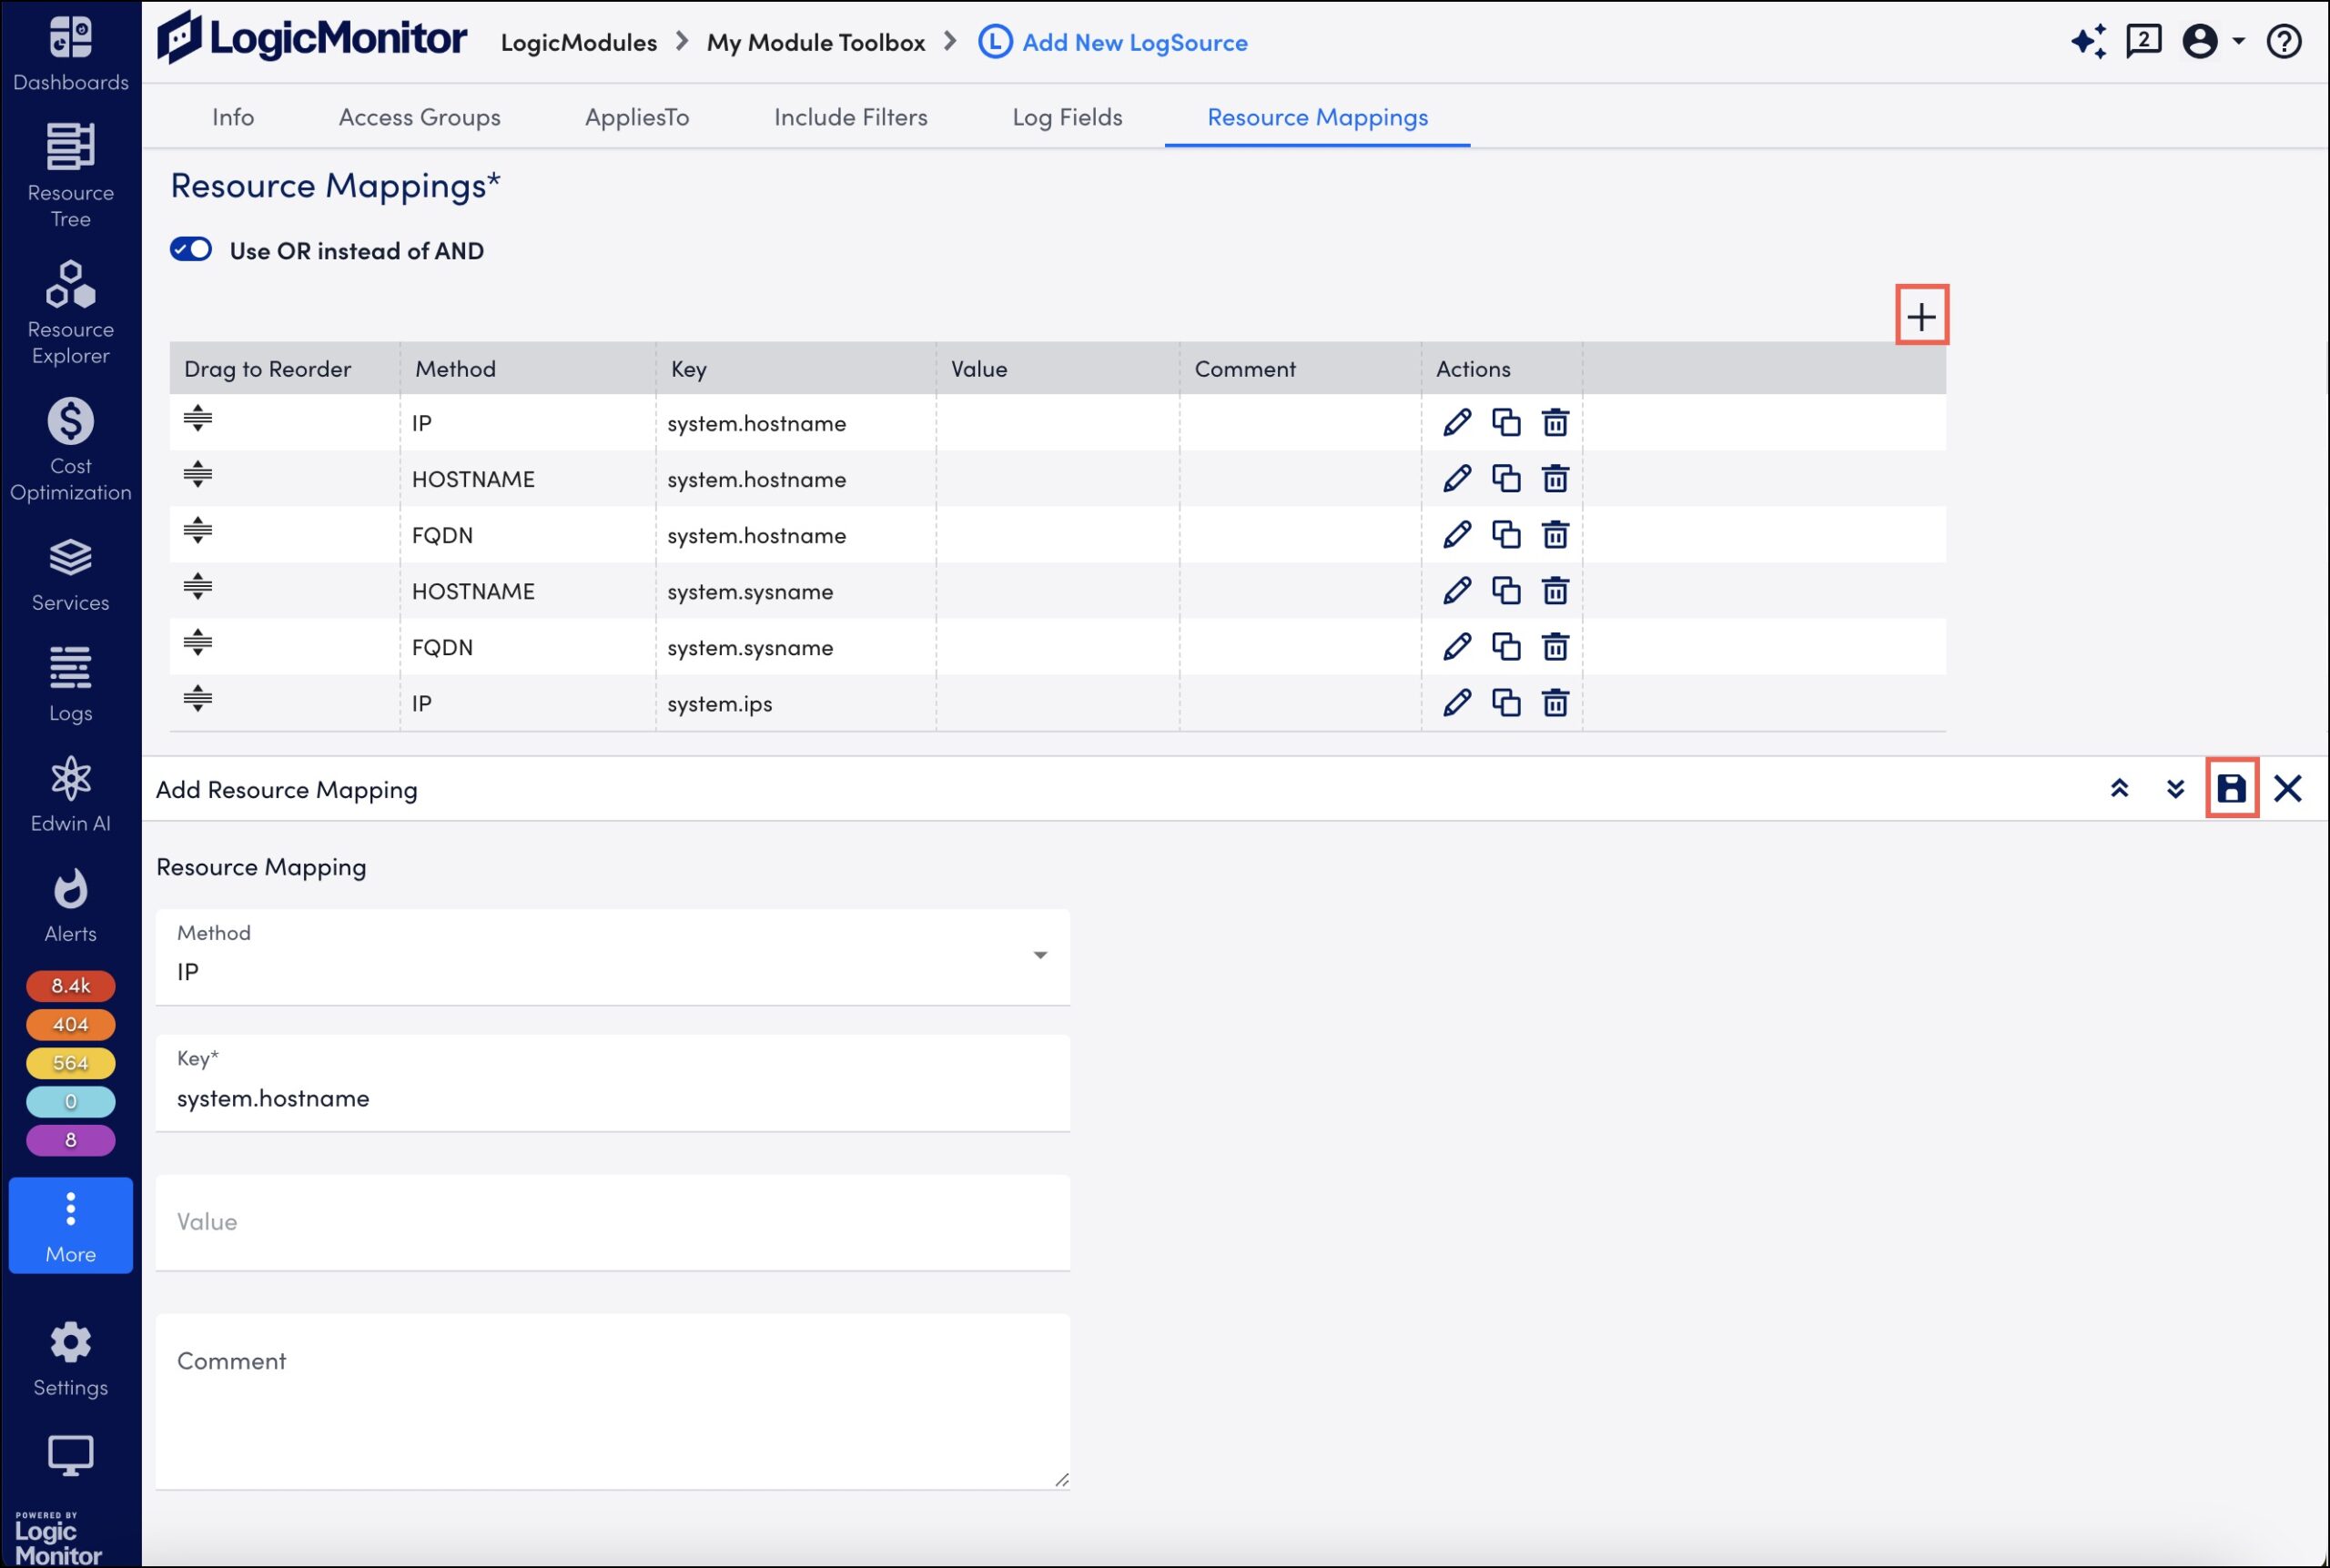
- Select Save. The resource mapping is added to the table.
- Toggle the Use OR instead of AND switch. The Drag to Reorder column is displayed.
- Drag to reorder the sequence of the resource mappings based on your preference to identify the resources.
Example: Resource mapping in the following is equivalent of this collector configuration:
lmlogs.syslog.hostname.format=IPlmlogs.syslog.property.name=system.hostname
Note: With Portal version 187 and later, LogSource supports only RE2 compatible regex patterns which are stored in Filter/LogFieldTag/ResourceMapping section. Same validation is applied while updating an existing LogSource.
EA Collector 34.100 and later versions support processing of LogSources using RE2J. Collector supports backward compatibility for existing LogSources that have Java compatible valid regex pattern but which are not compatible with RE2.
Enabling the LogSource
When done adding information in the different sections, select Save to enable the LogSource (or update an existing one).
Step 3. Enabling Preferred Collectors
Note: This step is only needed if logs are sent to a different collector than the one monitoring the resource. If logs are sent to the same monitoring, you don’t need to configure a preferred logs collector.
The following describes how to define a Logs Collector Group and Preferred Logs Collector for each resource or resource group.
Warning: LogSource configurations supercedes collector configurations. For example, say you are sending logs to a Collector A resource using the traditional log collection method. Then you configure a new LogSource that applies to that resource. In this case the LogSource configuration is applied, which could cause potential resource mapping conflicts.
Enabling on a Resource
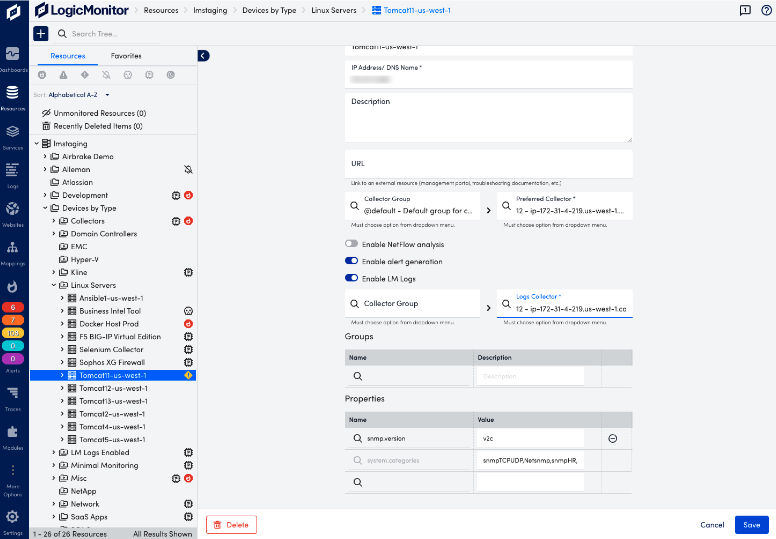
- Navigate to Resources and select the desired resource.
- For each resource, select the Manage Properties icon to open the Manage Resource view.
- Toggle Enable LM Logs to on.
- Select the desired Collector Group (optional) and the preferred Log Collector (required) from the drop-down, type in field to see available options.
- Select Save.
- Repeat the procedure for each resource you for which want to enable logs collection.
Enabling on a Resource Group
Note: Preferred logs collector configurations are not saved at Resource Group level. This means that if new resources are added to the group after the initial configuration, you must reapply the preferred collector to the resource group, or manually configure this for the new resource itself.
- In LogicMonitor, navigate to Resources and select the desired static resource group.
- Select the Logs tab and then select Set Preferred Logs Collector.
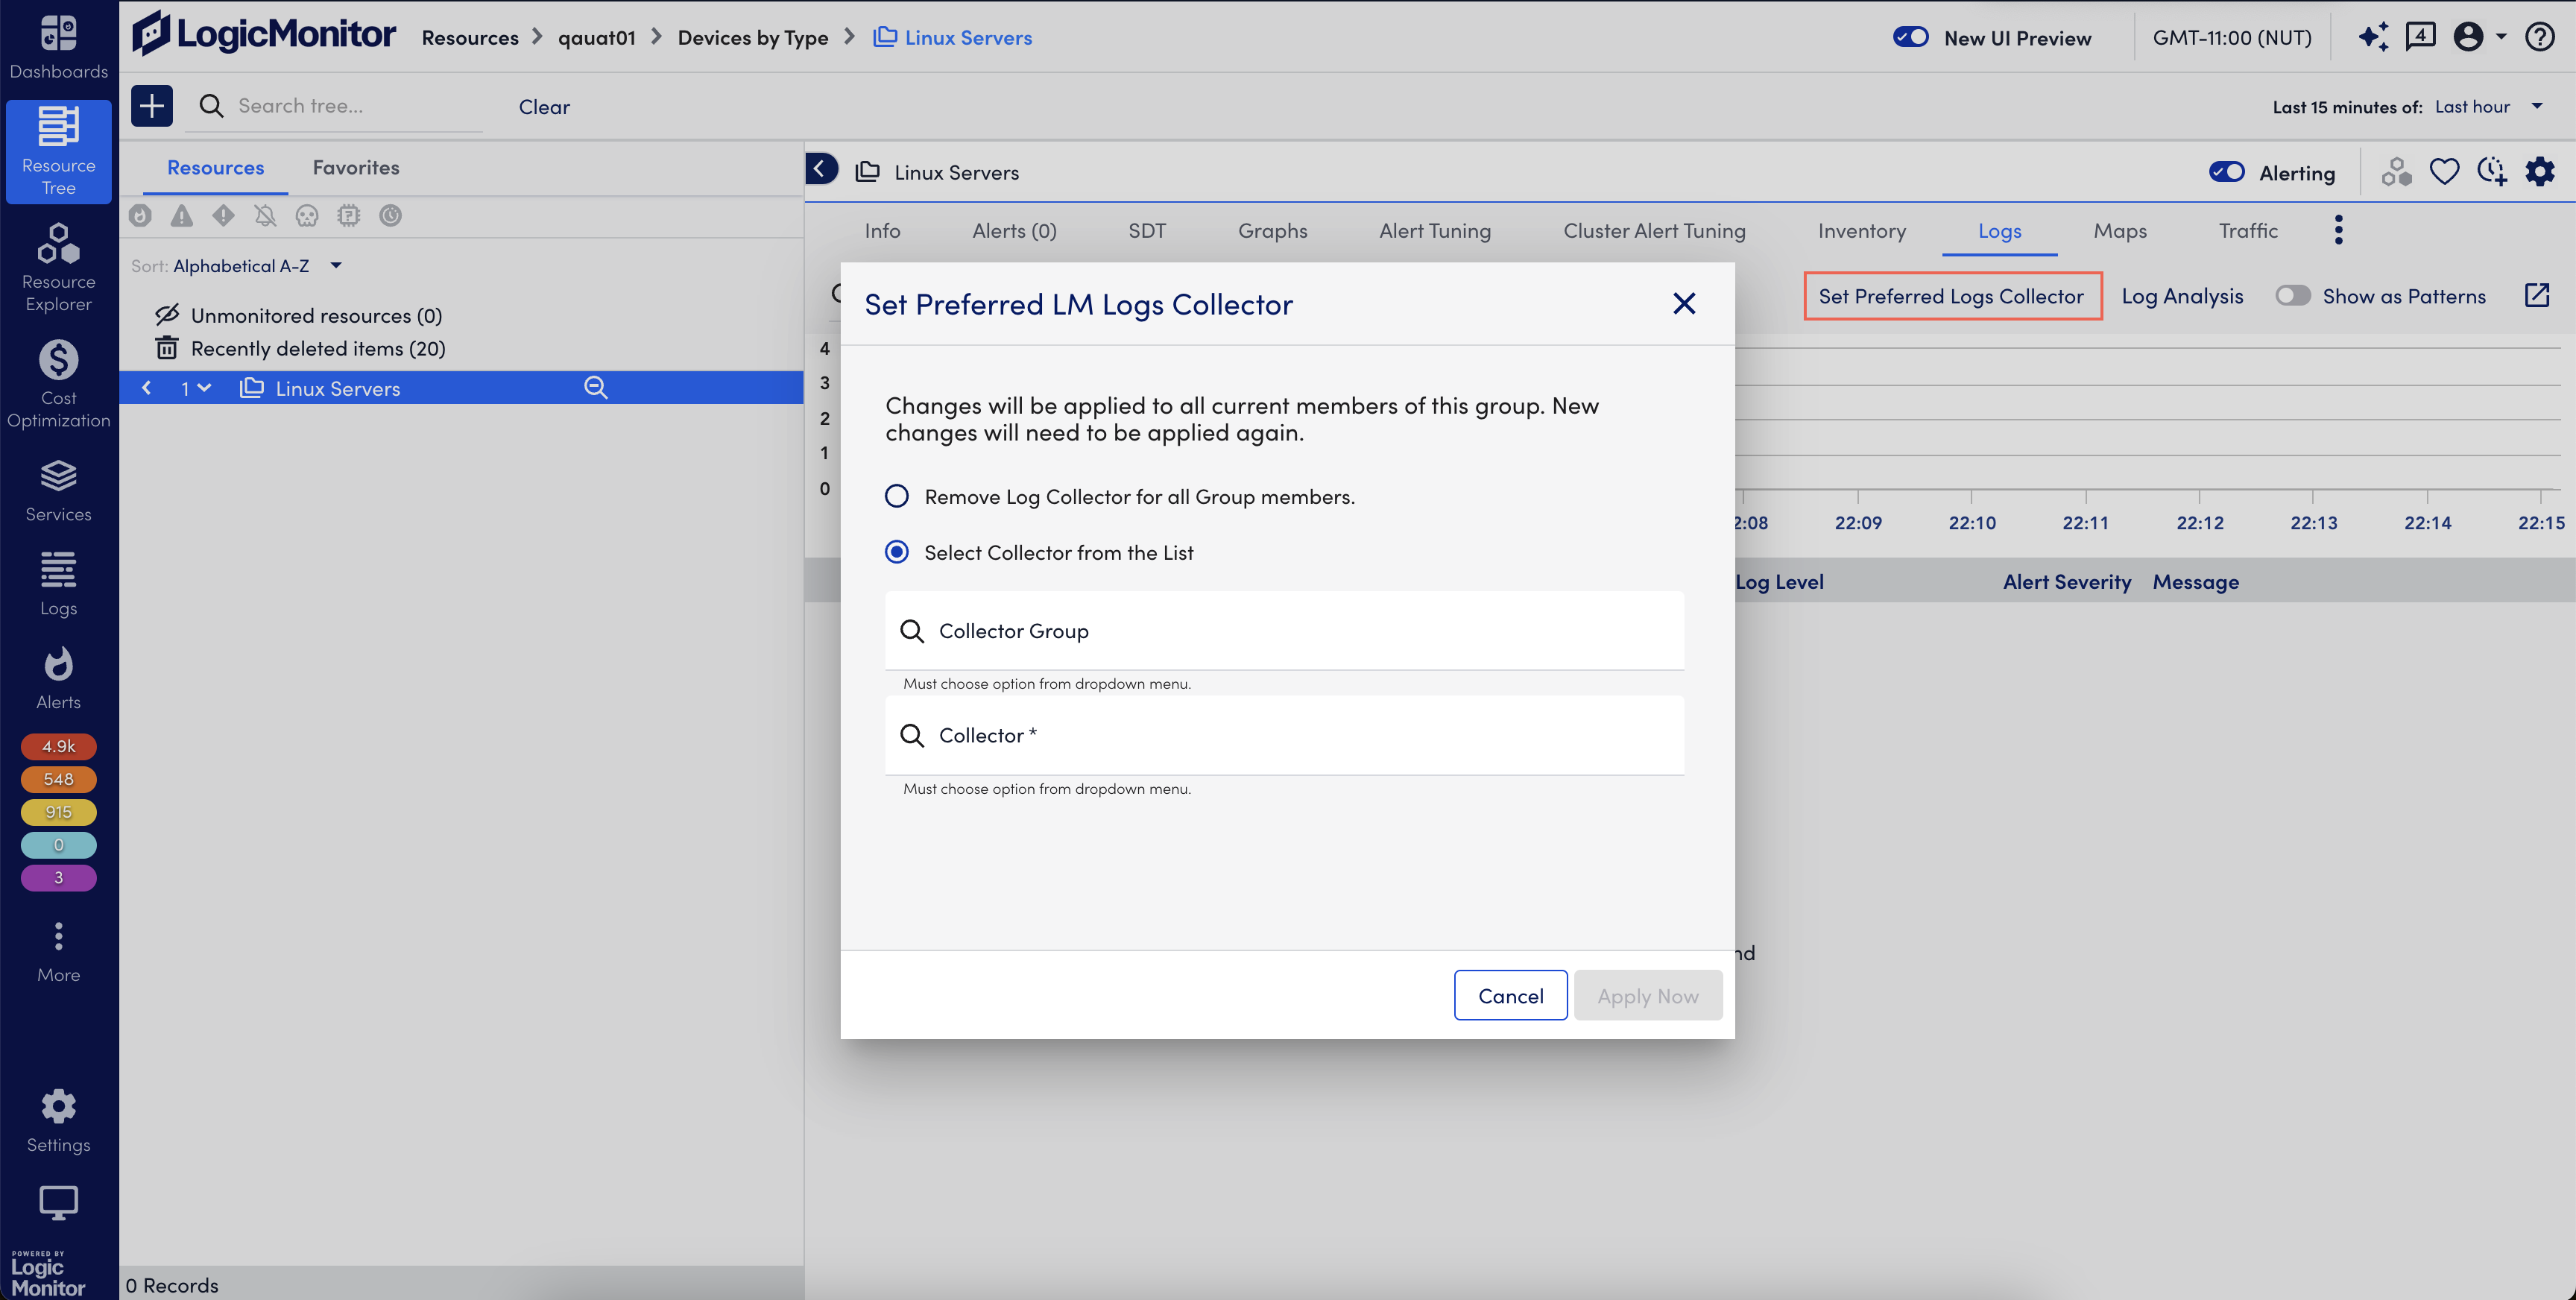
- Select any of the following options:
- Remove Log Collector for all Group members – Select to remove log collector from the resource group. By default, this option is selected.
- Select Collector from the List – Select Collector Group (Optional) and Collector (Required) from the drop-down list.
- Select Apply Now to update the configuration.
Type-specific Configuration Parameters
For information about configuration parameters for a specific type of LogSource, see the following:
