LogicMonitor + Catchpoint: Enter the New Era of Autonomous IT

Learn more

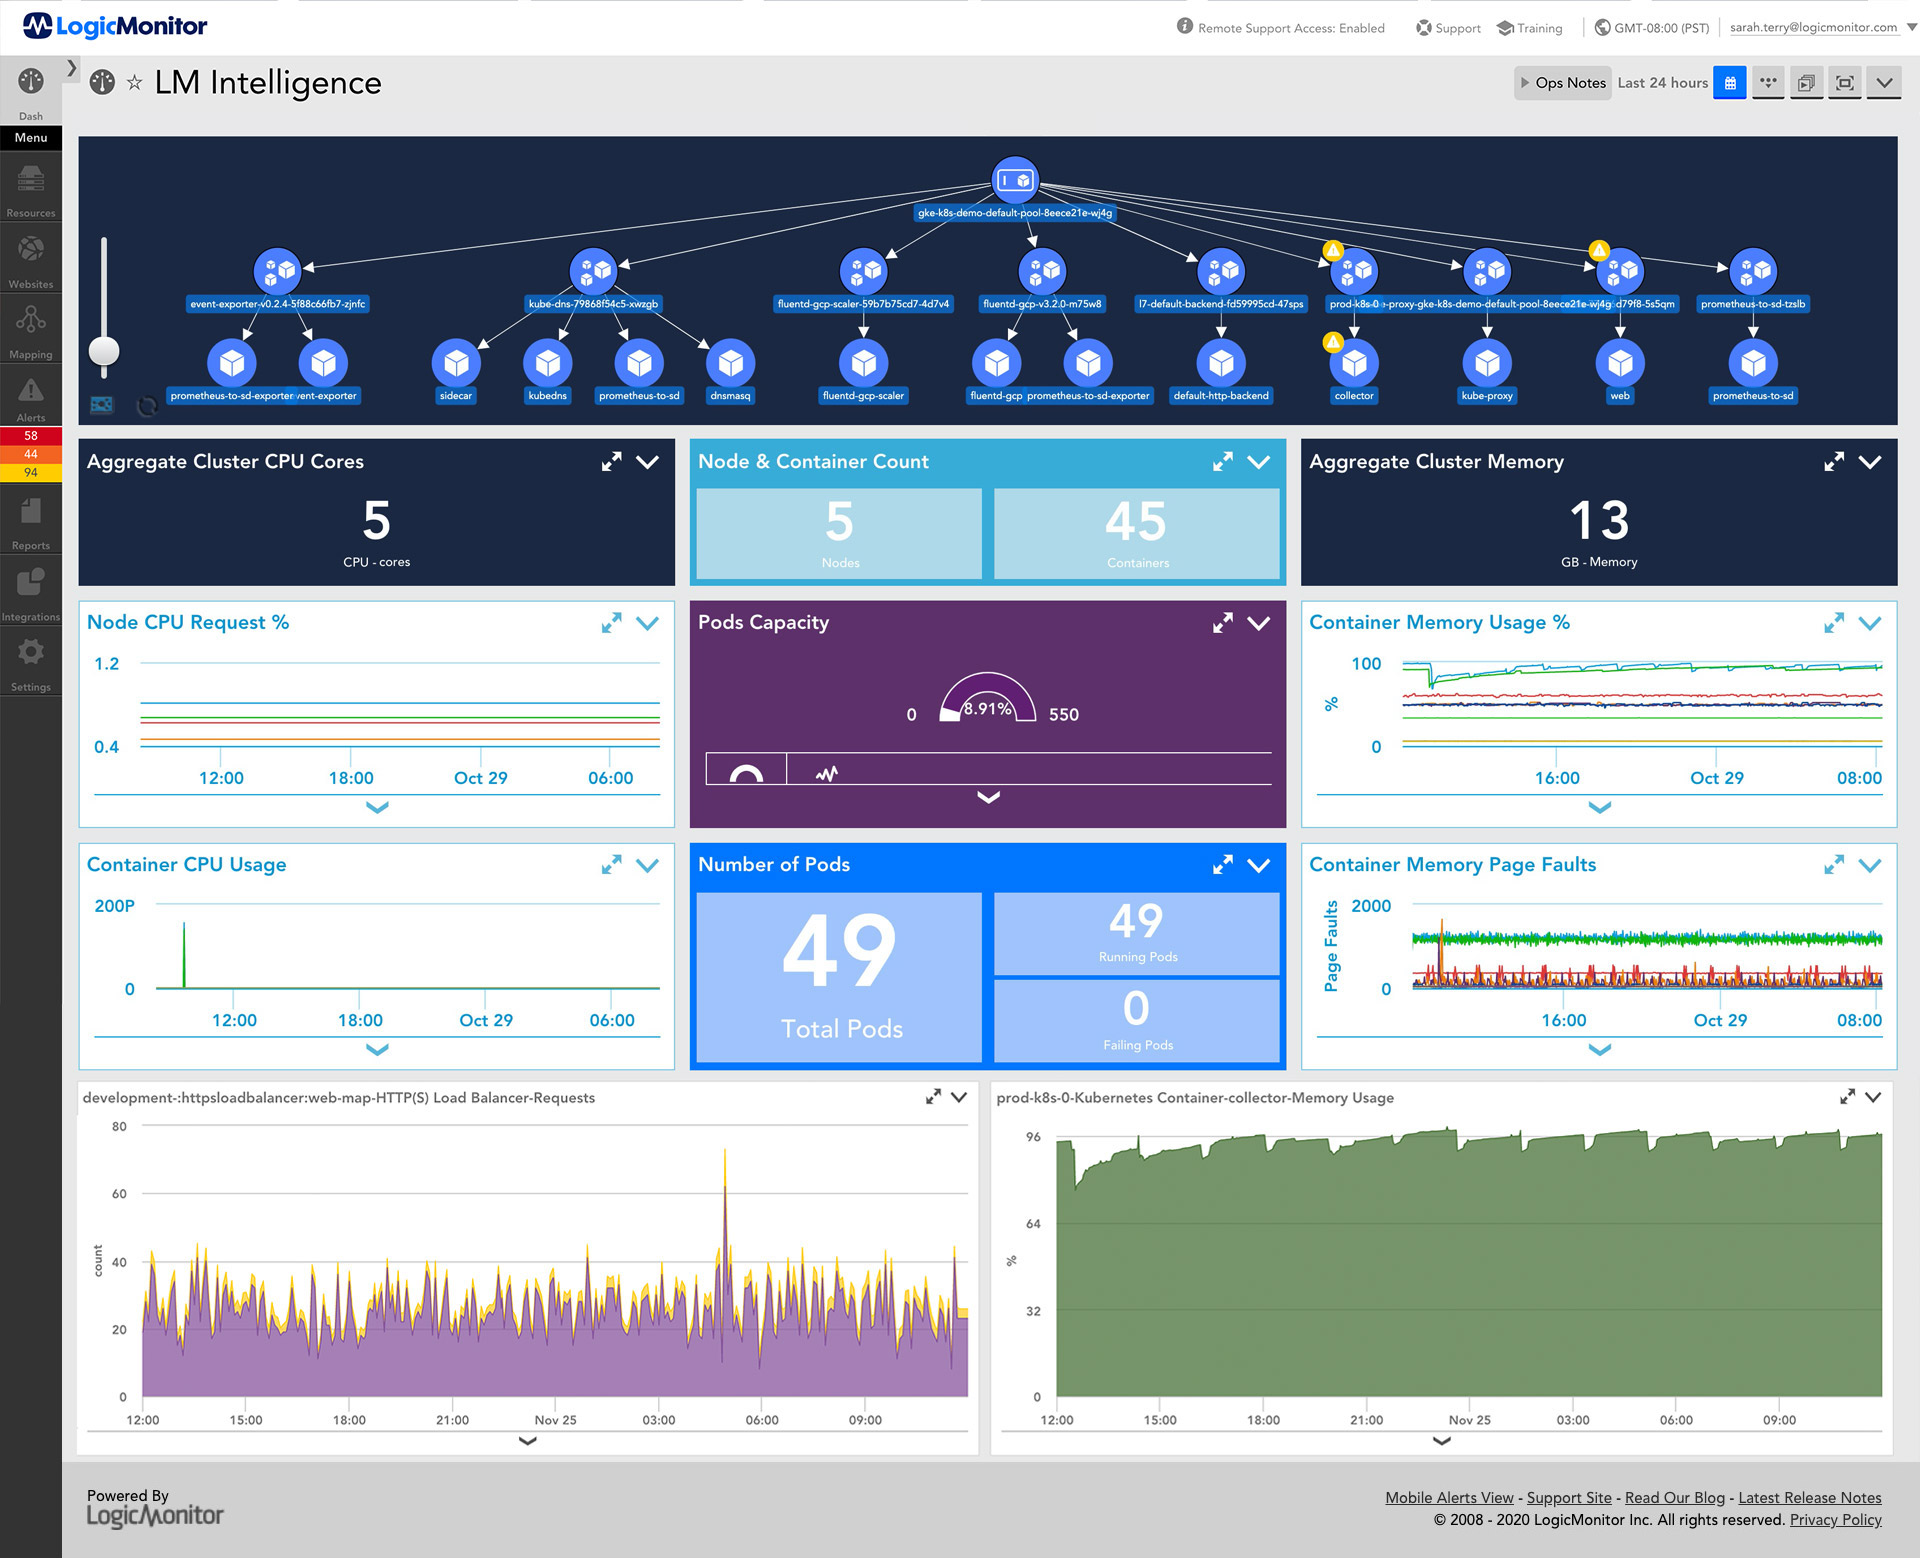
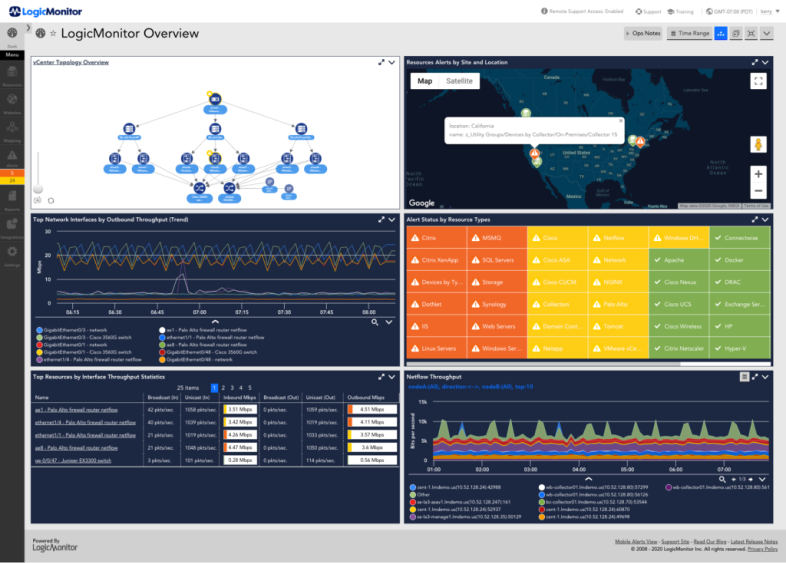
Comprehensive Infrastructure Monitoring

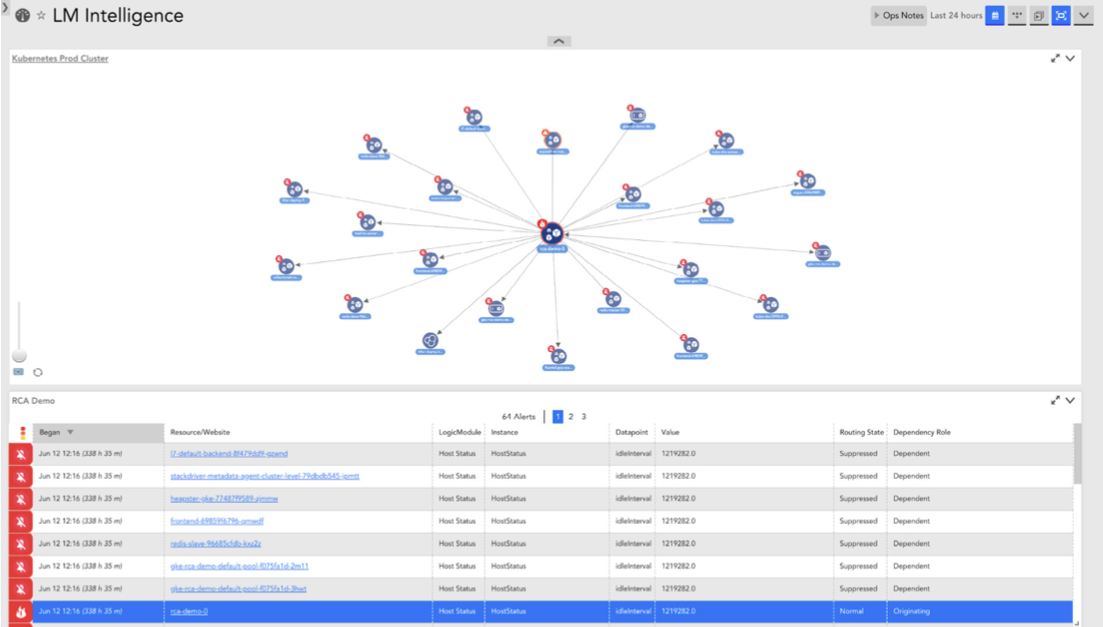
Unified observability that’s cloud-first, and hybrid ready. LogicMonitor’s leading SaaS platform for infrastructure monitoring gives you comprehensive visibility along with AI-powered insights that you can actually use to help you reduce MTTR and make informed decisions.

"LogicMonitor is a valuable partner, constantly innovating and adapting to our business needs."

"Switching from SolarWinds to LogicMonitor showed us how much we were missing."

"The sheer power of LogicMonitor’s monitoring capability is amazing."

Let’s get started

Fill out the form below to get started

"LogicMonitor is a valuable partner, constantly innovating and adapting to our business needs."

"Switching from SolarWinds to LogicMonitor showed us how much we were missing."

"The sheer power of LogicMonitor’s monitoring capability is amazing."

Intelligent monitoring for complex IT infrastructure

  • Intelligent alerting with dynamic thresholds
  • Topology mapping with root cause analysis
  • Automated deployment and configuration
  • Pre-built and customizable dashboards
  • 2000+ monitoring and technology integrations
  • 24×7 live support with technical engineers
  • Reporting
LM Intelligence Enterprise performance monitoring dashboard showcasing AIOps capabilities of LogicMonitor

Trusted By

Costco Travel Logo
jamf Logo

Rapid deployment. Zero configuration.

A fully unified view. LogicMonitor provides a single pane of glass for any hybrid infrastructure environments. With over 2000+ built-in integrations, you can say goodbye to tool sprawl and context switching. Keep an eye on all your critical infrastructure metrics in one place including:

  • Networks and networking gear
  • Cloud and container resources
  • Servers, storage, and databases
  • Websites and applications
  • SaaS services essential for remote work

Automate deployment and configuration

A platform that knows what you need. LogicMonitor’s lightweight, agentless collectors automatically discover your entire IT infrastructure. Within minutes you’ll have full observability with intelligent alerts and inuitive graphs and dashboards. Intelligent automation also means that LogicMonitor scales as fast as you do. New resources are automatically discovered and monitored alongside everything else that keeps your business running.

observability

Make teams more productive with AIOps

LogicMonitor’s AIOps features provide dynamic, real-time monitoring that streamlines troubleshooting and proactively prevents issues across a wide range of infrastructure environments.

  • Get smarter alerts for critical issues by using dynamic thresholds
  • Automatically surface anomalies
  • Receive precise root cause analysis for business-impacting issues
  • Visualize infrastructure dependencies with dynamic topology mapping
  • Predict future trends and plan utilization with advanced forecasting
LM Intelligence Topology map

We have decommissioned a lot of tools since bringing LogicMonitor onboard. Datadog, Splunk, Pingdom, New Relic, a number of Prometheus, and Grafana environments, thanks to LM dashboards. LogicMonitor has helped consolidate, standardize, and eliminate a lot of overhead and tool spread.

WILLIAM GUERTIN
SENIOR SYSTEM ADMINISTRATOR, ACCRUENT

WHY LOGICMONITOR

Infrastructure Monitoring Capabilities

Complex
Proactive
Customize
Alerting
Optimize
Collaboration

Support complex infrastructure environments

LogicMonitor is cloud-first and hybrid ready. Monitor anything from containers to traditional on-prem infrastructure in one place. Containers are discovered and added to our platform as quickly as they are generated or destroyed. Spot bandwidth hogs in real-time and optimize cloud spend all within a single platform.

Enable proactive monitoring

AI-powered monitoring lets teams proactively prevent issues instead of simply reacting to problems. By automatically surfacing issues that can impact performance, LogicMonitor helps detect any anomalies across your infrastructure stack and forecast resource utilization to ensure that business-critical services stay online.

Customize dashboards

Dashboards are as simple or as nuanced as you need. LogicMonitor automatically creates at-a-glance status dashboards for every services based on industry best-practices. Using dashboards to share information across teams at every level is intuitive and fully customizable. Our platform makes it easy to combine data from across your infrastructure stack with drag-and-drop widgets to create application or service-specific views.

Eliminate alert storms

Put an end to alert storms with dynamic thresholds and root cause analysis. LogicMonitor intelligently detects service-impacting signals from noise, so signals are actionable. With alert escalation chains, the right team members are informed via SMS, email, chat, or ITSM integrations. So everyone can sleep better at night.

Optimize infrastructure costs

Advanced forecasting helps you predict future trends and plan accordingly. Resource utilization dashboards identify over-provisioned or under-utilized resources so you can reallocate resources and prevent infrastructure costs from ballooning.

Improve team collaboration

Communicate and resolve infrastructure performance issues quickly with a unified platform for IT Operation and DevOps teams. With workflow integrations for PagerDuty, Slack, ServiceNow, and Terraform, we make it easy to transform alerts into action and quickly reduce Mean Time To Repair.

Ready to Revolutionize Infrastructure Monitoring?

Get full visibility, instant troubleshooting, and proactive alerting—all in one platform.

14-day access to the full LogicMonitor platform