Unleash More Integrations with LM Exchange
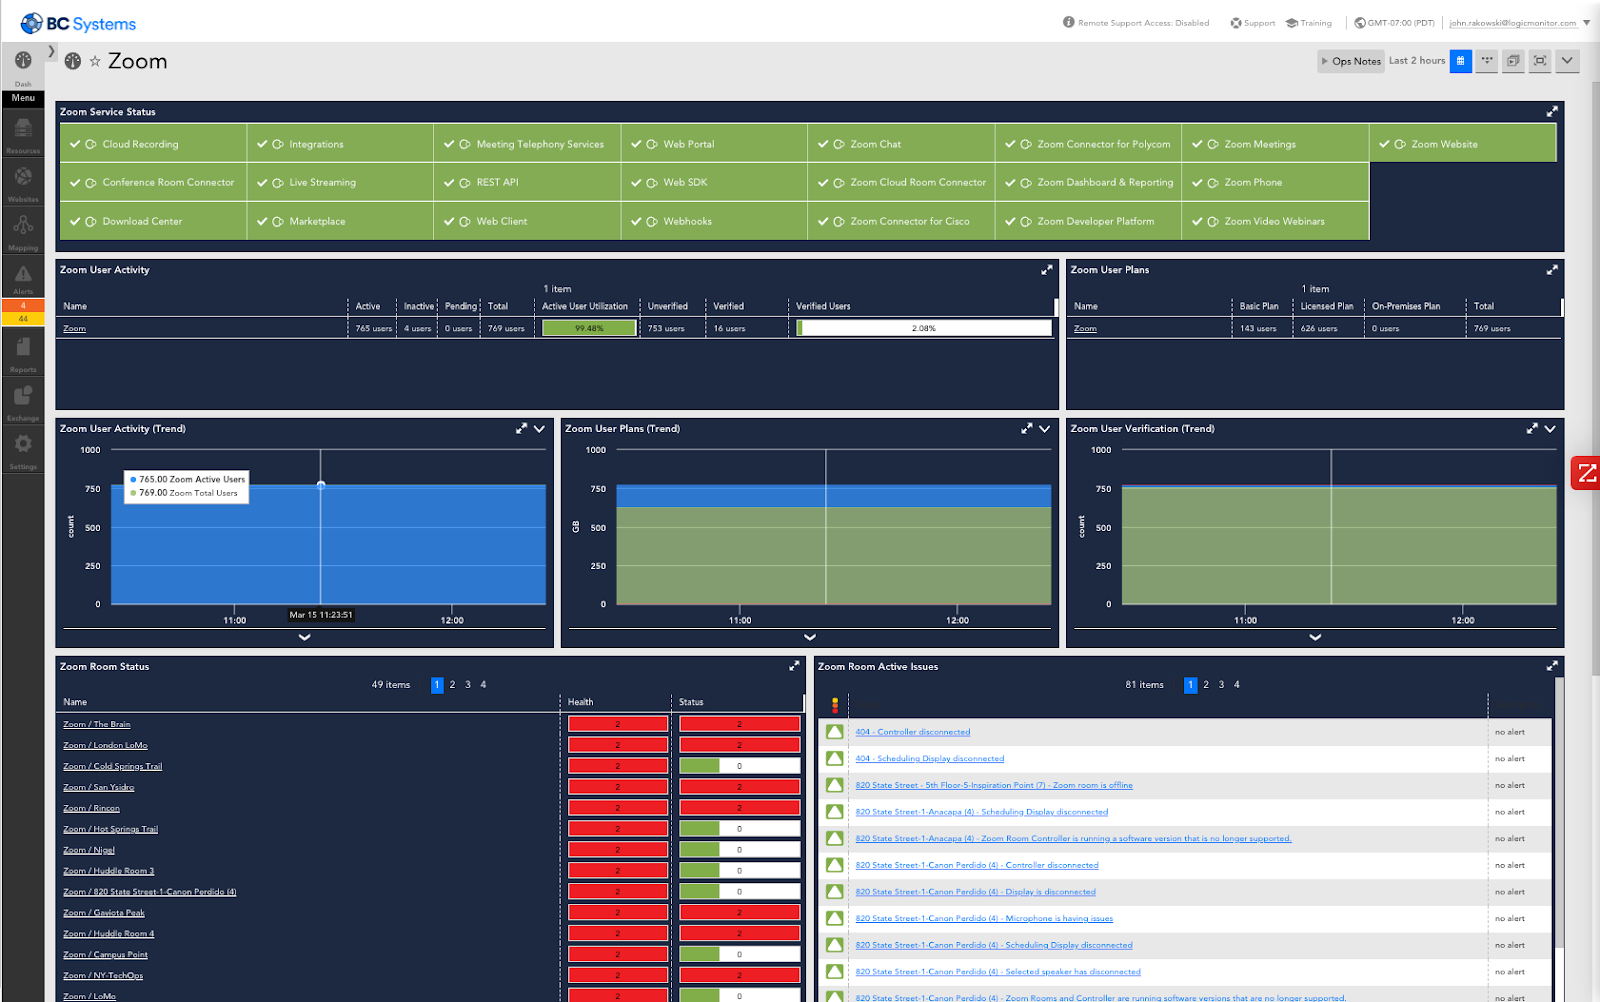
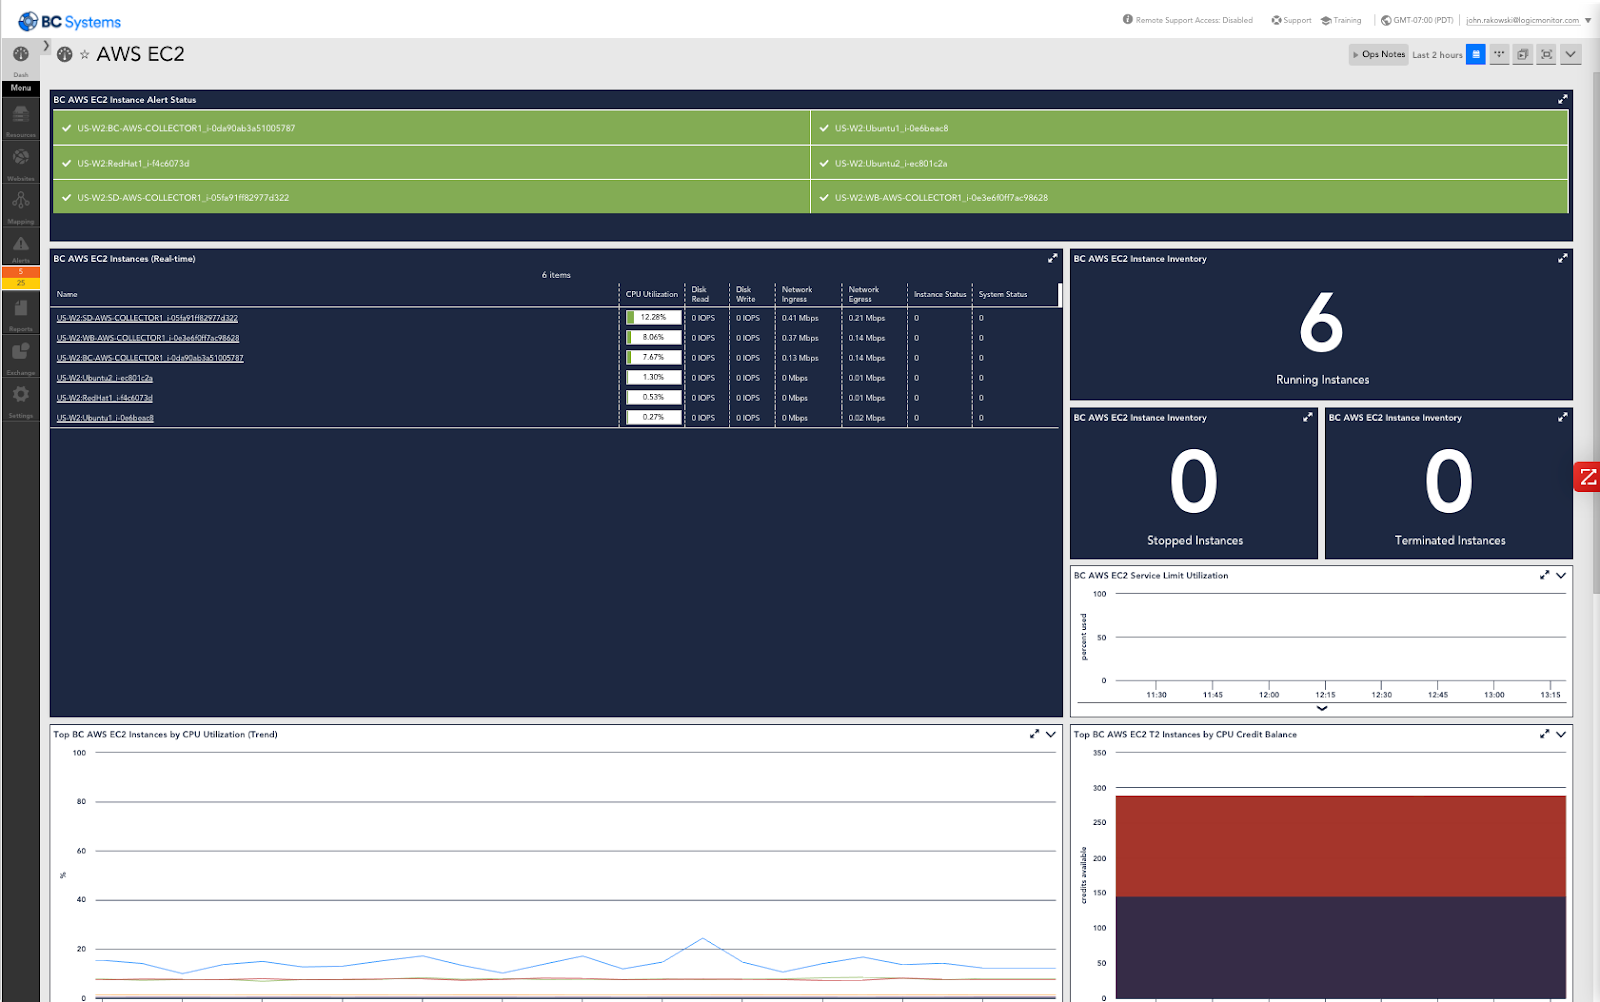
LogicMonitor offers an ever-expanding library of integrations to bring you out-of-the-box monitoring for the networking devices, applications, databases, services, cloud platforms, SaaS applications and other systems and tools your enterprise relies on. LM Exchange provides a centralized view of integrations available in LogicMonitor’s global repository—whether developed by LogicMonitor or a member of LogicMonitor’s user community. Additionally LM Exchange, Cloud Integrations provides an intuitive, three-step configuration wizard to quickly onboard and monitor, via APIs, cloud platforms such as AWS, Azure and GCP, and SaaS applications such as Office 365, Salesforce, Zoom or any supported by Atlassian Statuspage.io.