More Metrics! Updates to Cisco Monitoring Ahead of Cisco Live 2017
At LogicMonitor, we’re constantly expanding the breadth and depth of our monitoring coverage. As we pack our bags for Cisco Live, we thought now would be a good time to highlight some of the Cisco-specific monitoring we updated this year.
2 min read
June 22, 2017
In this article
NEWSLETTER
Subscribe to our newsletter
Get the latest blogs, whitepapers, eGuides, and more straight into your inbox.
Thank you!
Your video will begin shortly
SHARE
In this article
At LogicMonitor, we’re constantly expanding the breadth and depth of our monitoring coverage. As we pack our bags for Cisco Live, we thought now would be a good time to highlight some of the Cisco-specific monitoring we updated this year.
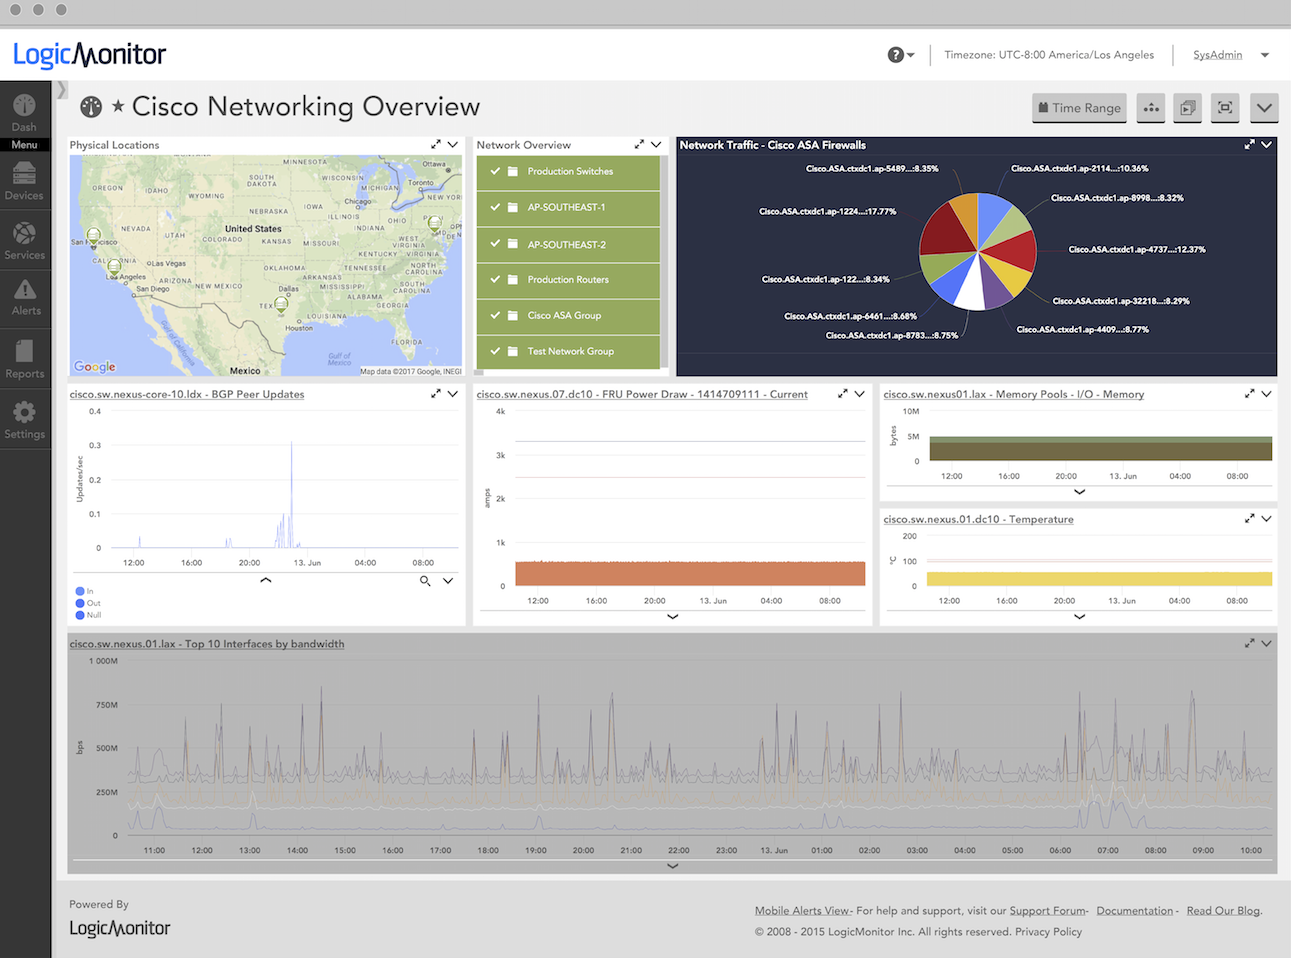
We recently broadened our monitoring capabilities for Cisco Nexus, adding some additional metrics for this popular line of data center switches, including:
• Supervisor card status and redundancy states • Ejector and line card status • FRU status and power draw • VDC status • Fans and temperature sensors
In addition to Nexus switches, we extended our monitoring for Cisco’s Unified Computing System (UCS) and track:
• Alerts on Active faults • Consumed power, input current, and voltage for components • Service Profile Server status • Service Profile Binding status • Ethernet Interface throughput and packet rate • Fan speeds • Virtual NIC throughput, dropped packets, errors • Status of Virtual Ethernet Interfaces • Virtual SAN member health status
We also created new DataSources for ASA firewalls, and now monitor ASA Cluster Status, IPsec tunnels, temperature, and fan status.
To round out our Cisco monitoring, we developed two new ConfigSources for Cisco networking components running IOS and NX-OS. ConfigSources are templates that allow LogicMonitor to provide configuration monitoring, in this case for any Cisco devices running either of these two widely-used operating systems.
Be sure to check out LogicMonitor’s release notes for regular updates on new metrics and DataSources. Also, if you’re headed to Cisco Live, stop by Booth 919 to see these new datapoints live!