Integrations
Nutanix
Nutanix Ready AHV Logo

Nutanix

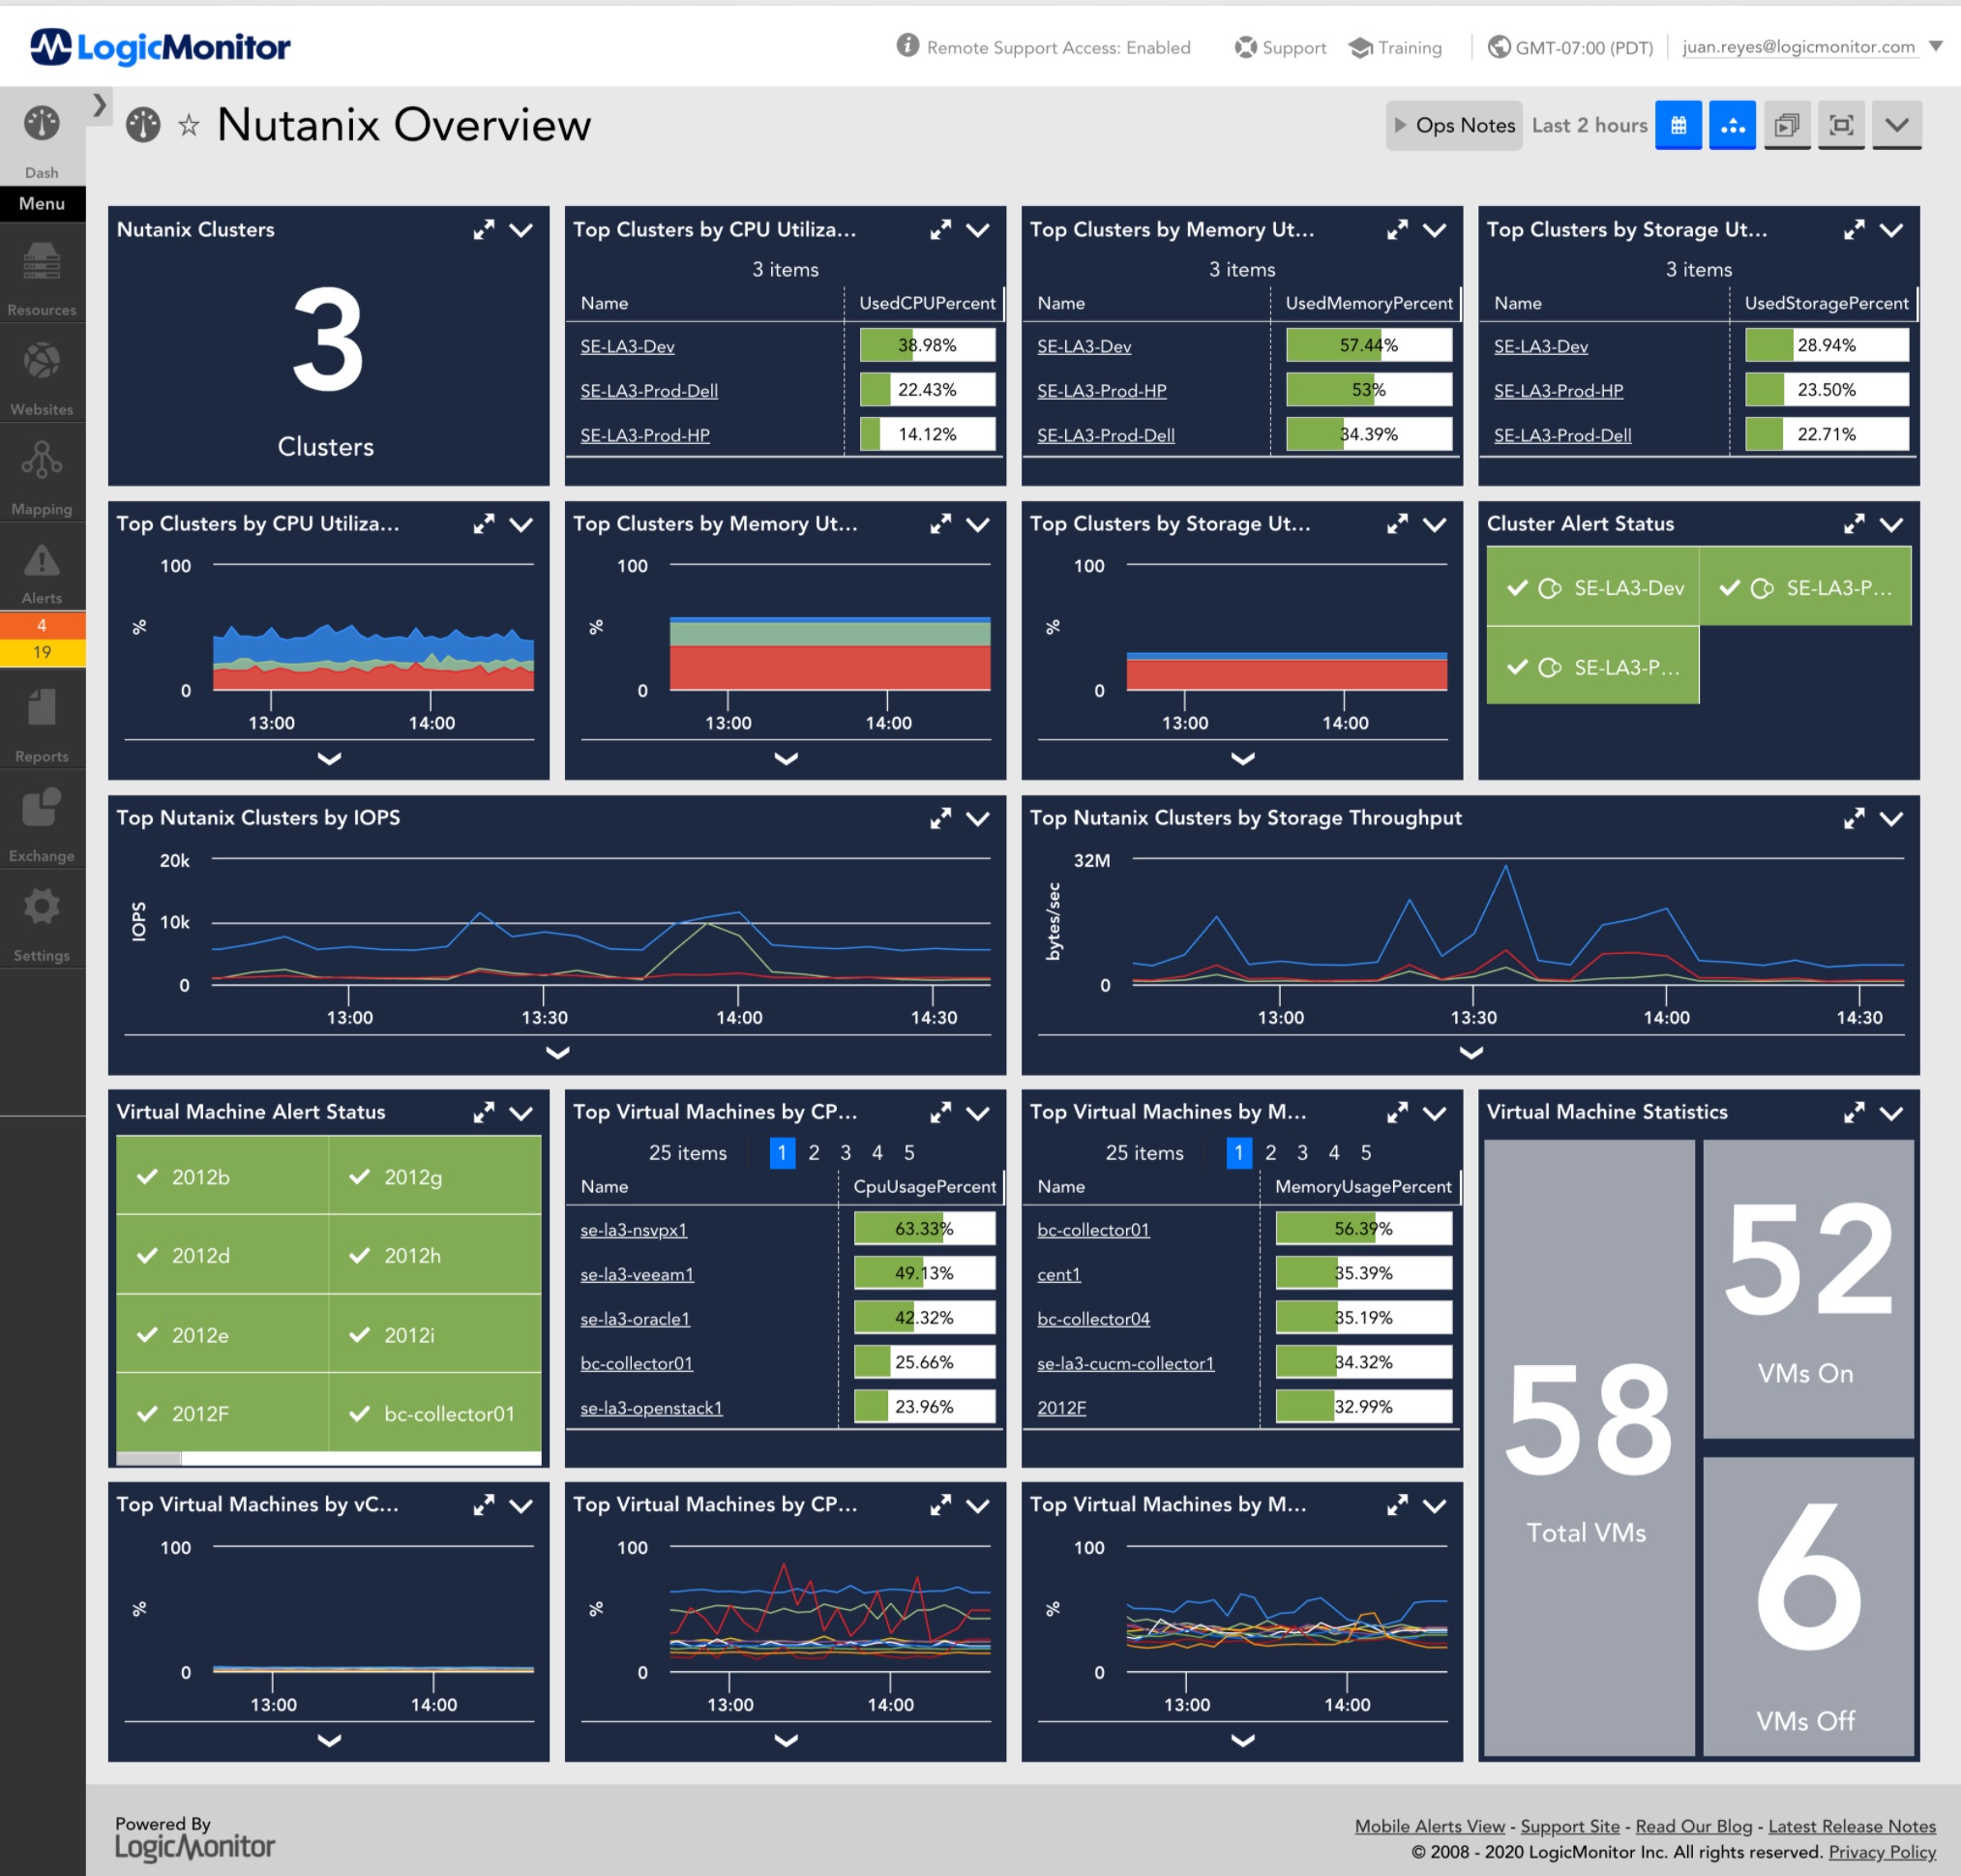
LogicMonitor helps you make the most of your Nutanix implementation by delivering comprehensive health and performance monitoring. Our out-of-the-box dashboards, thresholds, and AIOps capabilities will help provide meaningful insights into your environment without excessive ramp-up time and configuration. As you scale, LogicMonitor will automatically monitor newly provisioned VMs, storage, network, and applications. And with LogicMonitor’s breadth of coverage, you can monitor network devices and other data center components alongside your Nutanix environment.

Holistic visibility within minutes.

LogicMonitor’s out-of-the-box dashboards display overall cluster health, controller performance and the end-to-end statistics of each Nutanix hypervisor, allowing you to quickly surface irregularities across your environment..

Identify storage bottlenecks faster.

Track storage performance issues comprehensively—all the way down to latency of a storage pool or IOPS on a particular hypervisor. LogicMonitor can proactively alert you before storage impacts service availability.

Easily track Virtual Machines performance.

LogicMonitor’s Active Discovery is always looking for new virtual machines on your Nutanix hypervisor host. Spun up a new instance? LogicMonitor will discover it in minutes – no additional configuration required! Survey CPU, memory utilization, storage IOPS/latency, and network throughput performance of top VMs at a glance to quickly identify outliers and potential misconfigurations.

Using LogicMonitor, you can track and measure:

  • Overall Cluster Health
  • Storage Capacity, IOPS, Throughput, and Latency at the Container level, Cluster level, Storage Pool level, and individual Disk level
  • End-to-end performance of each Nutanix Hypervisor as well as each VM—including CPU, Memory utilization, Storage IOPS/Latency, and Network Throughput
  • Nutanix Controller Health

Receive alerts on:

  • High Disk Latency on any Nutanix Hypervisor, VM, Storage Pool, Cluster, Container, or Disk
  • Low Storage Capacity on any Nutanix Hypervisor, VM, Storage Pool, Cluster, Container, or Disk
  • High CPU usage on any Nutanix Hypervisor or VM
  • Low Memory on any Nutanix Hypervisor or VM
  • High rate of dropped packets Nutanix Hypervisor or VM
  • Failed health status on any Nutanix Controller

Track storage performance issues comprehensively—all the way down to Latency of a Storage Pool or IOPS on a particular Hypervisor.

Nutanix pool storage latency

Nutanix IOPS

Survey performance of top VMs at a glance to quickly identify outliers and potential problems.

Setup:

Nutanix systems are monitored via SNMPv3. LogicMonitor will auto-discover Nutanix devices provided SNMP is enabled. For more information on enabling SNMP for Nutanix devices, see the Configuring SNMP documentation provided by Nutanix.

Similar & Related Integrations

VMware

Network Switches

Database Applications

Web server applications