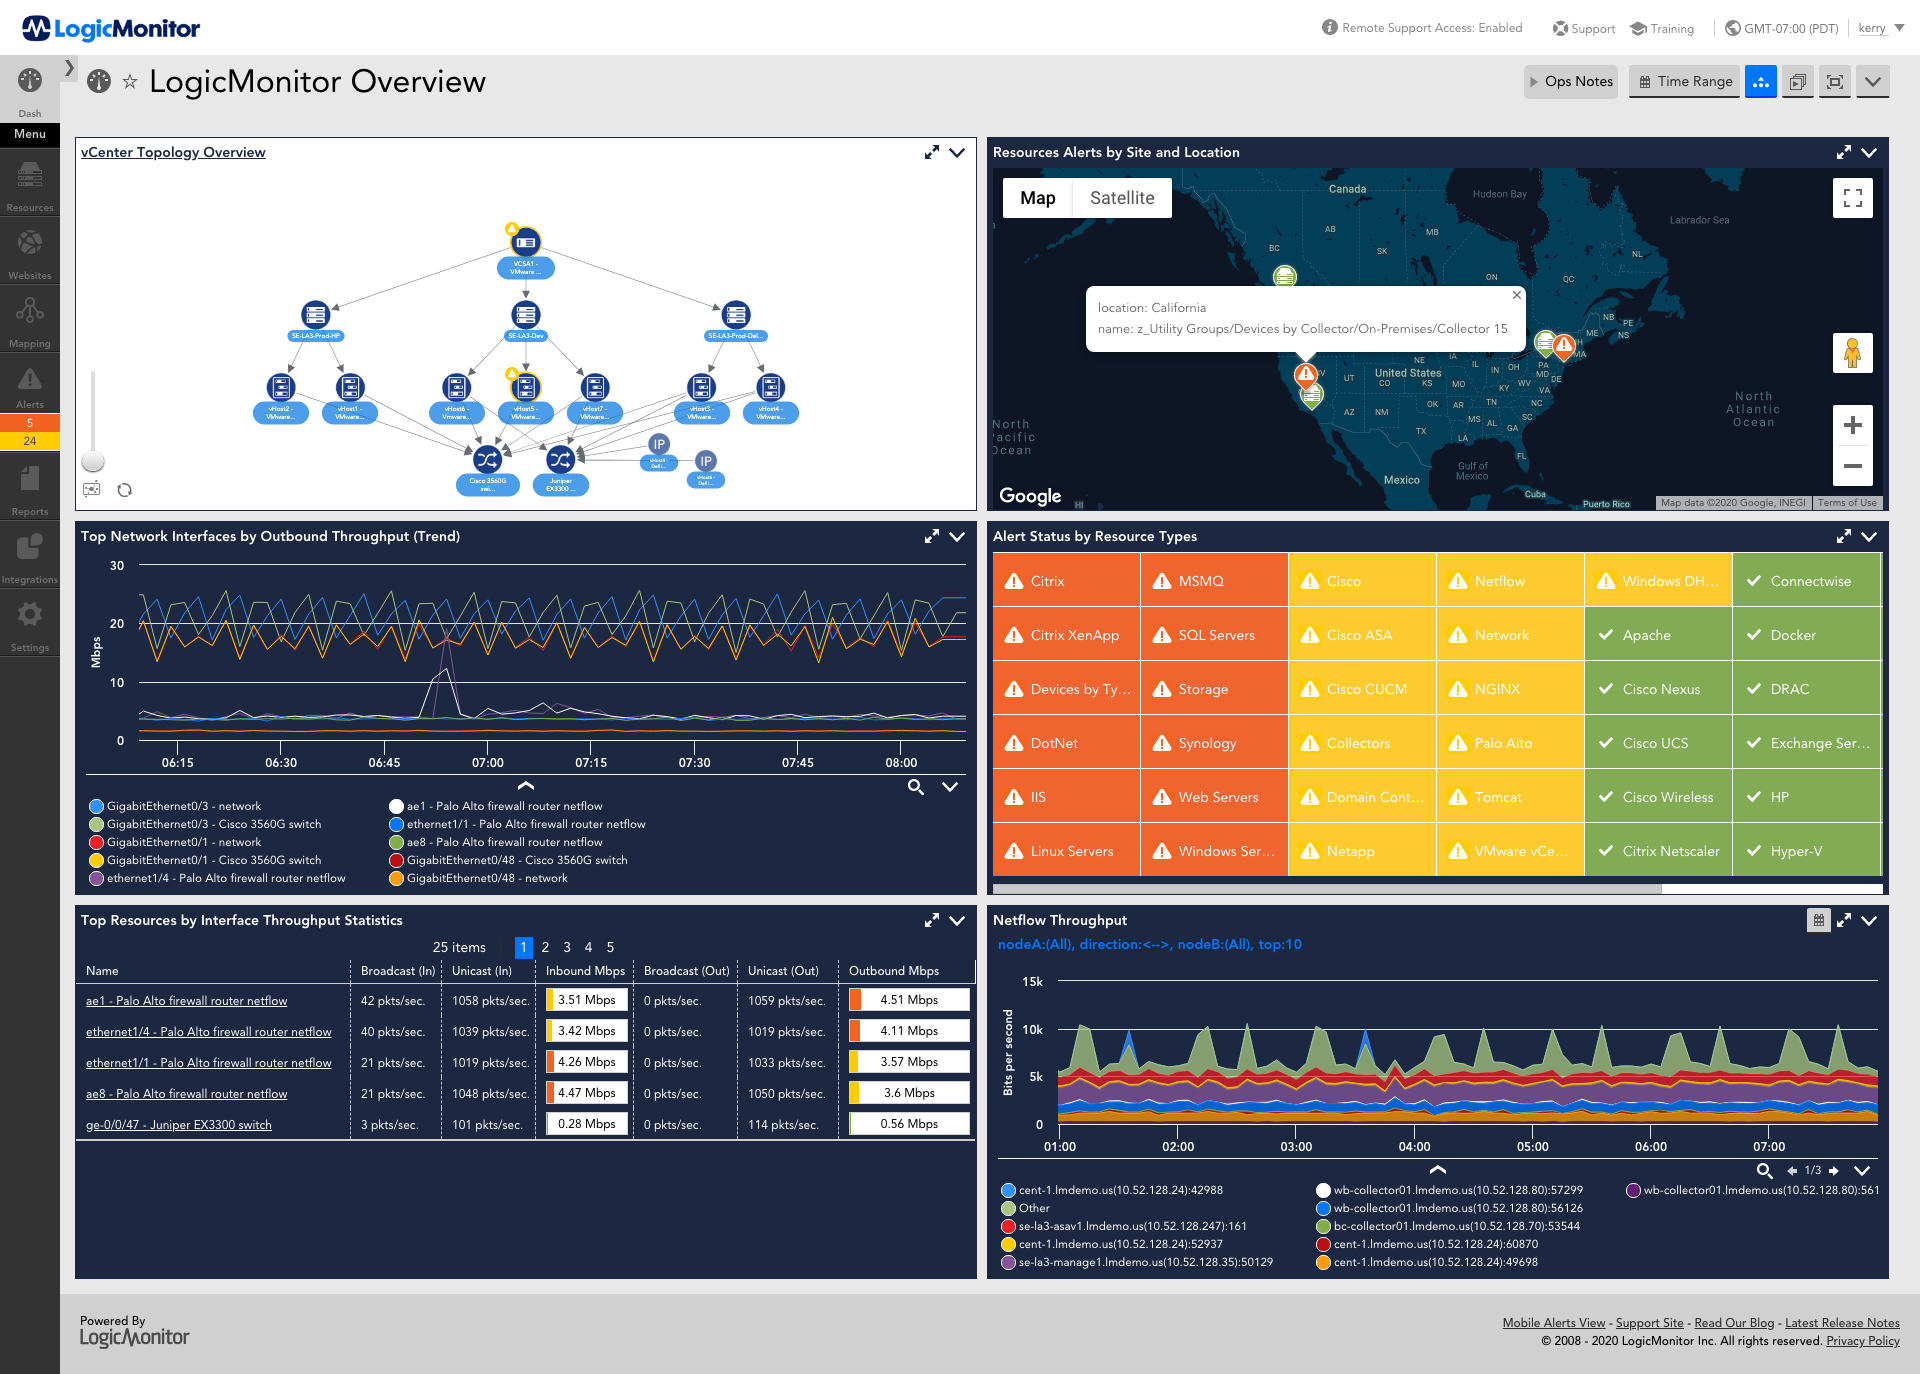
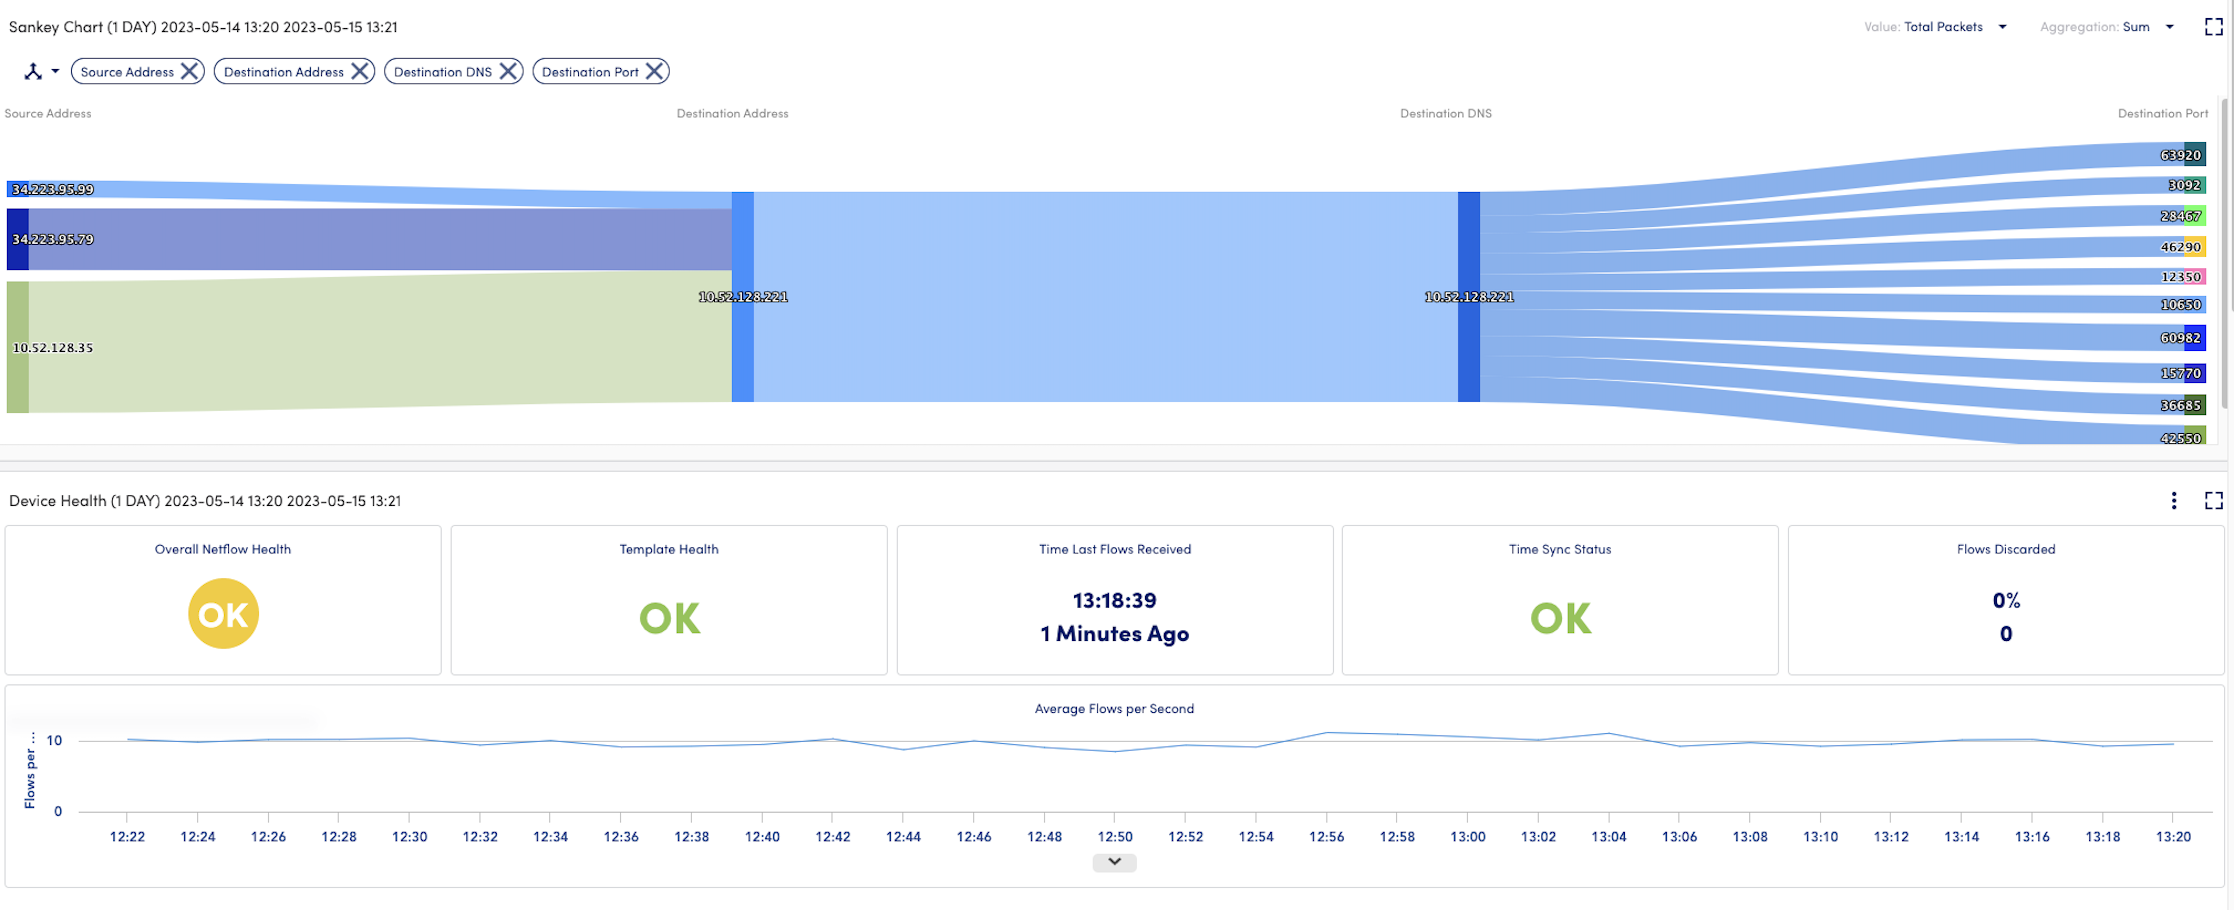
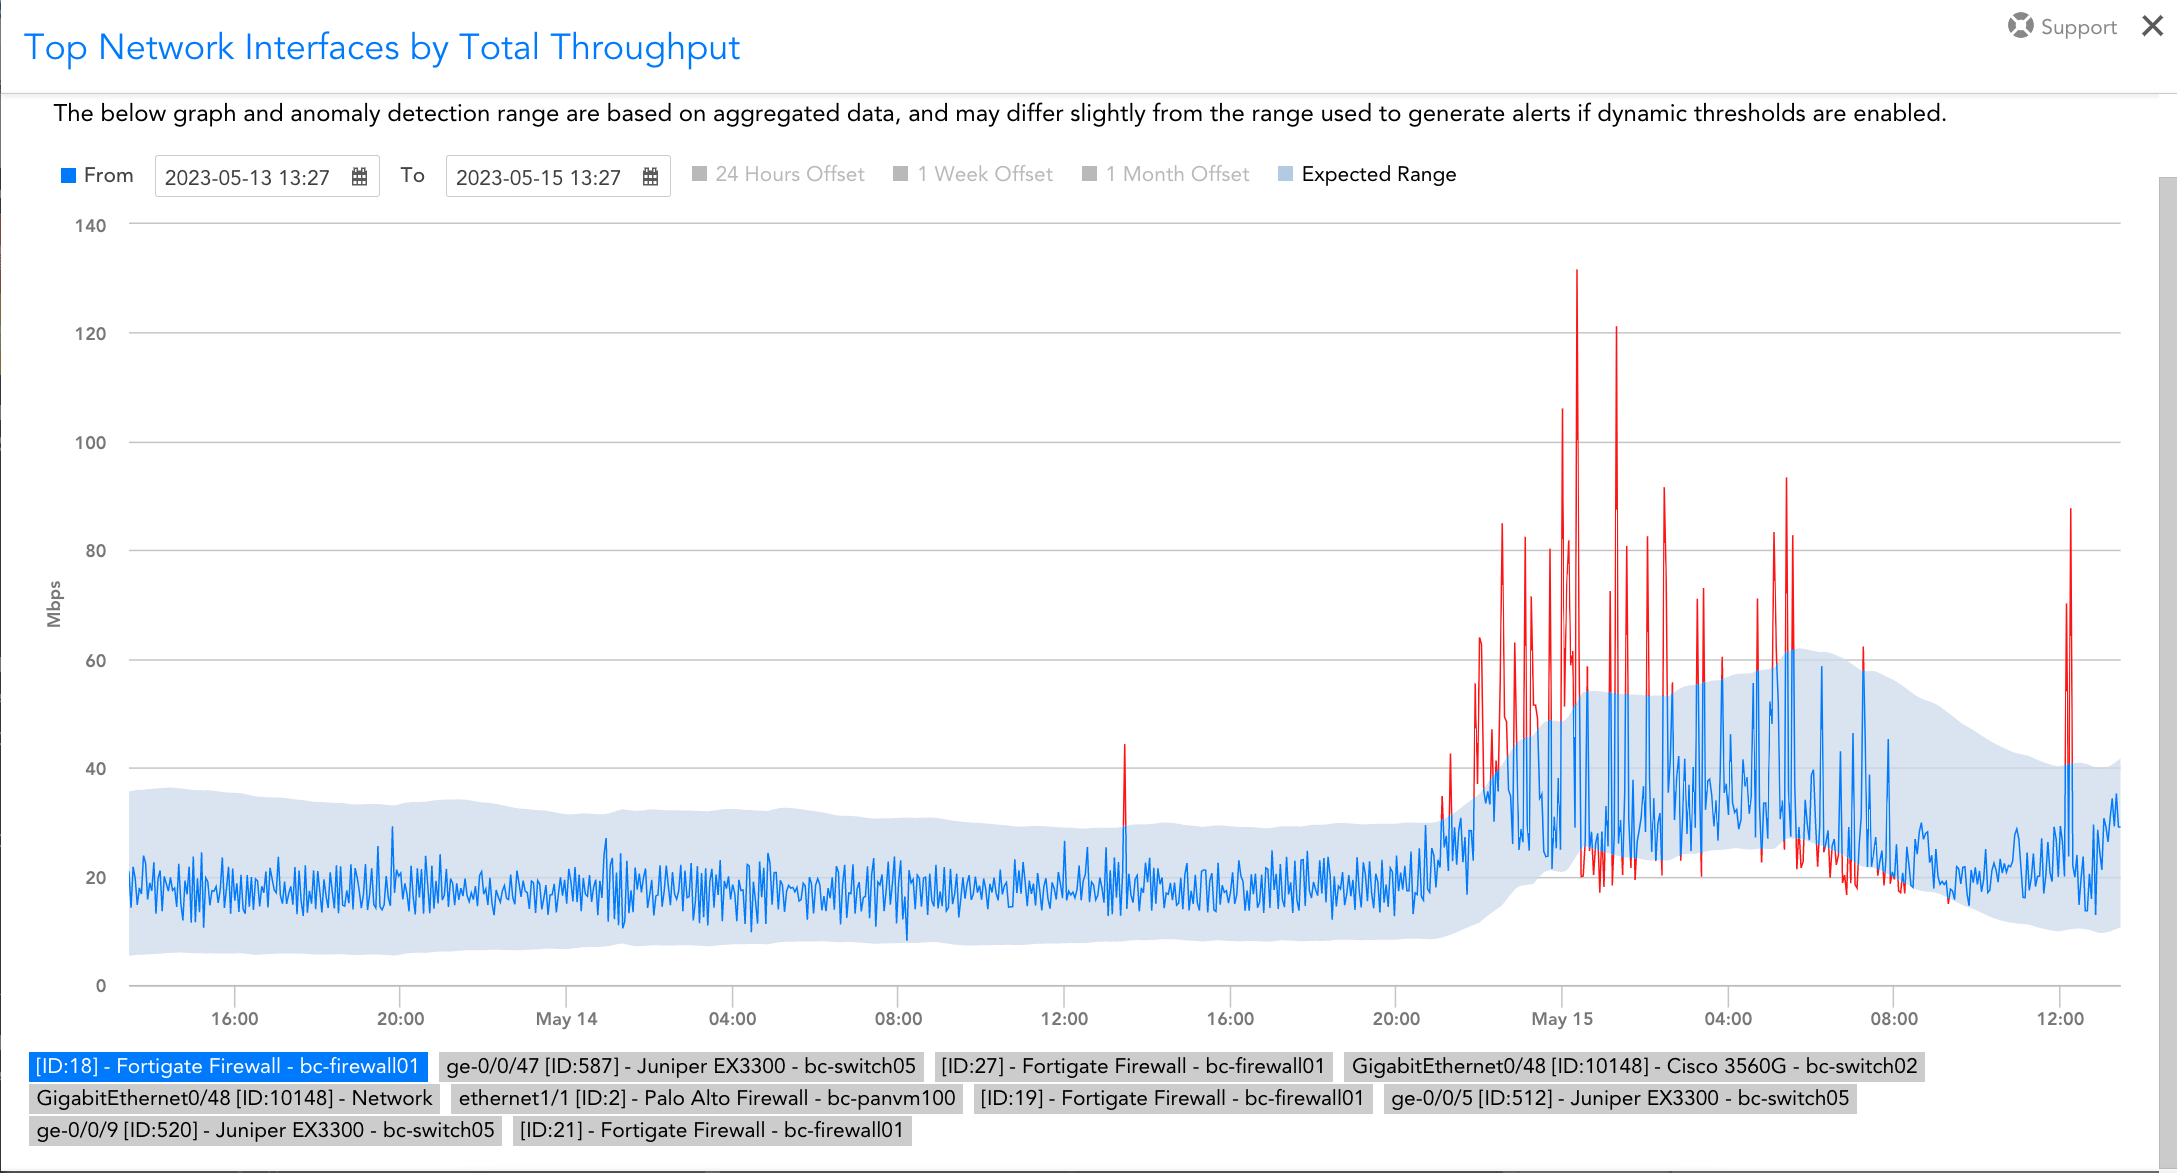
What types of traffic protocols does LogicMonitor support for network analysis?
LogicMonitor supports a range of protocols, including NetFlow, sFlow, J-Flow, and IPFIX, to analyze network traffic comprehensively.
How does network analysis help improve performance?
Network analysis provides real-time insights into traffic patterns, bandwidth usage, and bottlenecks, enabling IT teams to resolve issues quickly and optimize resources.
Can I customize dashboards for my specific monitoring needs?
Yes, LogicMonitor allows users to create tailored dashboards and configure metrics to monitor critical network data effectively.
How does LogicMonitor enhance network security?
By analyzing traffic flows, LogicMonitor identifies anomalies, unusual patterns, and potential threats, helping IT teams prevent security breaches and maintain compliance.
Top Insights from Elevate 2025
Now Streaming
Explore how AI is transforming observability—on your schedule. Watch Elevate Summit 2025 on-demand to hear LogicMonitor’s vision, real-world customer success stories, and practical strategies for thriving in today’s AI-driven IT landscape. Whether you’re seeking inspiration or actionable insights, these sessions deliver both.
Discover how LogicMonitor supports modern data center observability as AI and IT converge—helping you scale across hybrid environments while balancing performance, cost, and energy efficiency.
Get to know LM Envision
Explore the power of the LM Envision platform—correlating logs, metrics, and AI-driven alerts to give you a unified view of your hybrid cloud environment.
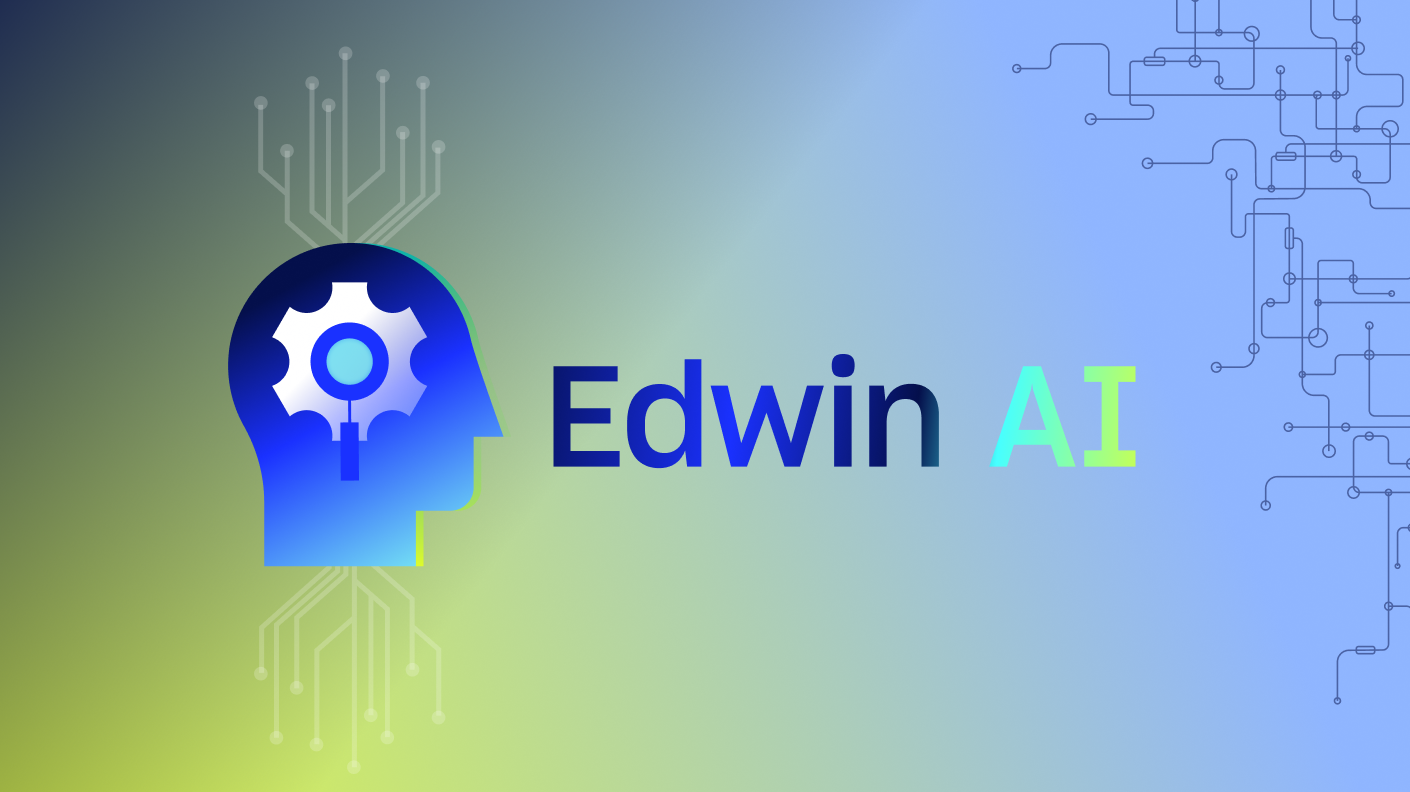
Supercharge your incident response with Edwin AI
Struggling with alert noise and false positives? Discover how Edwin AI leverages agentic AIOps to cut through the noise, pinpoint root causes, and accelerate resolution—boosting team productivity and transforming incident management.
Reduce workload migration risk
Cloud migrations come with risk. See how LogicMonitor helps validate performance, reduce downtime, and ensure smooth transitions across environments like VMware to AWS.
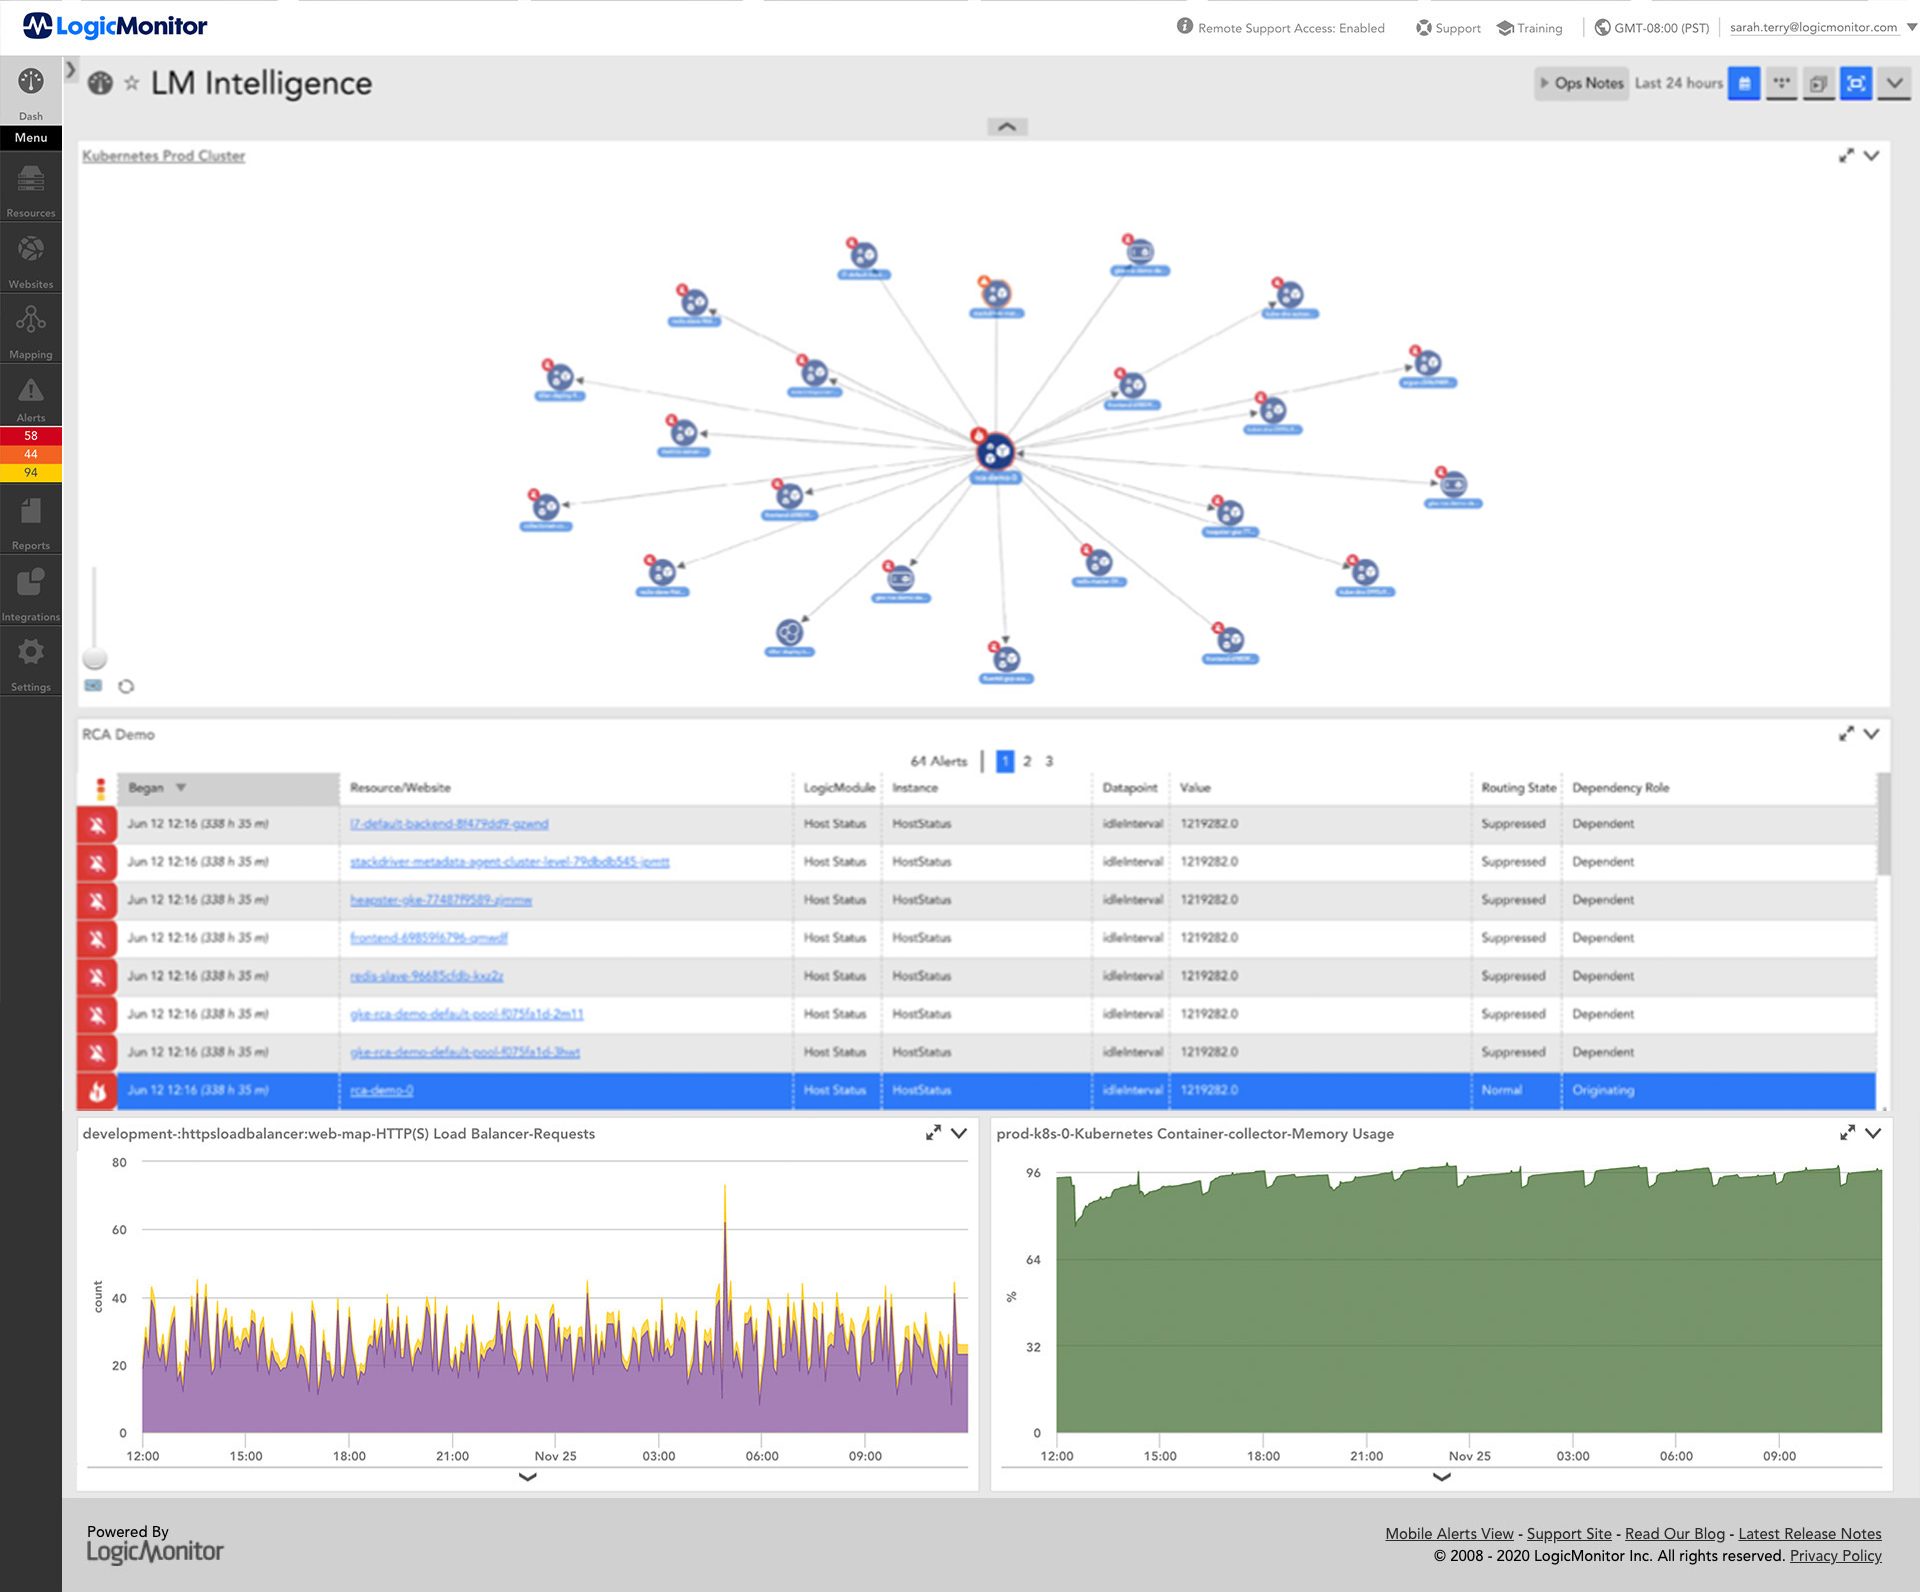
Make sense of your environment with Resource Explorer
Managing complex hybrid IT environments can be challenging—LogicMonitor’s Resource Explorer simplifies it with a centralized view to organize, visualize, and troubleshoot resources across your infrastructure.
Why metrics and logs are better than PB & chocolate
Like peanut butter and chocolate, logs and metrics are better together—combine them in a unified workflow to quickly understand not just what happened, but how and why it did.
Manage cloud costs without sacrificing performance
Cloud costs are rising—LogicMonitor helps you stay ahead with AI-powered cost-saving recommendations for AWS and Azure, giving you visibility, performance assurance, and optimized resource use across your environments.
Getting Started with LogicMonitor APIs: Automate, Integrate, and Simplify
Discover how to leverage LogicMonitor’s powerful REST API ecosystem to streamline your monitoring workflows and reduce manual tasks.
Troubleshooting your wireless networks for great customer and employee experience
In a constantly connected world, user experience depends on reliable wireless networks. Learn how LogicMonitor helps you proactively monitor and optimize Wi-Fi performance across all locations.
Driving your sustainability reporting and compliance goals with data
With CSRD now in effect, companies must report on sustainability by 2025. See how LogicMonitor helps you measure, track, and report environmental and social impact with ease.
Seeing the forest: Shifting to Service Level Insights
Tired of chasing alerts that don’t reflect true service health? Learn how LogicMonitor’s Service Insights gives you a clear, contextual view of service performance over time.
Application Visibility for ITOps
Hear best practices and feedback on Application Visibility that help shape LogicMonitor’s roadmap for deeper app insights.
Why are we still handling IT incident response like it’s 2014?
Every day, ITOps teams are flooded with alerts, spread thin across hybrid systems, and stuck trying to stitch together visibility from solutions that don’t talk to each other. The incidents keep coming, but the tools aren’t getting smarter—and the humans are burned out.
Even with best practices in place, response is often slow, inconsistent, and reactive. You chase symptoms instead of solving problems. You escalate what you can’t decode. And too often, the same issue reappears because the system didn’t learn anything from the last one.
That’s not a people problem; it’s a process problem. And more importantly, it’s a tooling problem.
Manual triage isn’t built for modern infrastructure. Neither are static playbooks or black-box monitoring platforms. What’s needed now is a system that can observe, analyze, and act—with enough context to actually help.
Incident response is the process ITOps teams follow to detect, investigate, and resolve issues that disrupt normal operations—like outages, performance slowdowns, system errors, or unexpected behavior.
The goal is simple: restore service quickly and prevent the issue from happening again. But in practice, incident response often involves multiple steps and stakeholders, including alert monitoring, root cause analysis, ticketing, escalation, communication, and documentation.
It’s a critical function for keeping systems stable, minimizing downtime, and protecting the business from costly disruptions.
Traditionally, incident response is reactive and manual—driven by processes, playbooks, and on-call rotations. As systems grow more complex, many IT teams are shifting toward automated and intelligent approaches that can help them respond faster and with greater accuracy.
What is an IT incident response plan?
An incident response plan is a documented strategy that outlines how your ITOps team will detect, respond to, and recover from system issues or disruptions.
It typically includes:
Clear roles and responsibilities, essentially who does what during an incident.
Step-by-step procedures for identifying, prioritizing, and resolving issues.
Escalation paths and communication protocols.
Guidelines for documenting and learning from each incident.
The goal of an incident response plan is to make sure your team can act quickly and consistently, even under pressure. It helps reduce downtime, improve response time, and avoid repeated mistakes.
Who handles incident response?
Incident response is typically handled by a cross-functional team that includes people with different areas of expertise. Who gets involved depends on the size of the organization and the severity of the incident, but common roles include:
IT operations teams: Often the first to detect and respond to infrastructure issues. They monitor systems, triage alerts, and initiate fixes.
Site Reliability Engineers (SREs) or DevOps teams: Step in for complex or recurring incidents, especially when root cause analysis or service architecture changes are needed.
Support and service desk staff: Handle incoming tickets and user reports, escalate issues, and help communicate status updates.
Incident commander or response lead: In more formal setups, one person owns coordination, makes decisions, and keeps the response on track.
Communications or stakeholder liaison: For major incidents, someone may be assigned to keep business stakeholders, leadership, or customers informed.
Regardless of structure, the goal is the same: restore service fast, limit impact, and prevent the issue from recurring.
Phases of the incident response life cycle
Incident response is about having a consistent, repeatable process to handle problems efficiently. Most IT teams follow a version of the same core life cycle, whether the issue is a server crash, a misconfigured service, or a performance bottleneck.
Here are the 6 key phases:
1. Detection and alerting
Goal: Spot the incident quickly and trigger a timely response.
The process starts when a system identifies something unusual, such as a spike in latency, a failed service, or a critical error. This might come from monitoring tools, logs, or user reports.
2. Triage and prioritization
Goal: Decide what to fix first—and fast.
Once an alert is triggered, the team assesses its severity. Is it impacting users? Is it isolated or spreading? The goal is to filter signals from noise and focus on what matters most.
3. Investigation and diagnosis
Goal: Find out what’s actually broken and why.
Next, the team works to understand the root cause. That usually means digging into logs, checking system dependencies, and comparing changes or configurations across environments.
4. Containment and resolution
Goal: Stop the bleeding and restore service.
With the cause identified, the team takes action. This could mean restarting services, rolling back code, fixing a configuration, or applying a patch—whatever it takes to get systems back to normal. “Bleeding” here isn’t just metaphorical; it can mean real-world disruptions like delayed patient care, halted payment processing, or critical workflows grinding to a halt. The priority is to minimize impact and restore normalcy as fast as possible.
5. Communication and coordination
Goal: Keep everyone aligned and in the loop.
Throughout the process, teams need to keep stakeholders informed, whether that’s internal leadership, affected users, or customer support teams. Clear, timely updates help manage expectations and reduce chaos.
6. Post-incident review
Goal: Turn incidents into insights.
After resolution, there’s a chance to step back and learn. What caused the issue? How fast did we respond? What can we improve for next time? This stage is where teams build muscle memory and reduce repeat problems.
Modern IT teams are also automating many of these steps—especially triage, diagnosis, and even early-stage resolution—with solutions that bring intelligence into the response flow. (More on that next.)
Use Edwin AI for incident response
That shift toward intelligent automation is where Edwin AI fits in.
Built specifically for IT operations, Edwin is the AI agent for ITOps. But behind that single interface is something more powerful: a system of specialized agents working together in real time. Each one is designed for a specific task—triage, correlation, root cause analysis, resolution—and they operate as a coordinated team, not a monolith.
To your team, Edwin feels like one expert. But under the hood, it’s many—working in sync to analyze data, surface insights, and take action with speed and precision. It’s designed to take on the most manual, time-consuming parts of incident response—triage, correlation, root cause analysis—and automate them with speed and context.
Instead of flooding teams with disconnected alerts, Edwin AI connects the dots. It ingests data across your stack—logs, metrics, config data, tickets, change events, etc.—and analyzes that info in real time to surface the problems that matter most, along with what’s likely causing them and what to do next.
Edwin AI is about improving consistency, reducing escalation, and helping teams respond to incidents with more confidence and less guesswork. In environments where manual IT incident response is no longer sustainable, Edwin AI helps teams move faster, with fewer mistakes—and fewer surprises.
What sets Edwin AI apart from traditional AIOps products
Edwin AI doesn’t just detect that “something’s wrong”—it tells you what’s wrong, why it’s happening, whether it’s happened before, and what to do about it. All in near real-time, without waiting for a human to parse logs or search past tickets.
Capability
Edwin AI
Traditional AIOps
Generative AI summaries
✅ Built-in
❌ Limited or unavailable
Hybrid dataset correlation
✅ Operational + contextual
⚠ Often siloed
Transparent, explainable AI
✅ Open, configurable
❌ Often black-box
Fast time to value
✅ Live in days
⚠ Months or longer
Built-in integrations
✅ 3,000+ with full-stack visibility
⚠ Requires custom work
Edwin AI doesn’t replace your team—it amplifies it. It cuts through noise, delivers insights in context, and routes incidents to the right teams automatically. Whether you’re starting with Event Intelligence or implementing the full AI Agent, Edwin AI helps your team shift from reactive triage to strategic ops.
How Edwin AI works
Edwin AI is designed to mirror—and improve—every phase of the incident response lifecycle. Where traditional workflows rely on human effort and coordination, Edwin AI brings speed, consistency, and automation to each step.
1. Detection and alerting → Observe
Edwin AI starts with observability, ingesting alerts, metrics, logs, and events across your hybrid environment. It consolidates these signals from multiple sources, so you don’t miss early warning signs—or waste time chasing noise.
2. Triage and prioritization → Correlate
Instead of treating each alert in isolation, Edwin AI correlates related events using time-series analysis, dependency mapping, and system context. This approach narrows down the scope and identifies high-impact issues automatically.
3. Investigation and diagnosis → Reason
Edwin AI analyzes the incident in context—drawing on historical patterns, recent changes, asset metadata, and known fixes. It identifies likely root causes and explains its reasoning, giving teams the clarity they need to act with confidence.
4. Containment and resolution → Act (or recommend)
Edwin AI can auto-populate tickets with root cause summaries, attach supporting evidence, and route issues to the right team. In environments with pre-defined playbooks, it can even recommend or execute remediation steps.
5. Communication and coordination → Summarize
Using generative AI, Edwin AI produces clear, human-readable summaries of the incident: what happened, what caused it, and what should happen next. This context travels with the ticket, keeping everyone, from on-call engineers to execs, informed.
6. Post-Incident Review → Continuous Learning
Every time Edwin AI observes, correlates, or resolves an issue, it gets smarter. It builds a knowledge graph of incident fingerprints, asset behaviors, and successful resolutions—enabling it to improve its recommendations over time.
Edwin AI doesn’t force you to rethink your entire workflow; it builds on what already works and removes what slows you down. It makes every phase of it faster, clearer, and more consistent.
Where agentic AIOps wins
Traditional tools were built to notify you when something breaks. Agentic AIOps is built to help you fix it—faster, smarter, and with less guesswork.
After walking through how Edwin AI mirrors and enhances each phase of the incident response lifecycle, it’s worth zooming in on where those improvements have the biggest impact. These are the moments where automation is a force multiplier.
1. Get to the “why” faster
Manual triage and inconsistent root cause analysis slow everything down. Engineers waste hours stitching together logs and metrics, only to escalate what they can’t fully explain.
What Edwin AI does:
Clusters noisy alerts into meaningful event groups.
Maps dependencies and timelines to understand causal flow.
Highlights the most likely root cause with supporting evidence.
Why it matters:
Reduces investigation time significantly.
Empowers junior team members to handle complex incidents.
Improves signal-to-noise ratio across sprawling environments.
“Edwin AI started correlating and delivering value within an hour, even before we put it into production.” — Kris Manning, Global Head of IT Networks, Syngenta
Too many teams treat recurring incidents like new problems. Fixes live in tribal knowledge, and past context is rarely reused efficiently.
What Edwin AI does:
Learns from past incidents and their resolutions.
Matches new issues to historical patterns.
Recommends validated fixes with context attached.
Why it matters:
Speeds up resolution by applying known solutions.
Delivers more consistent responses, regardless of who’s on call.
Converts one-off knowledge into institutional memory.
“We were seeing more than 1,000 alerts a day—30,000 a month. That’s too much for any team to manage manually. Edwin AI helps us focus on what actually matters.” — Shawn Landreth, VP of Networking and Reliability Engineering, Capital Group
Learn how AI-driven insights can transform your IT operations in from Capital Group’s Shawn Landreth.
3. Proactively detect systemic risk
Recurring alerts often point to deeper systemic problems, but without time to step back, teams miss the big picture until it’s too late.
What Edwin AI does:
Analyzes long-term patterns and event timelines
Flags recurring issues by service group, asset class, or dependency layer
Correlates problems with changes, deployments, and config drift
Why it matters:
Helps identify root-level infrastructure or design flaws
Reduces repeated incidents and unplanned downtime
Enables teams to shift from reactive triage to proactive reliability work
“We’re firefighters sometimes… AI helps us mitigate everything that has an impact on the customer side.”— Gaël Grootaert, Group Director, Devoteam Managed Services
Rethinking incident response starts here
Incident response hasn’t kept up with the systems it supports.
Most teams are still dealing with alert storms, manual triage, and inconsistent resolution paths. Even with good people and solid processes, the old way just can’t scale.
What we’ve seen from teams using Edwin AI—across industries, team sizes, and use cases—is this: When incident response is handled by agents that understand context, history, and impact, the work gets faster. More consistent. Less reactive. And a whole lot less exhausting.
If you’re still stitching together dashboards and parsing logs by hand, it might be time to rethink how your team operates. Not by starting over—but by upgrading what’s already there.
You don’t need to solve everything all at once. But you can start solving the stuff that slows you down most.
Edwin AI is one way to do that. And it’s working—for real teams, right now.
See how agentic AI will transform your IT issue response.
Current as of: Feb 9, 2024
LogicMonitor Business Operations
LogicMonitor’s business operations are performed out of the following locations:
Entity
Services
Data Residency
LogicMonitor, Inc.
Software Development Product Operations Customer Support Professional Services
Santa Barbara CA Austin TX Boston MA New York City NY
LogicMonitor UK Limited
Customer Support Professional Services
London UK
LogicMonitor Australia Pty. Ltd.
Professional Services
Sydney AU
LogicMonitor Asia Pacific Pte. Ltd.
Customer Support
Singapore
LogicMonitor India LLP
Software Development Customer Support
Pune IN
Unomaly AB
Software Development
Stockholm SE
Service Centers
LogicMonitor operates our service platform out of the following locations. Each customer may select their preferred Service Center upon initiation of service:
Service Center
Location(s)
Data Residency
US / West
Boardman OR
United States
US / East
Ashburn VA
United States
EMEA / West
London
England
EU / West
Dublin IE
Ireland
APAC / South East
Sydney
Australia
EMEA / West (Legacy)*
Slough UK
United Kingdom
*Indicates that a legacy Service Center(s) may not be eligible for new customers.
Data Subprocessors
The following data subprocessors provide ancillary services that support the LogicMonitor platform:
This Edwin AI “Addendum” amends the LogicMonitor Master Subscription Agreement (the “MSA”) available at https://www.logicmonitor.com/msa, or your signed agreement with LogicMonitor. This Addendum governs your use of LogicMonitor’s large language model (LLM) features and functionalities (the “Edwin AI Features”).
THIS ADDENDUM IS EFFECTIVE AS OF THE DATE YOU FIRST ACCESS OR USE THE EDWIN AI FEATURES. IF YOU WISH TO TURN OFF THE EDWIN AI FEATURES, YOU MUST PROVIDE A NOTIFICATION TO YOUR DESIGNATED CUSTOMER SUCCESS MANAGER OR OTHER CONTACT, OR THESE TERMS WILL CONTINUE TO APPLY. THE EDWIN AI FEATURES ARE INTENDED TO BE USED WITH THE ACCEPTABLE USE POLICY DEFINED BELOW.
Edwin AI Features. LogicMonitor’s Edwin AI Features provide enhanced capabilities within the LogicMonitor platform, including but not limited to:
Automated Remediation: Edwin AI Features may suggest or automate responses to system alerts or anomalies.
Predictive Analysis: Edwin AI Features may analyze data to predict potential issues and recommend preventative actions.
Natural Language Interface: Edwin AI Features may enable users to interact with the LogicMonitor platform using natural language commands or queries.
Customer Responsibilities. You acknowledge and agree that:
Accuracy: While LogicMonitor strives for accuracy, Edwin AI Features are inherently probabilistic and may not always produce perfect results. The Edwin AI Features rely on your input data for accuracy, and you are solely responsible for validating the accuracy of any information or actions generated by the Edwin AI Features.
Human Oversight Required: Edwin AI Features are intended to augment, not replace, human oversight. You will not engage any Edwin AI Feature(s) for uses that are prohibited, such as those in the EU AI Act, and you will remain responsible for monitoring its systems and making informed decisions based on all available information, subject to human oversight.
Acceptable Use Policy: You agree to comply with LogicMonitor’s “AI Acceptable Use Policy”, available at https://www.logicmonitor.com/ai-acceptable-use-policy, which governs the permissible uses of LogicMonitor’s AI services, including the Edwin AI Features. The AI Acceptable Use Policy is incorporated into this Addendum by reference.
Prohibited Actions: Use of Edwin AI Features is prohibited for purposes of profiling, healthcare triage, or predicting the criminal behavior, or health outcomes, or legal decisions and outcomes for any individual.
LogicMonitor Responsibilities. LogicMonitor will:
Reasonable Efforts: Use commercially reasonable efforts to provide and maintain the Edwin AI Features.
Data Security: Implement appropriate technical and organizational measures to protect your data processed by the Edwin AI Features.
Transparency: Provide clear documentation and guidance on the capabilities and limitations of the Edwin AI Features.
AI Models & Training: For purposes of this Addendum, the term “model” means a type of artificial intelligence (AI) that is trained on a large dataset of text and code. Specifically a large language model, or “LLM”, can be used to generate text, translate languages, write different kinds of creative content, and answer your questions in an informative way.
Model Use. LogicMonitor’s processes are designed to ensure that only models are selected that have undergone security evaluations, and have been developed in accordance with industry practices for secure model development. The models applicable to the Edwin AI Features are listed in the applicable documentation. Subject to the requirements above, LogicMonitor may use different models or versions based on the task that needs to be completed. Please see below, however, currently, you are not able to choose which specific LLM models are used.
Customer-Specific Models: For models developed by LogicMonitor, any models will be specific to you (as the customer). Your Customer data will not be shared outside of LogicMonitor or with other customers. Your Customer data will not be used to cross-train other models used by other customers.
Third-Party LLMs: Your Customer data will not be used to train third-party LLMs such as OpenAI’s models. Your Customer data will also not be used to train or improve Microsoft’s products or any other third-party services.
Data Sharing:
Your Customer data is not shared with other customers, and your Customer data is split into different datastores that do not overlap with other customers.
Except as needed to provide the Edwin AI Features, your Customer data will not be used by or shared with other vendors, including Microsoft and OpenAI. Microsoft has an established Responsible AI framework along with strict security requirements, ensuring that your Customer data stays within the designated Azure environment. Additionally, Azure OpenAI supplies isolated network security, which segregates client data and applications to prevent cross-contamination.
Data Storage:
Data Stored: A range of data is stored within Edwin AI, such as ServiceNow Incidents, knowledge base articles from third-party sources, and other data that the customer enables to be sent to Edwin. You can choose to stop sending data at any time.
Abuse Monitoring: LogicMonitor utilizes Azure’s abuse monitoring to ensure the platform is not being used for malicious purposes. Your Customer data may be stored for up to 30 days within Azure, but only for the purpose of safety evaluation and abuse monitoring. Retained data will not be used for training purposes or sent to third-party vendors.
Data Processed: LogicMonitor’s Edwin AI currently utilizes any data available within Edwin AI, which primarily includes alert information and any additional information configured to be sent to Edwin AI.
Data Residency:
Data stored within Edwin AI complies with data residency regulations. Due to limitations in Azure OpenAI’s models, LogicMonitor has a global deployment for access to the LLMs. While Customer data will stay stored in its region, LogicMonitor may process data in an outside region (as described in the LogicMonitor DPA).
If you are located within the European Union (EU), United Kingdom (UK), or Australia or the pacific region (collectively called “APAC”), you will need to opt in to the GenAI Assist features. For more information on data residency, refer to the DPA.
Updates and Modifications; Governing Law; Entire Agreement
LogicMonitor may update or modify the Edwin AI Features and this Addendum from time to time, by updating the terms at this hyperlink. LogicMonitor will provide reasonable notice of any material changes. This Addendum, together with the MSA, constitutes the entire agreement between the parties with respect to the Edwin AI Features and supersedes all prior or contemporaneous communications, representations, or agreements, whether oral or written. This Addendum shall be governed by and construed by the governing law provision in the MSA.
Limitations of Liability. Notwithstanding anything to the contrary in any other document or agreement, the parties agree that the limitations of liability and disclaimer of damages from the MSA will apply to this Addendum and the Edwin AI Features.
Optional Subprocessors
Generally. By choosing to purchase and enable the Edwin AI Features, you acknowledge that these Edwin AI Features utilize Microsoft Azure’s services as a Sub-processor (described further in the LogicMonitor DPA), and Customer consents to the use of the following Subprocessors, which are hereby added to the LogicMonitor Data Handling Supplement:
Data Subprocessor
Applicable Service
Data Residency
Microsoft Azure
Hosted Compute and LLM
United States (see below for data center locations)
OpenAI
Large Language Model
United States
Microsoft Azure: Provides cloud infrastructure and services for hosting and processing data related to the optional features.
Microsoft Azure Data Center Locations: The optional features may utilize Microsoft Azure services hosted in the following data center locations:
North America: East US, Central US, West US, Canada Central
Europe: West Europe, North Europe, France Central
Asia Pacific: Southeast Asia, East Asia, Australia East, Japan East
OpenAI: Provides large language models and APIs used for natural language processing and generation in the optional features.
Compliance. LogicMonitor will ensure that these Subprocessors comply with the data processing and security obligations as outlined in this Addendum and the MSA. You acknowledge that the use of these optional features may involve the transfer of data to Subprocessors located outside of your geographic region, if the Microsoft Azure Data Center Location is not located in the same region as your selected deployment region in AWS. Please see the locations listed above.
Last Updated: February 2025
Notice to Government / Public Sector Customers: If these Terms (defined below) are referenced in your Order Form between you and LogicMonitor, these Terms will apply to your LogicMonitor subscription and supersede and replace any contrary terms in the online LogicMonitor Master Services Agreement. If you are using the Services on behalf of an entity or organization that you represent: (a) all references to “Customer” are to that entity or organization and (b) you represent and warrant that you are at least 18 years of age (or have otherwise reached the age of majority where you reside) and that you have the right, power and authority to enter into this Agreement on behalf of Customer. If you do not agree to the terms of this Agreement, do not access the Service or download and install the Collector Software.
1. AGREEMENT.
This Public Sector Master Services Agreement (these “Terms” or this “Agreement”) is entered into as of the last date of signature on the Order Form or this Agreement (the “Effective Date”), by and between LogicMonitor, Inc., a Delaware corporation having its headquarters at 820 State St., 5th Floor, Santa Barbara, CA 93101 U.S.A. (below referred to as “LogicMonitor,” “we,” “our”, “us” or “Company”) and the corporation or other legal entity set forth on the Order Form (below referred to as “Customer”, “you” or “your”), and will govern the use of the LogicMonitor hosted data center monitoring services (the “Service” or “Services”) and any associated use of the LogicMonitor Technology offered by LogicMonitor, Inc. Customer and LogicMonitor are sometimes hereinafter referred to individually as a “party” and collectively as the “parties”.
2. YOUR SUBSCRIPTION.
A. We offer subscription-based Services. By subscribing to the Services, you have a limited, non-exclusive, royalty-free (apart from the Services fees due to LogicMonitor), non-transferable and terminable license to access and to use the Services solely for your internal business operations during your subscription period specified on the applicable order form through which the Services are ordered (each an “Order Form”). You are expressly prohibited from sublicensing use of the Services to third parties. However, you may choose to offer access to and use of the Services to your Affiliates, provided that (i) you shall remain the contracting party with us with respect to the payment of fees and all access and use; and (ii) you hereby agree that you shall retain full, unconditional responsibility for all such access to and use of the Services and LogicMonitor Technology and all compliance herewith. “Affiliate” means a corporation or other legal entity which a party owns or controls, is controlled by or is under common control with such entity through ownership or control of more than 50% of the shares entitled to vote. You hereby agree that neither you nor your Affiliates or customers shall take any action intended to interfere with or disrupt the Services or any other user’s use of the Services.
B. Support. LogicMonitor will provide any technical support included with your subscription purchase in accordance with the terms of your applicable support plan, as described at https://www.logicmonitor.com/legal/technical-support-exhibit. Customer will automatically be enrolled in the basic support plan at no additional charge. Premier support plans are available for purchase and, if applicable, will be set forth on your Order Form.
C. We shall use commercially reasonable efforts to make the Services available 24 hours a day, 7 days a week during the Term, except for: (i) Planned Maintenance. “Planned Maintenance” means maintenance where at least forty-eight (48) hours prior notice is provided via email based on your account settings within the Services, or by using Notification capabilities within the Services (see https://support.logicmonitor.com/). Planned Maintenance shall be conducted only during the hours of 6:00p.m. to 12:00a.m. Pacific Time and shall not exceed (a) 8 hours in any given month, or (b) 40 hours in any given year. Downtime will be minimized at all times and if the expected impact of planned operations is less than five (5) minutes of downtime, we may elect not to give advance notice; or (ii) Extraordinary Circumstances. “Extraordinary Circumstances” means any unavailability caused by circumstances beyond our reasonable control, including without limitation, acts of God, acts of government (including U.S. sanctions or embargoes), flood, fire, earthquakes, civil unrest, acts of terror, strikes or other labor problems, or Internet outages or delays.
D. Your use of the Services is expressly only licensed for the duration of the Term and any trial period while you are and remain a current customer in good standing. You acknowledge and agree that you will not have access to historical information or data related to your use of the Services upon expiration or termination of your use of the Services; provided, however, that we agree to assist upon your request prior to termination to download all such available data.
E. Professional Services. Professional Services may be included in your Order Form upon request. Fees, coverage and terms for Professional Services are available from LogicMonitor and will be set forth on your Order Form and/or a separate statement of work for such Professional Services. “Professional Services” means services provided by LogicMonitor personnel on a time and materials or fixed price basis for a customer-identified project or scope of work.
F. Beta Services. LogicMonitor may make certain features or functionality available in a controlled beta test, private preview, or similar specially designated program (“Beta Program”) involving pre-release features or functionality that may be subject to change, or discontinuation (“Beta Test”). Free Beta Test product(s) are provided on an early release basis, and are not intended to function as a generally available offering, subject to the applicable Beta Program rules.
3. SUBSCRIPTION FEES, BILLING AND RENEWAL.
A. Paid Subscription. By subscribing to the Services, you expressly agree to pay subscription fees corresponding to your subscription plan, plus any applicable taxes and duties, if any. Subscription fees are fully earned upon payment and, except as otherwise specified herein, the payments are nonrefundable and there are no refunds or credits for partial subscription periods. (i) Your Subscription. Except as otherwise set forth on your Order for the Services, fees are billed as of the Service commencement date for the entire initial subscription period set forth on the Order (the “Initial Term”) and for each additional renewal period of the same length (a “Renewal Term”), for the initial quantity commitment specified in the Order (the “Reserved Commitment”), net of any contractual discount. The period of your use of the Services during the Initial Term and each Renewal Term under this Agreement is referred to as the “Term”.(ii) Any increase in the actual usage beyond the Reserved Commitment will be billed to you by LogicMonitor for each month of Service, upon the end of the applicable month, via invoice at the applicable overage pricing rate set forth on your Order Form. Such invoiced amounts, if applicable, shall be due and payable in accordance with this Agreement. Usage of the Service is calculated in accordance with the methodology set forth below.
A1. No Overages for Public Sector Entities. In consideration of Customer’s status as a government or public sector entity, LogicMonitor agrees to waive any charges incurred during the initial year of the subscription Term that arise from Customer exceeding the committed quantities specified in the applicable subscription. This is provided that Customer acknowledges and agrees that any waived fees shall constitute actual, truthful cost or usage data pursuant to applicable laws and regulations, and that the inclusion of these costs in the consideration for pricing for any subsequent year(s) or subscription renewal is fair and reasonable in the ordinary course of business. Upon the second year of a subscription Term, or renewal of such, the parties shall negotiate in good faith to adjust pricing, incorporating the average waived excess usage fees from the initial year of the Term, to the extent allowed under applicable law (called the “Informed Accurate Pricing Difference”). If the parties fail to reach a negotiated price, based on the excess Usage, LogicMonitor may reduce the applicable discount(s) by such amount(s) to recoup costs associated with the Informed Accurate Pricing Difference.
B. Usage. Your usage of the Service is measured on a calendar month basis. For purposes of measuring usage, a “host” or “device” is a logical host defined by a network (IP) address, physical, virtual, or cloud. Host or device usage is measured by the average over a month. Specific LogicMonitor services such as Edwin AI, Logs, and APM are measured in terms of the total usage over a calendar month, see usage docs here: https://www.logicmonitor.com/support/usage-reporting. Overage fees shall only apply if usage for a month exceeds the Reserved Commitment..
C. Payment Methods. Unless otherwise set forth on an Order Form, during the registration process, you will choose a business charge card or U.S. domestic electronic funds transfer (“ACH”) bank account for directly charging your subscription fees. You hereby authorize us to automatically debit your designated charge card or ACH bank account for the subscription fees until you cancel your subscription, and we reserve the right to delay or suspend access to the Service unless these accounts are designated and maintained. If you would like to change your payment method or details, such as your credit card validity or expiration date, you may access and edit your account information through our application. LogicMonitor uses a third-party intermediary to manage credit card processing and this intermediary is not permitted to store, retain nor use your billing information except to process your credit card information for the LogicMonitor Service.
D. When Payments are Due. All payments shall be due and payable as described in the applicable Order Form (the “due date”). You are responsible for paying any taxes (including without limitation any sales, use or withholding taxes now or hereafter enacted), and any duties, excises or tariffs (together “duties”), that are applicable to receipt of the Service (provided that you shall not be responsible for any taxes based on LogicMonitor’s income). All payments hereunder shall be made without deduction for taxes or duties of any kind or nature. However, if LogicMonitor determines in its sole judgment that we are legally obligated to add taxes to your service fees, LogicMonitor will include such taxes in your Service Agreement or invoices and the full amount inclusive of such taxes will be due and paid. Late payments will be subject to late fees at the rate of one percent (1%) per month, or, if lower, the maximum rate allowed by law. LogicMonitor’s obligations under this Agreement are conditioned upon your timely payment. If you fail to pay fees within thirty (30) days following the payment due date, LogicMonitor has the right to suspend performance of the Service and seek all remedies available, and you agree to reimburse our reasonable expenses, including attorneys’ and other fees incurred in collecting amounts due. Payments received after default shall be applied against interest, expenses, and principal as LogicMonitor determines in its sole discretion. The Service will be reinstated at our discretion after all current and overdue amounts and accumulated late fees and expenses are paid.
4. TERM AND TERMINATION.
This Agreement is in force from the Effective Date (or, if earlier, the first date of your use of the Services or Software) and, subject to any earlier termination permitted in this Agreement, will remain in force throughout the Term. Except where your early termination is pursuant to LogicMonitor’s uncured material breach (pursuant to subsection (A) below) (in which case we will promptly refund to you the prepaid fees (if any) for that portion of the terminated period for which Services were not provided), early termination of a subscription or ceasing your use of the Services will not result in a refund of any prepaid fees or modify your obligation to pay fees for the remainder of the then current Term. Either party may terminate this Agreement during the Term by written notice: (A) if the other party breaches any material term or condition of this Agreement and, assuming such default is capable of cure, fails to cure such default within thirty (30) days after written notice specifying the default (“Notice of Default”), (B) if the other party becomes insolvent or admits in writing its inability to pay its debts as they mature or makes an assignment for the benefit of creditors; or (C) if a petition under the United States Bankruptcy Act, as it now exists or as it may be amended, or any similar law of any other jurisdiction, is filed concerning the other party. Additionally, immediately upon the detection of suspicious circumstances or behavior, or the receipt of information we believe is credible regarding the unauthorized use or disclosure of your data or of a demonstrable threat to either your data or the LogicMonitor Technology, LogicMonitor has the right to suspend the access to or use of the Service or LogicMonitor Technology by your authorized users. In such event, we will provide a prompt, written description of the issue(s) or event(s) resulting in the suspension, and you agree to regularly communicate with our support team, and work in good faith to resolve the matter promptly. For the avoidance of doubt, we are not responsible for, and termination under this Section will not apply when any delay in restoration of services is related to your failure to provide prompt responses, reasonable assistance, and cooperation with us. If the matter is not resolved within ten (10) days of suspension, either party has the right to terminate the Agreement upon written notice, and assuming the suspension was not prompted by Customer’s uncured breach, LogicMonitor will promptly refund the prepaid fees (if any) covering that portion of the terminated period for which Services were not provided.
5. OUR TECHNOLOGY.
A. The Services are enabled by and utilize a hosted software application (the “LogicMonitor Software”). We shall host the LogicMonitor Software and may update the functionality and user interface of the LogicMonitor Software from time to time in our sole discretion as part of our ongoing mission to improve the Services and our users’ use of the Services, provided that such modifications will not materially decrease the functionality of the Services. You must have access to the LogicMonitor Software in order to use the Services. In addition, to use the Services fully, you will be required to download and install a piece of our software on your network (the “Collector Software” and collectively with the LogicMonitor Software, the “Software”).
B. You agree that the rights granted to you are provided on the condition that you will not (and will not allow, give permission to or enable any third party, including without limitation any customer or Affiliate, to) copy, create a Derivative Work of, or reverse engineer, reverse assemble, disassemble, or decompile the Software or any part thereof or otherwise attempt to discover any source code, modify the Software in any manner or form, or use unauthorized modified versions of the Software, including (without limitation) for the purpose of building a similar or competitive product or service or for the purpose of obtaining unauthorized access to the Services. “Derivative Work” means any modification of or extension to any software, process, algorithm, trade secret, work of authorship, invention, or to any other intellectual property right therein or thereto.
C. License. Subject to your compliance with the terms of this Agreement, we hereby grant to you a limited, non-exclusive, royalty-free (apart from the fees paid to LogicMonitor for the Services), non-transferable license to download, install and use the Collector Software (in object code form) onto your network for internal business purposes for the sole purpose of using the LogicMonitor Service. The Software is not sold but licensed hereunder.
6. OWNERSHIP.
A. LogicMonitor Technology. You acknowledge and agree that the LogicMonitor Software, including the specific design and structure of individual programs, components and aspects thereof, constitutes the proprietary trade secrets and copyrighted material of LogicMonitor, and that LogicMonitor owns all rights, title and interest in and to the Services, the Software, Feedback and all technology, information, trade secrets, patent rights, copyrights, know-how and documentation associated therewith as provided or otherwise made available by LogicMonitor and used in the performance of the Services, including all intellectual property rights and Derivative Works therein, on a worldwide basis (collectively, the “LogicMonitor Technology”). As used herein, “Feedback” means bug reports, suggestions, comments or other feedback provided by Customer to LogicMonitor with respect to the Service, excluding any Customer Confidential Information. The license granted to you is limited by these Terms and does not convey any other rights in the LogicMonitor Technology, express or implied, nor does it grant any ownership in the LogicMonitor Technology or any intellectual property rights therein or thereto. Any rights not expressly granted herein are reserved by LogicMonitor.
B. Customer Data. You retain all right, title and interest in and to all Customer Data. “Customer Data” means electronic data, files or information submitted by Customer to the Service. LogicMonitor’s right to access and use Customer Data is limited to the right to access and use such Customer Data for the purpose of providing the Service or as may otherwise be explicitly set forth in this Agreement. No other rights with respect to your Customer Data are implied. Customer Data shall at all times be classified and treated as Confidential Information hereunder.
C. Implementations. Excluding your Confidential Information, and any applicable Personal Data, you agree that if you make any customizations or customized implementations of the Software or LogicMonitor Technology that do not qualify as Derivative Works (“Implementations”), such Implementations are hereby licensed to us on a non-confidential, nonexclusive, irrevocable, worldwide, royalty-free, sublicensable basis to perform services, use, distribute, publish, display, copy, sell, have sold, make, have made, create Derivative Works of, import, export, and license the Implementations and products and services utilizing or incorporating the Implementations, and to otherwise commercially exploit the same. If any integrations with third party tools, platforms or programs are implemented for your use in conjunction with the Service, you agree that LogicMonitor has no obligation to support the same.
D. Copyright and Proprietary Legends. You agree not to remove any copyright or proprietary legends in the LogicMonitor Technology, and to implement reasonable security measures to protect our proprietary rights therein from unauthorized use or disclosure. Certain marks, words and logos displayed on the Services, which may or may not be designated by a “™” “®” “SM” or other similar designation, constitute trademarks, trade names, or service marks belonging to us or our licensors. Except as necessary for you to make use of the Services in accordance with the license rights herein, you are not authorized to use any such marks. Ownership of all such marks and the goodwill associated therewith remains with us or our respective licensors.
7. CONFIDENTIALITY.
. The parties agree that during the course of performance under these Terms, each party may disclose to the other party certain technical and/or non-technical information, which (i) is disclosed in a tangible or visual form and clearly labeled as “Confidential”; (ii) is disclosed in an oral, non-tangible or visual form, identified at the time of disclosure as confidential and confirmed in writing within thirty (30) days; or (iii) is identified and treated as confidential by disclosing party and given the circumstances of disclosure, and/or the nature of the information, the recipient knew or should reasonably have known the information was confidential (collectively, the “Confidential Information”). For purposes of clarification and in addition to the Confidential Information addressed in the previous sentence, LogicMonitor Technology shall be deemed our Confidential Information and all Customer Data shall be deemed your Confidential Information. Confidential Information does not include information, technical data or know-how which (a) is rightfully in the possession of the receiving party at the time of disclosure as shown by the receiving party’s files and records immediately prior to the time of disclosure; (b) prior to or after the time of disclosure becomes part of the public knowledge or literature, not as a result of any inaction or action of the receiving party; (c) is approved in writing for release by the disclosing party; or (d) is independently developed by the receiving party without use of or reference to any Confidential Information of the disclosing party.
B. Each party agrees not to use the Confidential Information disclosed to it by the other party for any purpose except as necessary to perform its obligations under these Terms. Neither party will disclose the Confidential Information of the other party to third parties or to the first party’s employees except employees and service providers who are required to have the information in order to carry out such party’s obligations hereunder who have agreed in writing, as a condition of employment, engagement or otherwise (or who are otherwise bound by fiduciary duty or rules of professional conduct), to protect the Confidential Information with terms no less stringent than are imposed by this Section; provided, however, that this Agreement may also be disclosed to potential successors in interest (and their respective attorneys and advisors) pursuant to a contemplated merger, acquisition, corporate reorganization or sale of all or substantially all of a party’s assets, so long as such recipient in each case has agreed in writing to protect the Confidential Information with terms no less stringent than are imposed by this Section. Notwithstanding the above, LogicMonitor may use data about Customer’s configuration and use of the Service that has been aggregated and/or anonymized (collectively, “Usage Data”) in order to (i) measure general Service usage patterns and characteristics of its user base and/or (ii) to improve the Service and develop new insights and features, and may include such Usage Data in promotional materials or reports to third parties; provided, that, for the avoidance of doubt, (x) such Usage Data is rendered in such a manner that does not allow a third party to identify Customer or its suppliers, customers, contractors, agents, affiliates, or subsidiaries and (y) such Usage Data does not reference Personal Data, names, phone numbers, email addresses, or other personally identifiable information. “Personal Data” generally means nonpublic, personally identifiable information of or concerning any living individual among the consumers, employees, clients and customers of Customer or LogicMonitor, their parents, subsidiaries, affiliates and agents. Each party agrees that it will use the same standard of care that it uses in protecting its own Confidential Information, but in no case less than reasonable care. Each party agrees to promptly notify the other in writing of any misuse or misappropriation of Confidential Information of the other party that may come to its attention.
C. The confidentiality and non-use obligations of each receiving party under this Agreement will survive expiration or termination of this Agreement for a period of five (5) years; except that such obligations shall survive indefinitely with respect to (i) Personal Data, and (ii) each disclosing party’s software and technology-based trade secrets so long as they remain eligible for trade secret under prevailing law (without regard to any breach of the receiving party). In the event of any expiration or termination of these Terms, or upon request by the disclosing party, the receiving party shall cease all use of the other party’s Confidential Information and return to the disclosing party all copies of the disclosing party’s Confidential Information in the receiving party’s possession or control, or destroy the same and certify as to its destruction. The receiving party will not be required to return or immediately destroy an archive copy of the disclosing party’s Confidential Information made for backup purposes in the ordinary course; provided that such archive copy will be subject to the ongoing obligations of confidentiality and non-use contained herein and shall be destroyed in the ordinary course of business not to exceed ninety (90) days, or with respect to Personal Data, such shorter period as is necessary to comply with prevailing law.
D. While the parties understand that incidental capturing of certain nominal Personal Data may occur in connection with the Service (as described in the DPA), the purpose and focus of the Service is on IT systems performance monitoring and not to function as a receptacle or conduit to store, manipulate, transmit or retrieve Restricted Data. As used herein, “Restricted Data” means (i) Protected Health Information, as such term is defined under the U.S. Health Insurance Portability and Accountability Act, (ii) financial account data or payment cardholder information under PCI Data Security Standard, (iii) Personal Data beyond that which is incidental to the Service and described in the DPA, and/or (iv) any other data that is subject to specific or heightened requirements under applicable law or industry standards, such as Social Security numbers in the United States. Without limiting its other obligations under this Agreement, and subject to the foregoing caveat regarding collection of certain nominal Personal Data, the parties agree that (x) you shall not provide Restricted Data to LogicMonitor, and shall configure the Collector Software so that it will be used only to collect information from devices and applications using methodology which will not expose or divulge Restricted Data; (y) you will not send any logs to LogicMonitor that contain Restricted Data; and (z) you will isolate and secure the Software on your systems and network to prevent unauthorized access, use, disclosure and loss using at a minimum industry standard security practices and technologies and as otherwise required by applicable laws.
E. Compelled Disclosure. In the event that the receiving party is required by applicable law, regulation or any competent judicial, supervisory or regulatory body to disclose any of the Confidential Information, the receiving party shall provide the disclosing party with prompt written notice of any such requirement so that the disclosing party may seek a protective order or other appropriate remedy and/or waive compliance with the provisions of this Agreement. If, however in the opinion of the counsel of the receiving party, the receiving party is nonetheless, in the absence of such order or waiver, compelled to disclose such Confidential Information, then it may disclose only such portion of the Confidential Information which, in the opinion of its counsel, the receiving party is compelled to disclose. The receiving party will not oppose any action by the disclosing party to obtain reliable assurance that confidential treatment will be accorded the Confidential Information. The receiving party will reasonably cooperate with the disclosing party in its efforts to obtain a protective order or other appropriate remedy that the disclosing party elects to seek to obtain, in its sole discretion.
F. Each party shall comply with prevailing laws and regulations governing Personal Data, including, without limitation and as may be applicable, the EU General Data Protection Regulation (“GDPR”), the UK General Data Protection Regulation (“UK GDPR”), the California Consumer Privacy Act (“CCPA”), and the California Privacy Rights Act (“CPRA”).
G. Service Provider Attestation (CCPA/CPRA). LogicMonitor is a “Service Provider” as defined under the CCPA and CPRA. Customer discloses Personal Data (as defined under the CCPA and CPRA) to LogicMonitor solely (i) for a valid business purpose and (ii) for LogicMonitor to provide the Services contemplated by this Agreement. LogicMonitor expressly certifies, understands and agrees that except as permitted or required by applicable law, it is prohibited from (1) selling (as defined under the CCPA and CPRA) any of Customer’s Personal Data, (2) retaining, using or disclosing any of Customer’s Personal Data for any commercial purpose other than providing the Services contemplated by this Agreement, (3) retaining, using or disclosing Personal Data outside of the direct business relationship between LogicMonitor and Customer and this Agreement, or (4) combining the personal information that it receives from, or on behalf of, Customer with personal information that it receives from, or on behalf of, another person or persons, or collects from its own interaction with the consumer, provided that LogicMonitor may combine personal information to perform a business purpose in limited circumstances. LogicMonitor understands the prohibitions that are outlined in this Section 7(G) and hereby certifies its compliance therewith. LogicMonitor shall generally not respond to end user requests except to the extent required by law, and shall direct such requests to Customer where feasible. We will notify you in the event that we cannot meet our obligations as a Service Provider under the CCPA, CPRA, and applicable regulations. We will also provide any required information to enable you to comply with a consumer request, if applicable.
I. Security Practices. During the Term, LogicMonitor will implement and maintain administrative, physical and technical safeguards and measures designed to protect against unauthorized access to Customer Data as more fully described here: https://www.logicmonitor.com/security-practices(“Security Practices”). During the Term, LogicMonitor will not materially diminish the protections provided by the Security Practices.
K. Penetration Testing. LogicMonitor performs annual penetration testing on the Service (“Pen Test”). A Pen Test is a simulated attack that may include tools, techniques, and processes to identify vulnerabilities and weaknesses in a computer system, application, service, or environment, that is part of delivery of the Services. You may not conduct any Pen Test without advanced notice, express written consent, and authorization from LogicMonitor. You, not LogicMonitor, are responsible for any resulting issue(s) caused by your Pen Test performed in violation of these restrictions.
8. REPRESENTATIONS AND WARRANTIES.
A. Representations. Each party hereby represents and warrants to the other that (i) such party has the right, power and authority to enter into these Terms and to fully perform all its obligations hereunder; and (ii) the making of these Terms does not violate any agreement existing between such party and any third party.
B. Limited Service Warranty. (i) We warrant that we will deliver and perform the Services in a good and workmanlike manner consistent with applicable industry standards and the functional requirements and technical specifications set forth in the applicable Order Form. (ii) Service Level Terms. We will provide the Services in accordance with the service level terms set forth at https://www.logicmonitor.com/sla (individually or collectively, the “Service Level Terms”), and any remedies for failure to comply with such standards are set forth therein.
C. In the event that Customer notifies LogicMonitor in writing of a breach of the foregoing warranties, LogicMonitor shall use commercially reasonable efforts to correct the reported non-conformity, at no additional charge to Customer, or if LogicMonitor determines such remedy to be impracticable, Customer may terminate this Agreement and receive a prorated refund of fees pre-paid to LogicMonitor for Customer’s use of the Service for the remainder of the then current subscription period. The foregoing remedy shall be Customer’s sole and exclusive remedy for any breach of warranty hereunder; provided, that, remedies available for breach of the Service Level Terms are as set forth in the Service Level Terms.
9. INDEMNIFICATION.
A.By LogicMonitor. We shall, at our own expense, indemnify, defend and hold you harmless from and against any damages and expenses (including reasonable attorneys’ fees) as a result of third party claims, to the extent of any finding that the LogicMonitor Technology, when used in strict compliance with the license rights and use instructions provided by LogicMonitor infringed or misappropriated the intellectual property right(s) of a third party; provided we receive prompt notice and the opportunity to provide the defense and participate in the litigation and settlement negotiations. Notwithstanding the foregoing, we shall have no liability, and shall have no obligation to defend or indemnify you, for any third party claim of infringement to the extent based upon (i) use of other than the then current, unaltered version of the LogicMonitor Technology and applicable Services, unless the infringing portion is also in the then current, unaltered release; (ii) use of the Services or LogicMonitor Technology other than strictly in accordance with our instructions and documentation; or (iii) use, operation or combination of the applicable Services with non-LogicMonitor programs, data, equipment or documentation if such infringement would have been avoided but for such use, operation or combination. In the event the use of any Service or LogicMonitor Technology is, or we believe is likely to be, alleged or held to infringe any third party intellectual property right, we may, at our sole option and expense, (a) procure for you the right to continue using the affected service, (b) replace or modify the affected service with functionally equivalent service so that it does not infringe, or, if either (a) or (b) is not commercially feasible, (c) terminate the Services and refund the fees received by us from you for the affected service for the remaining Term of then-current subscription period. THE FOREGOING CONSTITUTES OUR ENTIRE LIABILITY, AND YOUR SOLE AND EXCLUSIVE REMEDY WITH RESPECT TO ANY THIRD PARTY CLAIMS OF INFRINGEMENT OF INTELLECTUAL PROPERTY RIGHTS OF ANY KIND OR NATURE.
B. [RESERVED]
10. DISCLAIMERS, LIMITATION OF DAMAGES AND LIABILITY.
A. DISCLAIMERS AND EXCLUSIVE REMEDY. EXCEPT FOR THE REPRESENTATIONS AND LIMITED WARRANTY IN SECTIONS 8.A (REPRESENTATIONS) AND 8.B. (LIMITED SERVICE WARRANTY), THE SERVICES AND LOGICMONITOR TECHNOLOGY ARE PROVIDED “AS IS” WITHOUT WARRANTIES OF ANY KIND, EITHER EXPRESS OR IMPLIED OR ANY WARRANTIES ARISING FROM A COURSE OF DEALING OR TRADE USAGE INCLUDING BUT NOT LIMITED TO THE IMPLIED WARRANTIES OF MERCHANTABILITY, NON-INFRINGEMENT, AND FITNESS FOR A PARTICULAR PURPOSE, NOR DO WE WARRANT THAT THE LOGICMONITOR TECHNOLOGY OR SERVICES WILL BE UNINTERRUPTED OR ERROR-FREE, OR REGARDING THE SECURITY, ACCURACY, RELIABILITY, TIMELINESS OR PERFORMANCE OF THE SERVICES. WE MAKE NO WARRANTY ABOUT THE SUITABILITY OF THE LOGICMONITOR TECHNOLOGY OR SERVICES FOR ANY PURPOSE AND DO NOT WARRANT THAT THE LOGICMONITOR TECHNOLOGY OR SERVICES WILL MEET YOUR REQUIREMENTS.CUSTOMER ACKNOWLEDGES AND AGREES THAT LOGICMONITOR SHALL NOT HAVE ANY LIABILITY FOR (I) MODIFICATIONS OR ALTERATIONS TO THE COLLECTOR SOFTWARE MADE BY YOU OR ANY THIRD PARTY NOT AUTHORIZED BY LOGICMONITOR OR (II) CUSTOMER’S USE OF MONITORING SCRIPTS MADE AVAILABLE IN LM EXCHANGE, LOGICMONITOR’S CUSTOMER COMMUNITY, THAT ARE NOT AUTHORED BY LOGICMONITOR. IN ADDITION, ANY SOFTWARE INTENDED TO ASSIST IN ESTIMATING THE COST OR SIZE AND SCOPING OF A CUSTOMER’S NETWORK OR INFRASTRUCTURE IS NOT INTENDED AS A SUBSTITUTE FOR PROFESSIONAL FINANCIAL ADVICE; THE SOFTWARE IS ENTIRELY DEPENDENT ON CUSTOMER-PROVIDED INPUT(S) AND CUSTOMER’S EXPERTISE.
B. INDIRECT AND CONSEQUENTIAL DAMAGES. TO THE MAXIMUM EXTENT PERMITTED BY APPLICABLE LAW, EXCLUDING THE INDEMNIFICATION OBLIGATIONS IN SECTION 9 OR CLAIMS, LIABILITIES OR LOSSES ARISING FROM FRAUD OR INTENTIONAL MISCONDUCT, OR GROSS NEGLIGENCE, IN NO EVENT WILL EITHER PARTY BE LIABLE FOR ANY INDIRECT, SPECIAL, INCIDENTAL, CONSEQUENTIAL OR EXEMPLARY DAMAGES ARISING OUT OF OR IN ANY WAY RELATING TO THESE TERMS, THE SERVICES PROVIDED, OR THE USE OF OR INABILITY TO USE THE SERVICES INCLUDING, WITHOUT LIMITATION, DAMAGES FOR LOSS OF GOODWILL, WORK STOPPAGE, LOST PROFITS, LOSS OF DATA, COMPUTER FAILURE OR ANY AND ALL OTHER COMMERCIAL DAMAGES OR LOSSES EVEN IF ADVISED OF THE POSSIBILITY THEREOF AND REGARDLESS OF THE LEGAL OR EQUITABLE THEORY (CONTRACT, TORT, STRICT LIABILITY OR OTHERWISE) UPON WHICH THE CLAIM IS BASED.
C. LIMITATION OF LIABILITY. EXCEPT WITH RESPECT TO LIABILITIES OR LOSSES ARISING FROM FRAUD OR INTENTIONAL MISCONDUCT, OR GROSS NEGLIGENCE, IN NO EVENT WILL EITHER PARTY’S AGGREGATE, CUMULATIVE LIABILITY ARISING OUT OF OR RELATING TO THESE TERMS AND ALL ORDER FORMS EXCEED (I) THE SUM OF THE AMOUNTS RECEIVED BY AND OWED TO US FROM YOU DURING THE TWELVE (12) MONTHS IMMEDIATELY PRECEDING THE FIRST EVENT GIVING RISE TO LIABILITY, AND (II) TWO (2) TIMES THE AMOUNT IN SUBSECTION (I) WITH RESPECT TO A PARTY’S INDEMNITY OBLIGATIONS UNDER ARTICLE 9 OR LIABILITIES OR LOSSES RESULTING FROM EITHER PARTY’S BREACH OF ITS OBLIGATIONS UNDER ARTICLE 7 (CONFIDENTIALITY), WHICH FOR CLARITY, INCLUDES ALL DATA PRIVACY AND INFORMATION SECURITY OBLIGATIONS. THESE LIMITATIONS ARE CUMULATIVE FOR ALL CLAIMS HOWSOEVER ARISING UNDER ALL AGREEMENTS AND ORDERING DOCUMENTS, AND SHALL APPLY EVEN IF THE REMEDIES PROVIDED IN THIS AGREEMENT SHALL FAIL OF THEIR ESSENTIAL PURPOSE.
D. BASIS OF BARGAIN. YOU ACKNOWLEDGE AND AGREE THAT THE FOREGOING SECTIONS ON WARRANTIES AND DISCLAIMERS, INDEMNIFICATION AND LIMITATION OF LIABILITY FAIRLY ALLOCATE THE RISKS BETWEEN THE PARTIES AND ARE ESSENTIAL ELEMENTS OF THE BASIS OF THE BARGAIN BETWEEN THE PARTIES. YOU EXPRESSLY ACKNOWLEDGE THAT THE FEES THAT WE CHARGE FOR THE SERVICES ARE BASED UPON OUR EXPECTATION THAT THE RISK OF ANY LOSS OR INJURY THAT MAY BE INCURRED BY USE OF THE SERVICES WILL BE BORNE BY YOU AND NOT US AND WERE WE TO ASSUME ANY FURTHER LIABILITY OTHER THAN AS SET FORTH HEREIN, SUCH FEES WOULD OF NECESSITY BE SET SUBSTANTIALLY HIGHER.
11. GENERAL PROVISIONS.
A. Notices. You agree to provide LogicMonitor with your email address, to promptly provide LogicMonitor with any changes to your email address, and to accept emails (or other electronic communications) from LogicMonitor at the email address you specify. Except as otherwise provided in this Agreement, you further agree that LogicMonitor may provide any and all notices, statements, and other communications to you through either email or posting on the Service portal. Notices to you may be provided by email and shall be addressed to the system administrator or user designated by you for your relevant Services account, and in the case of billing-related notices, to the relevant billing contact designated by you. The Company maintains the right to require placement of a valid email address within the Services portal for both billing, Services notification and notices purposes. In no event shall the Company be held liable for negative consequences resulting from a lack of Company notices in the case notification email addresses are not included by you in the Services portal as required. Legal notices to you may at our option also be sent to the address on the Order Form or that you have last provided, and such notices to us should be sent to LogicMonitor, Inc., 820 State St. 5th Floor, Santa Barbara, CA 93101, USA, Attention: Legal Department or by email to [email protected].
B. Governing Law, Jurisdiction and Dispute Resolution. If Customer is a public sector agency, state or local government, or similar public entity, the parties agree to the governing law of the physical headquarters of Customer (or as otherwise required by applicable law). Otherwise, each party agrees to the applicable governing law of the State of California without regard to choice or conflicts of law rules, and except for actions seeking injunctive relief, the parties agree to the exclusive jurisdiction of the federal and state courts in Santa Barbara County, California. Excluding actions seeking injunctive relief, in the event of any disputes arising with respect to this Agreement or an Order Form, before taking formal action, the parties will make reasonable attempts to resolve the dispute amicably between them within thirty (30) days from the date that one party notifies the other of such dispute in reasonable detail.
C. Notice to U.S. Government Users. All LogicMonitor products and services are commercial in nature. The Software and LogicMonitor Technology are “Commercial Items,” as defined at 48 C.F.R. §2.101, consisting of “Commercial Computer Software” and “Commercial Computer Software Documentation,” as such terms are used in 48 C.F.R. §12.212 or 48 C.F.R. §227.7202, as applicable. Consistent with 48 C.F.R. §12.212 or 48 C.F.R. §§227.7202-1 through 227.7202-4, as applicable, the Commercial Computer Software and Commercial Computer Software Documentation are licensed to U.S. Government end users (i) only as Commercial Items, and (ii) with only those rights as are granted to other users pursuant to these Terms. All unpublished rights are reserved.
D. Export Restrictions. Each party shall (i) comply with applicable laws and regulations administered by the U.S. Commerce Bureau of Industry and Security, U.S. Treasury Office of Foreign Assets Control or other governmental entity imposing export controls and trade sanctions (“Export Restrictions”), including designating countries, entities and persons (“Sanctions Targets”) and (ii) not directly or indirectly export, re-export or otherwise deliver Services to a Sanctions Target, or broker, finance or otherwise facilitate any transaction in violation of any Export Laws. Customer represents that it is not a Sanctions Target or prohibited from receiving Services pursuant to this Agreement under any applicable laws or regulations, including Export Restrictions. LogicMonitor products and services may not be used, accessed, exported, re-exported, or otherwise made available in or to any individual, entity, or organization located in the following regions: China, Hong Kong, Russia, and any country or territory subject to comprehensive sanctions or trade restrictions under applicable U.S., UK, EU, or other relevant laws (including, but not limited to, Cuba, Iran, North Korea, Syria, and the Crimea, Donetsk, and Luhansk regions of Ukraine). Further, the parties agree that the Services may not be used in furtherance of the provision of products or services to any entity that is restricted or otherwise sanctioned by the United States Department of Commerce, nor any entity on the U.S. Federal Communications Commission’s “Covered List,” nor any Covered Application, as described in the United States Consolidated Appropriations Act, 2023.
E. Anti-Bribery and Anti-Corruption. LogicMonitor is committed to conducting business that is free from any and all forms of corruption or bribery, including kickbacks, money laundering and fraud. LogicMonitor is committed to compliance with all applicable anti-bribery and anti-corruption laws and regulations, including but not limited to the U.S Foreign Corrupt Practices Act 1977 and the UK Bribery Act 2010. Each party agrees not to directly or indirectly offer, promise, provide or accept anything of value to or from the other party’s employee, a government official or commercial business partner in violation of any provisions of any applicable anti-bribery laws in connection with this Agreement or any LogicMonitor business. LogicMonitor shall ensure that it is, and all of its personnel and affiliates are, in full compliance with the UK Modern Slavery Act 2015.
F. High Risk Activities. The Software is not designed, manufactured or intended for use or resale as on-line control equipment in hazardous environments requiring fail-safe performance, such as, but not limited to, in the operation of nuclear facilities, aircraft navigation or communication systems, air traffic control, or weapons systems, in which the failure of the Software could lead directly to death, personal injury, or severe physical or environmental damage (“High Risk Activities”). The Company specifically disclaims any express or implied warranty of fitness for High Risk Activities.
G. Severability. If any provision of these Terms is held by a court of competent jurisdiction to be unenforceable or contrary to law, the provision shall be modified by the court and interpreted so as best to accomplish the objectives of the original provision to the fullest extent permitted by law, and the remaining provisions of these Terms shall remain in effect.
H. Insurance. LogicMonitor will, at its expense, during the Term and for the 2-year period following termination or expiration hereof, purchase and maintain insurance policies with an insurance company or companies of U.S. or internationally-recognized standing with a rating of A-/Class IX, or better, as rated by A.M. Best, with the following minimum limits:
(i) Comprehensive General Liability Insurance, with limits not less than $1,000,000 per occurrence and $2,000,000 in the aggregate, covering bodily injury, personal injury and property damage; (ii) Technology Errors and Omissions Insurance, with limits of not less than $1,000,000 per claim and $1,000,000 in the aggregate with respect to claims related to the LogicMonitor Technology delivered by LogicMonitor under this Agreement;(iii) Privacy and network security liability (“Cyber”) Insurance, with limits of at least $1,000,000 per claim and $2,000,000 in the aggregate, providing protection against liability for privacy breaches, system breaches, denial or loss of service, introduction, implantation or spread of malicious software code and unauthorized access to or use of computer systems; and(iv) Workers Compensation and Employers Liability Insurance as required by applicable laws, in amounts that meet or exceed those required by applicable laws.If any of such insurance policies are to be modified or canceled during the Term of this Agreement in a way that would materially affect the coverage required hereunder, LogicMonitor will provide written notice to Customer at least thirty (30) days prior to such modification or cancellation. Each party will, upon a party’s request, provide the other party with certificates of insurance evidencing satisfactory coverage of the types and limits set forth above.
I. Survival. Sections 3 (Subscription Fees, Billing and Renewal) (surviving until all fees and charges are paid), 4 (Term and Termination), 5.B. (Our Technology), 6 (Ownership), 7 (Confidentiality) (surviving for the term specified therein), 9.B. (Indemnification), 10 (Disclaimers, Limitation of Damages and Liability), and 11 (General Provisions) (surviving according to the specified periods, if any), shall survive expiration or termination of this Agreement.
J. Third-Party Programs. Customer may receive access to third-party software programs (“Third-Party Programs”) through the Collector Software, and/or third-party programs may be bundled with the Collector Software. These Third-Party Programs are governed by their own license terms, which may include open source licenses, and those terms will prevail over the terms of this Agreement as it relates to Customer’s use of Third-Party Programs. This Agreement does not limit Customer’s rights under any such Third-Party Program or grant Customer any rights that supersede the terms of any such license agreement for a Third-Party Program.
K. Assignment. Neither party may assign any of its rights or obligations hereunder, whether by operation of law or otherwise, without the prior written consent of the other party (not to be unreasonably withheld). Notwithstanding the foregoing, we may assign this Agreement in its entirety, without your consent to our Affiliate provided the assignee accepts full responsibility for our obligations hereunder, or to a successor in interest pursuant to a merger, acquisition, corporate reorganization, or sale of all or substantially all of our assets. Subject to the foregoing, this Agreement shall bind and inure to the benefit of the parties, their respective successors and permitted assigns.
L. Publicity. (i) Neither party will make any news or press release regarding this Agreement without the other party’s prior written consent. You grant us the right to include your name and logo as a customer in our promotional materials; provided however, that you can opt to have your name excluded from such use by us except as agreed to in writing on a case-by-case basis by providing a sufficiently detailed email request regarding the same to [email protected]; the subject line in such email should be entitled “Non-use of Subscriber Name.” (ii) Subject in each case to your agreement and only on an occasional basis, we may ask that you consider in your sole discretion making a representative available (x) to serve as a non-public reference to our prospective customers to discuss your experience working with us; and (y) to work with us in developing and publishing case studies and press releases that describe your use of the Services.
M. Force Majeure. Except for the nonpayment of money due, neither party shall be liable for any delay or failure in performance due to Extraordinary Circumstances (as defined in Section 2.C.(ii) hereof); provided, that, if such force majeure conditions result in the Service being unavailable for thirty (30) consecutive days, either party may terminate this Agreement upon written notice.
N. Effect of Transaction. For the avoidance of doubt, (i) in the event that Customer is acquired by or merged into another entity that is a customer of LogicMonitor, this Agreement and the commercial terms set forth on any Order Form hereunder shall continue to apply for the subscription term set forth on any such Order Form; and (ii) in the event that Customer acquires (whether by acquisition or merger) another entity that is a customer of LogicMonitor, Customer acknowledges and agrees that the commercial and legal terms then in place between LogicMonitor and such entity shall continue for the duration of such entity’s current subscription term.
O. Compliance with Federal, State and Local Laws. Each party agrees the Services provided hereunder shall be delivered and used in accordance with all applicable federal, state and local laws and regulations.
P. Relationship of the Parties. The parties are independent contractors and this Agreement does not create a partnership, franchise, joint venture, agency, fiduciary, or employment relationship between the parties. There are no third-party beneficiaries to this Agreement.
Q. Waiver and Cumulative Remedies. No failure or delay by either party in exercising any right under this Agreement shall constitute a waiver of that right. Other than as expressly stated herein, the remedies provided herein are in addition to, and not exclusive of, any other remedies available to a party at law or in equity.
R. Entire Agreement. This Agreement and any attachments approved by the parties hereto along with any Order Forms constitute the entire agreement between the parties and supersede all prior and contemporaneous agreements, proposals or representations, written or oral, concerning its subject matter, including but not limited to any non-disclosure and proof of concept agreements entered by the parties and any click-through or online terms. No modification, amendment, or waiver of any provision of this Agreement shall be effective unless in writing and either signed or accepted electronically by the party against whom the modification, amendment or waiver is to be asserted. In addition, purchase orders are used for convenience of ordering only, and no purchase order terms and conditions will supplement this Agreement. In the event of any conflict or inconsistency between the provisions of this Agreement and any Order Form, the same shall be resolved by giving precedence to this Agreement.
Virtual Machine Monitoring
LogicMonitor provides in-depth, agentless monitoring of your entire virtualization stack in a snap. Automatic discovery of virtual machines, hypervisors, and hosts – requiring no manual configuration or additional hardware – provides in-depth analysis and visualization within minutes. Deliver uptime that gives you downtown with LogicMonitor’s automated monitoring platform.
End-to-end monitoring for your virtualized infrastructure
Virtualization provides server consolidation, and improved utilization of your compute resources. However, it’s difficult to know if your virtualization strategy is leaving resources unused or overtaxed unless you’re monitoring the details of your virtualized infrastructure. LogicMonitor removes the guesswork by automating the monitoring of your entire virtualization stack.
LogicMonitor provides comprehensive monitoring of VMware vCenter, VCSA, Horizon, and more. Our agentless collectors go beyond baseline performance monitoring and map the dependencies of your VMs, the applications running on them, and the backend infrastructure your VMware services rely on. Intelligent thresholds built on machine learning warn you of impending issues affecting your virtual machines and provide recommendations to improve performance and meet your SLAs.
Maintain and optimize your hypervisors for flawless deployments
The hypervisor is the core of Hyper-V; understanding the interplay of physical and logical processors, memory usage, and pressure is critical to managing resource utilization. LogicMonitor provides comprehensive visibility into Hyper-V, whether deployed on-prem or cloud, with pre-defined alerts and root cause analysis to help you alleviate issues quickly.
Easily monitor hyper-converged infrastructure
LogicMonitor’s Active Discovery always looks for new virtual machines on your Nutanix hypervisor host. Spun up a new instance? LogicMonitor will discover it in minutes – no additional configuration required! Survey CPU, memory utilization, storage IOPS/latency, and network throughput performance of top VMs at a glance to quickly identify outliers and potential misconfigurations.
Keep supporting services running like clockwork
Whether you are running Cisco HyperFlex, Viptela, or any other SD-WAN technology, LogicMonitor will ensure all the pieces of your virtual environment work together seamlessly. In addition, with AI-driven dynamic thresholds, your team can quickly troubleshoot anomalous network or hypervisor activities that fall out of the expected range.
Monitor your entire stack in one unified platform
Monitor the health & performance of your storage systems, network devices, logs, applications, and more. With out-of-the-box monitoring support for over 2000 technologies, LogicMonitor makes it easy to keep track of all the critical pieces that hold your infrastructure environment together.
PROVIDING UPTIME AND RELIABILITY TO OVER 2000 GLOBAL COMPANIES
Get the metrics that matter
Easily monitor and improve Virtual Machine performance within a single system. Whether your resources are hosted on-premises, in the cloud, or in multiple geographic regions or data centers, LogicMonitor provides a single pane of glass view for all the metrics that matter.
Visualize and share critical metrics in user-friendly, drag-and-drop dashboards with a range of widget styles.
Correlate critical VM metrics to other aspects of your infrastructure, including networks, storage, and log data, to rapidly perform root cause analysis that will improve MTTR
Get real-time alerts to optimize resource utilization and prevent capacity issues across storage, memory, and CPU.
Prevent alert storms with intelligent thresholds, SLA monitoring, and escalation chains tuned for your environment.
The continuous growth of VMs and their usage can negatively affect application performance and server operating times – draining important resources. Utilizing LogicMonitor’s out-of-the-box under and over-utilized resource dashboards, you can:
Quickly identify the virtual machine resources taxing performance and causing issues in your environment.
Right size your virtual machine infrastructure in-real time to reduce excess capacity and save money.
Automatically prevent service-impacting problems with automated monitoring and AI-based alert thresholds.
Proactively prevent outages with intelligent monitoring
With powerful AI features built-in, keeping your virtualized infrastructure optimized and available has never been easier. Detect issues sooner with dynamic thresholds, reduce MTTR with root cause analysis, proactively prevent issues, and plan future resource allocation with automated forecasting.
Dynamically generate topology maps that show how data flows among complex resources
See alerts within your infrastructure on a topology map to streamline troubleshooting and reduce MTTR
Pinpoint anomalies that occur for a monitored resource and compare that anomaly to key historical signals
“The built-in alerts are fantastic! Other solutions I’ve used typically collect the data. Then I go in manually and create alerts. With LogicMonitor, I have hundreds of built-in, pre-configured alerts ready to go with the ability to tune a single object, a group, or the entire organization.”
TYLER C
SERVER AND CLOUD ENGINEER
Go beyond monitoring. Accelerate business growth with award-winning Professional Services
Our monitoring platform is exceptionally easy to deploy and manage. Helping you work easier, faster, and smarter. But LogicMonitor is not just a platform; we are a true partner. Leverage our 24×7 support or utilize custom LM Professional Services engagements that cover a wide range of customer needs and onboarding goals, designed to enable faster and more successful deployments.
One platform for unified observability
Metrics
A single platform for ITOps and DevOps eliminates data silos and tracks metrics that matter. 100% built on OpenTelemetry and OpenMetrics, allowing for a vendor-neutral approach to better understand the user experience and accelerate business transformation.
Logs
Log intelligence at scale – instant access to contextualized and correlated logs and metrics in a single, unified cloud-based platform. With tiered retention options, including unlimited retention, and hot storage to optimize data hygiene and internal compliance initiatives.
Traces
Never miss an application error, improve code quality, and diagnose and fix issues faster. Gain insight into the performance of the entire app stack, from code to cloud, to ensure a flawless customer experience in agile environments.
Third-party research
See how LogicMonitor stacks up
See how LogicMonitor, Datadog, SolarWinds, PRTG, and other top vendors stack up in this comprehensive report by G2, the world’s largest B2B software review platform.
Monitor the health and performance of your entire network infrastructure in a single unified platform. Achieve complete network visibility in minutes with our agentless collector and automated resource discovery. Speed up troubleshooting across all network and IT devices with network logs and metrics.
Thousands of out of the box integrations with top brands like Cisco, Juniper, Meraki, and more allows for auto discovery of any device on any network, easily.
Monitor your networks via SNMP, API, jFlow, NetFlow, sFlow, WMI, NBAR2, and/or IPFIX.
Monitoring for firewalls, routers, switches, wireless devices, load balancers, and more.
Full coverage monitoring for cloud-based networks including SD-WAN.
See clearly
Easily map your networks to get the full picture
Discover and map relationships between critical infrastructure resources
Dynamic auto-generated topology maps allow you to contextualize network traffic and alerts in real-time
Identify traffic origination, ensure optimal performance with real-time metrics and logs, and keep a pulse on network health with custom dashboards
Streamline troubleshooting
Set up proactive alerts to reduce network service impacts
Determine the root cause of network performance issues across cloud services and on-prem data centers instead of wasting time chasing alerts
Get automated log analysis in the context of metric-based alerts to troubleshoot faster and reduce MTTR
Automate incident management workflows with custom HTTP integrations (i.e. Webhooks) that send alert data to any API endpoint
Cut through the noise and eliminate alert fatigue with machine learning algorithms
Out-of-the-box network monitoring for industry-leading solutions, including:
"LogicMonitor is a valuable partner, constantly innovating and adapting to our business needs."
Rafik Hanna
SVP, Topgolf Technologies of Topgolf
"LogicMonitor helps us succeed by being a true partner."
Andrea Curry
Director, Observability & Scheduling of McKesson
"LogicMonitor tells you what’s happening in the environment."
Rich Johnston
Director, Hosting Platforms of Carrier
"Edwin AI will be 100x faster than a human and able to manage complex problems."
Gaël Grootaert
Group Director, Managed Services of Devoteam
"Capital Group has 1,000+ alerts/ day. LogicMonitor will eliminate that noise."
Shawn Landreth
VP of Networking and Reliability Engineering of Capital Group
"Edwin AI delivered value within an hour of implementation."
Kris Manning
Global Head of IT Networks of Syngenta
Automated discovery
Deploy in minutes, not weeks
LogicMonitor uses a lightweight, agentless collector to discover everything you need to know about your network automatically. Just enter a hostname or an IP address, and within minutes you’ll have the monitoring, alerting, and graphing you need to maintain and optimise network infrastructure. Get the coverage you need for the most complex networks – whether those resources are on-premises, spread across multiple data centres, or in the cloud.
Make hybrid monitoring a breeze for growing organisations with support for servers, databases, cloud, containers, networks, applications and more. Eliminate tool sprawl with deeper insights into the health and performance of your cloud, on-proem, and virtualized infrastructure within a single, unified platform. With LogicMonitor, scale your network devices without needing any other point solution.
Reduce risk
Achieve 99.99% uptime
Cut through alert noise and identify network issues at lightning speed with machine learning based dynamic thresholds and root cause analysis. Prevent downtime by identifying future bandwidth issues and performance bottlenecks with anomaly detection and forecasting capabilities that elevate visibility into network performance.
u0022Excellentu0022PCMag rating
95% SatisfactionHighest NetPromoter score of any IT Infrastructure Management provider
u0022Editor's Choiceu0022by PCMag
4.5/5from Gartner Peer Insights and Customer Satisfaction leader on G2
u0022Excellentu0022PCMag rating
95% SatisfactionHighest NetPromoter score of any IT Infrastructure Management provider
u0022Editor's Choiceu0022by PCMag
4.5/5from Gartner Peer Insights and Customer Satisfaction leader on G2
Third-party research
See how LogicMonitor stacks up
See how LogicMonitor, Datadog, SolarWinds, PRTG, and other top vendors stack up in this comprehensive report by G2, the world’s largest B2B software review platform.
Real results u003cstrongu003efrom real customersu003c/strongu003e
LSU achieved 100% service uptime with LogicMonitor
Schneider Electric reduced MTTR u0026 alert noise by 40% with LogicMonitor and consolidated monitoring tools by 83%
Loyola University pinpointed noisy network traffic and saved wasted bandwidth by removing 2,000 broadcasts off the wire
Network Topology Mapping
Ensure complete visibility across any network environment, whether on-premises or cloud-based, with automated network topology mapping and performance monitoring.
LogicMonitor provides a complete view of your network so you can quickly identify and troubleshoot network issues. With topology mapping and performance metrics unified in one platform, you can rapidly understand how your systems are connected and what issues impact performance.
With LogicMonitor you get:
An agentless platform with over 2000 pre-built technology integrations
Real-time network mapping to quickly visualize relationships between resources
Reduced MTTR with root cause analysis in the context of topology
Automated deployment and configuration
24×7 technical engineer support
3,000+ TURN-KEY INTEGRATIONS
Go beyond basic topology mapping
LogicMonitor provides extensive visibility into traditional and on-premises networks to improve network operations. With 2000+ monitoring integrations built-in, we help eliminate tool sprawl and context switching between tools with a unified view of performance metrics and topology. Get the monitoring you need to increase performance and speed up troubleshooting for networks of any make or size.
Automate deployment and configuration
Lightweight, agentless collectors automatically discover your entire network infrastructure without the heavy lifting or expensive hardware. Within minutes, you’ll have the monitoring, alerting, and topology you need to maintain and optimize performance. As resources are automatically discovered and added to LogicMonitor, you’ll have the certainty that your monitoring platform will scale as fast as you do.
“We have decommissioned a lot of tools since bringing LogicMonitor onboard. Datadog, Splunk, Pingdom, New Relic, a number of Prometheus, and Grafana environments, thanks to LM dashboards. LogicMonitor has helped consolidate, standardize, and eliminate a lot of overhead and tool spread.”
WILLIAM GUERTIN
SENIOR SYSTEM ADMINISTRATOR, ACCRUENT
Rapidly identify performance issues
Visualize and share network flow data or topology relationships in user-friendly, customizable dashboards, with a range of widget styles for compelling data display. Identify alerts in the context of topology and utilize root cause analysis for streamlined IT operations.
Get Started Today
SQL Server Monitoring
Maintain the Health and Performance of Your Entire SQL Server Infrastructure – Whether You’re Running On Windows, Linux, or in the Cloud.
LogicMonitor’s unique cloud-based monitoring service provides comprehensive visibility into SQL Server infrastructure, complete with best practices alerts and thresholds distilled from years of real-life datacenter experience. Identify slow-running SQL queries and start optimizing performance in real-time with LogicMonitor.
3,000+ TURN-KEY INTEGRATIONS
Automated SQL Monitoring, Solved.
Forget the heavy lifting. Unlike other monitoring systems, LogicMonitor requires no manual configuration. Simply enter a hostname, and LogicMonitor discovers all interfaces, physical drives, logical file systems, and also finds all instances of SQL server on that host.
CPU, Memory, Network and many other OS metrics for Windows, Linux, Solaris, AIX and more
Applications such as databases, mail servers, web servers, and more
Cloud instances and Virtual Machines
RAID controllers, physical drives, battery systems, interfaces, and other hardware
Monitor Everything, Together.
The value of database monitoring increases if you can monitor the rest of your key infrastructure metrics within the same pane of glass. LogicMonitor includes 1500+ pre-built monitoring integrations to help optimize your entire technical infrastructure in real time. Use one of our best practice dashboards or drag-and-drop your own to visualize highly-granular metrics any way you’d like. These are just a few of the technologies we monitor, right out-of-the-box:
Granular monitoring of servers, including application-level metrics (like IIS, Apache Requests per second, Status, Response Time, and Busy vs Idle Workers) generates actionable data that helps guide IT operations. Proactively identify trends with aggregated views of server metrics like Volume Usage and use forecasting to identify future issues before they occur.