When you add your Kubernetes cluster to monitoring, dynamic groups are used to group the cluster resources. For more information, see Adding a Kubernetes Cluster to Monitoring.
Non-admin users can add Kubernetes clusters to monitoring using API keys with more granular access. These API keys should have access to at least one resource group, which provides the necessary permissions to configure monitoring for Kubernetes clusters. This significantly improves access control, as the dynamic groups are now linked to the resource groups that the API keys can access, based on view permissions.
Before non-admin users can add Kubernetes clusters to monitoring, several prerequisites need to be set up:
Enabling non-admin users to add a Kubernetes cluster to monitoring
- Ensure that different device groups are created for non-admin users. For more information, see Adding Resource Groups.
- Navigate to Settings > User Access > User and Roles.
- Select the Roles tab.
- Select the required role group and select the
Manage icon.
- In the Permissions tab, assign the required access to the Kubernetes cluster static groups.
Note: You can create multiple users with specific roles from the Manage Role dialog box.
When the required permissions are provided, the non-admin users can add and monitor the Kubernetes clusters within the static groups.
- To create the required dashboard groups, in the top left of the Dashboards page, select the Add icon
 > Add dashboard group. Enter the required details. For more information, see Adding Dashboard Groups.
 - To create the required collector groups, navigate to Settings > Collectors.
- Under the Collectors tab, select the Add Collector Options
 dropdown. Enter the required details. For more information, see Adding Collector Groups.
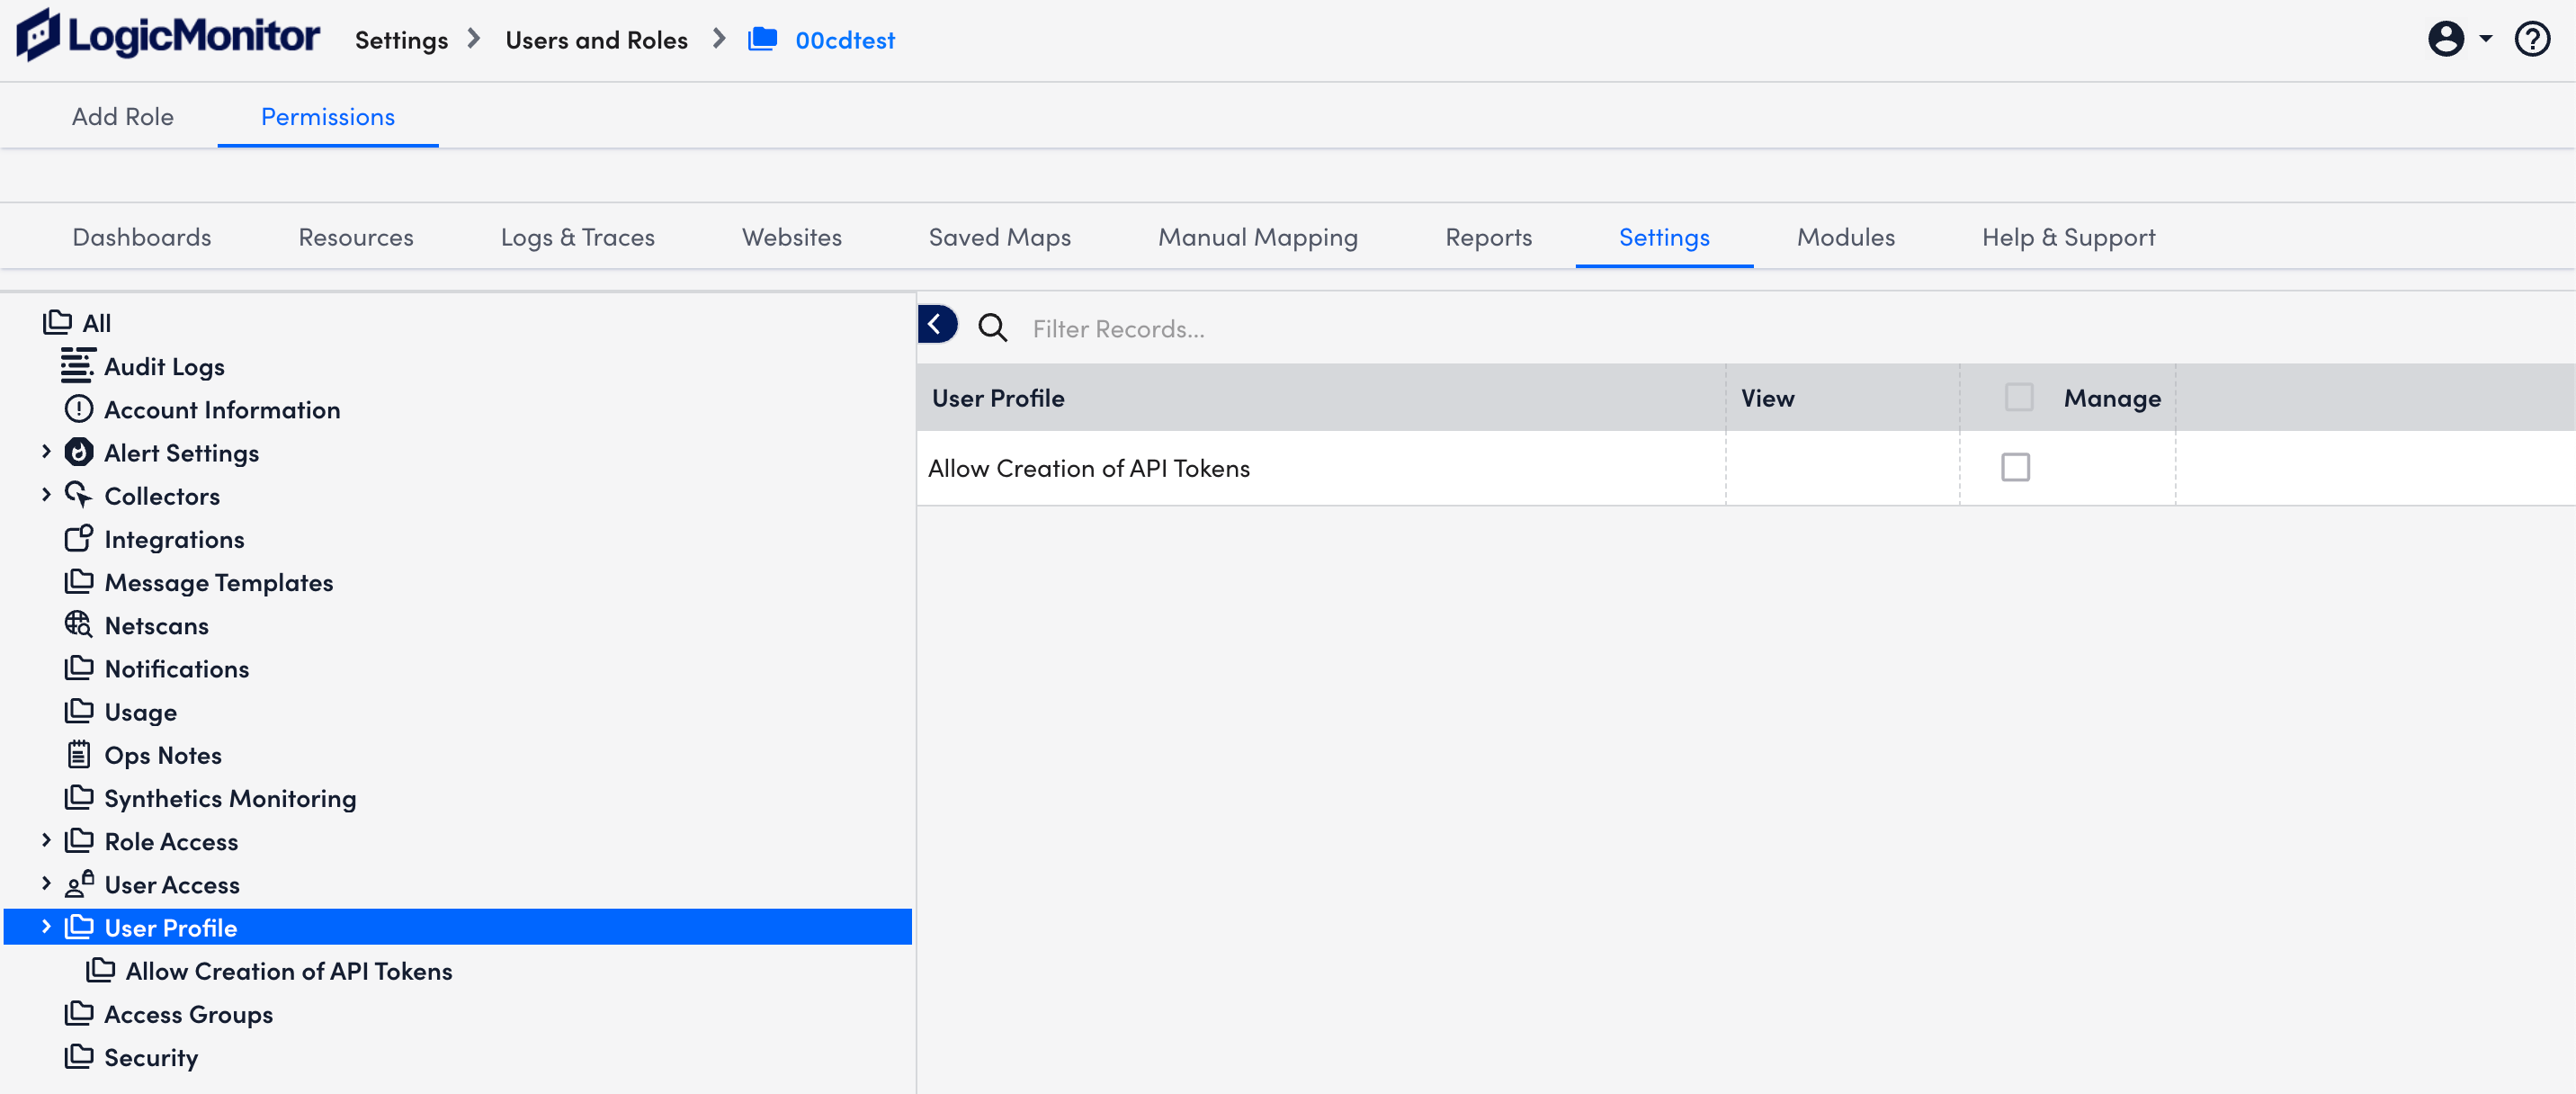
 - Select the User Profile in the Permissions setting and grant non-admin users access to create API tokens and manage their profiles.
After a resource group is allocated, non-admin users can add Kubernetes clusters into monitoring.
Adding a Kubernetes Cluster into Monitoring as a Non-Admin User
- Navigate to Resource Tree > Resources.
- Select the allocated resource group to add to the cluster.
- Select the Add icon and select Kubernetes Cluster.

- On the Add Kubernetes Cluster page, add the following information:
- In the Cluster Name field, enter the cluster name.
- In the API token field, select the allocated resource group’s API token and Save.
The other API Token field information populates automatically. - In the Resource Group field, select the allocated resource group name
- In the Collector Group and Dashboard Group fields, select the allocated Resource Group.
- Select Next.
- In the Install Instruction section, select the Argus tab.
- Select the
resourceGroupIDparameter and replace the default value with thesystem.deviceGroupIdproperty value of the allocated resource group. - Select Verify Connection. When the connection is successful, your cluster is added.
In scenarios such as a new installation or a cache refresh, the entire Kubernetes cluster gets synchronized with the portal. This process results in a large number of devices being added to the cluster unnecessarily, adding strain to the system.
During the default installation, all resources are monitored by the lm-container. However, to address the above-mentioned issue, the following resources will be either filtered or disabled from monitoring:
- Only critical resources will be enabled by default.
- Non-essential resources will be disabled or filtered, but customers can add them back to monitoring by updating the filter criteria in the Helm chart.
To optimize system performance and reduce unnecessary resource load, several default configurations will be applied to filter or disable specific resources, ensuring that only the essential components are actively monitored.
- Default Filtering of Ephemeral Resources: Ephemeral resources, such as Jobs, CronJobs, and pods created by CronJobs, will be filtered out by default to reduce unnecessary load. For example:
argus:
disableBatchingPods: "true"- Disabled Monitoring of Kubernetes Resources: Resources like ConfigMaps and Secrets will be added to a list of disabled resources, preventing them from being monitored by default during cluster setup.
For example:
argus:
  monitoringMode: "Advanced"
  monitoring:
   disable:
- configmapsResources Disabled for Monitoring by Default
Below is a list of Kubernetes resources that will be disabled by default but can be enabled if you choose:
- ResourceQuotas
- LimitRanges
- Roles
- RoleBindings
- NetworkPolicies
- ConfigMaps
- ClusterRoleBindings
- ClusterRoles
- PriorityClasses
- StorageClasses
- CronJobs
- Jobs
- Endpoints
- Secrets
- ServiceAccounts
Changes from Upgrading Helm Chart
In case of an upgrade from an older version of the lm-container Helm chart to this version, the following applies:
- Default Filtering: If you have custom filters applied in the previous version, those filters will continue to take priority. The default filtering will not override their settings.
- Default Disabled Monitoring: If you had resources set for disabled monitoring in the older version, those configurations will remain in effect and will not be overwritten by the new defaults.
- Cross-Configuration for Filtering and Disabled Monitoring:
- If a customer had custom filters but had not configured disabled monitoring resources, the default list for disabled monitoring will be applied automatically.
- Conversely, if custom disabled monitoring resources were configured, the default filtering for resources will be applied.
LM Container allows you to configure the underlying collector through Helm Chart configuration values. The collector is responsible for collecting metrics and logs from the cluster resources using the configuration specification format of the collector. For more information, see agent. conf.
You must use the Helm chart configuration to set up the collector. This ensures a permanent configuration, unlike the manual configuration on the collector pod. For example, a pod restart operation can erase the configured state and revert the configuration to the default state, making Helm chart configuration a more reliable option.
Requirements for Managing Properties on Docker Collector
Ensure you have LM Container Helm Charts 4.0.0 or later installed.
Adding agent.conf Properties on your Docker Collector
- Open and edit the
lm-container-configuration.yamlfile. - Under the
agentConfsection, do the following:- In the value or values parameter, enter the config value.
- (Optional) In dontOverride property, set dontOverride to
trueto add more property values to the existing list. By default, the value isfalse. - (Optional) In the coalesceFormat property, specify the CSV format.
- (Optional) In the discrete property, set the discrete to true to pass the values array corresponding to each item for each collector.
The following is an example of these values.
argus:
  collector:
    collectorConf:
      agentConf:
        - key: <Property Key>
          value: <Property Value>
          values: <Property values list/map>
          dontOverride: true/false
          coalesceFormat: csv
discrete: true/false- Run the following Helm upgrade command:
helm upgrade \
    --reuse-values \
    --namespace=<namespace> \
    -f lm-container-configuration.yaml \
lm-container logicmonitor/lm-containerExample of Adding Identical Configurations
You can apply identical configurations on each collector of the set. Following are the different examples of the input properties in the lm-container-configuration.yaml file:
- Singular value in string, number, or boolean format
key: EnforceLogicMonitorSSL
value: false- Multi-valued properties in CSV format
key: collector.defines
value:
  - ping
  - script
  - snmp
  - webpage
coalesceFormat: csvThe resultant property displays as collector.defines=ping,script,snmp,webpage in the agent.conf when you have not set the dontOverride to true. If you have set the dontOverride to true, then the resultant property is appended with config parameter values and displays as collector.defines=ping,script,snmp,webpage,jdbc,perfmon,wmi,netapp,jmx,datapump,memcached,dns,esx,xen,udp,tcp,cim,awscloudwatch,awsdynamodb,awsbilling,awss3,awssqs,batchscript,sdkscript,openmetrics,syntheticsselenium.
Example of Adding Discrete Configurations
You can define different property values on every collector using discrete flag. Following are the different examples of how the properties display in the agent.conf file:
- Singular value in string, number, or boolean format
key: logger.watchdog
discrete: true
values:
  - debug
  - info
- infoThe above configuration enables debug logs on the first collector out of 3 whose index is 0 and info logs to the remaining.
- Multi-valued properties in CSV format
For example, you want to change the preferred authentication on the second collector (password first priority) keeping the remaining on default order.
key: ssh.preferredauthentications
discrete: true
values:
  - - publickey
    - keyboard-interactive
    - password
  - - password
    - keyboard-interactive
    - publickey
  - - publickey
    - keyboard-interactive
    - password
coalesceFormat: csvThe resultant property for individual collectors considering you have 3 replica displays as follows:
- Replica indexed 0 resultant property displays as
ssh.preferredauthentications=publickey,keyboard-interactive,password - Replica indexed 1 resultant property displays as
ssh.preferredauthentications=password,publickey,keyboard-interactive - Replica indexed 2 resultant property displays as
ssh.preferredauthentications=publickey,keyboard-interactive,password
A Secret is an object that contains a small amount of sensitive data such as a password, a token, or a key. Kubernetes Secrets allows you to configure the Kubernetes cluster to use sensitive data (such as passwords) without writing the password in plain text into the configuration files. For more information, see Secrets from Kubernetes documentation.
Note: If you are using secrets on your LM Container, granting manage permission might reveal your encoded configuration data.
Requirements for Configuring User Defined Secrets in LM Container
Ensure you have LM Container Helm Charts version 5.0.0 or later.
Configuring User Defined Secrets for your Kubernetes Clusters in LM Containers
Creating a Secret involves using the key-value pair to store the data. To create Secrets, do as follows:
- Create the
secrets.yamlwith opaque secret type that encodes in Base64 format similar to the following example.
Note: Adding the data label encodes the accessID, accessKey, and account field values in Base64 format.
apiVersion: v1
data:
  accessID: NmdjRTNndEU2UjdlekZhOEp2M2Q=
  accessKey: bG1hX1JRS1MrNFUtMyhrVmUzLXE0Sms2Qzk0RUh7aytfajIzS1dDcUxQREFLezlRKW1KSChEYzR+dzV5KXo1UExNemxoT0RWa01XTXROVEF5TXkwME1UWmtMV0ZoT1dFdE5XUmpOemd6TlROaVl6Y3hMM2oyVGpo
  account: bG1zYWdhcm1hbWRhcHVyZQ==
  etcdDiscoveryToken: ""
kind: Secret
metadata:
  name: user-provided-secret
  namespace: default
type: Opaqueor
- Create the
secrets.yamlwith an opaque secret stringData type similar to the following example.
apiVersion: v1
stringData:
  accessID: "6gcE3gtE6R7ezFa8Jv3d"
  accessKey: "lma_RQKS+4U-3(kVe3-q4Jk6C94EH{k+_j23KWCqLPDAK{9Q)mJH(Dc4~w5y)z5PLMzlhODVkMWMtNTAyMy00MTZkLWFhOWEtNWRjNzgzNTNiYzcxL3j2Tjh"
  account: "lmadminuser"
  etcdDiscoveryToken: ""
kind: Secret
metadata:
  name: user-provided-secret
  namespace: default
type: Opaque- Enter the accessID, accessKey, and account field values.
Note: If you have an existing cluster, enter the same values used while creating Kubernetes Cluster.
- Save the
secrets.yamlfile. - Open and edit the
lm-container-configuration.yamlfile. - Enter a new field userDefinedSecret with the required value similar to the following example.
Note: The value for userDefinedSecret must be the same as the newly created secret name.
argus:
  clusterName: secret-cluster
global:
  accessID: ""
  accessKey: ""
  account: ""
userDefinedSecret: "user-provided-secret"- Save the
lm-container-configuration.yamlfile. - In your terminal, enter the following command:
Kubectl apply -f secrets.yaml -n <namespace_where_lm_container will be installed>Note: Once you apply the secrets and install the LM Container, delete the accessID, accessKey, and account field values in the lm-container-configuration.yaml for security reasons.
The following table displays the Secrets fields:
| Field Name | Field Type | Description |
| accessID | mandatory | LM access ID |
| accessKey | mandatory | LM access key |
| account | mandatory | LM account name |
| argusProxyPass | optional | argus proxy password |
| argusProxyUser | optional | argus proxy user name |
| collectorProxyPass | optional | collector proxy password |
| collectorProxyUser | optional | collector proxy username |
| collectorSetControllerProxyPass | optional | collectorset-controller proxy password |
| collectorSetControllerProxyUser | optional | collectorset-controller proxy username |
| etcdDiscoveryToken | optional | etcd discovery token |
| proxyPass | optional | global proxy password |
| proxyUser | optional | global proxy username |
Example of Secrets with Proxy Details for Kubernetes Cluster
The following secrets.yaml file displays user-defined secrets with the proxy details:
apiVersion: v1
data:
  accessID:
  accessKey:
  account:
  etcdDiscoveryToken:
  proxyUser:
  proxyPass:
  argusProxyUser:
  argusProxyPass:
  cscProxyUser:
  cscProxyPass:
  collectorProxyUser:
  collectorProxyPass:
kind: Secret
metadata:
  name: user-provided-secret
  namespace: default
type: OpaqueThere are two types of proxies; global proxy and component-level proxy. When you provide a global proxy, it applies to all Argus, Collectorset-Controller, and collector components. When you add both component-level proxy and global proxy, component-level proxy gains precedence. For example, if you add a collector proxy and a global proxy, the collector proxy is applied to the collector, and a global proxy is applied to the other Argus and Collectorset-Controller components.
The following is an example of the lm-container-configuration.yaml file:
global:
  accessID: ""
  accessKey: ""
  account: ""
  userDefinedSecret: <secret-name>
  proxy:
url: "proxy_url_here"kube-state-metrics (KSM) monitors and generates metrics about the state of the Kubernetes objects. KSM monitors the health of various Kubernetes objects such as Deployments, Nodes, and Pods. For more information, see kube-state-metrics (KSM) from GitHub.
You can use the kube-state-metrics-based modules available in LM Exchange in conjunction with the new LM Container Helm charts to gain better visibility of your Kubernetes cluster. The charts automatically install and configure KSM on your cluster. For more information on LM Container installation, see Installing the LM Container Helm Chart or Installing LM Container Chart using CLI.
Monitoring Workflow
The following diagram illustrates the monitoring workflow with the KSM:
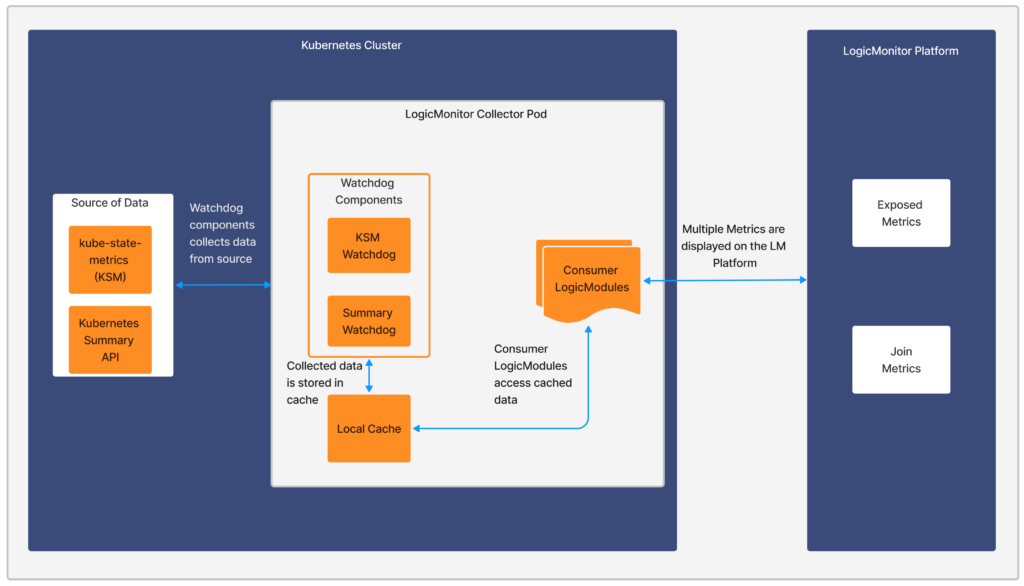
Sources of Data
- kube-state-metrics (KSM)— Listens to the Kubernetes API server and generates metrics about the state of the objects. For more information, see kube-state-metrics from Github.
- Kubernetes Summary API (/stats/summary)— It is provided by the kubelet for discovering and retrieving per-node summarized stats available through the /stats endpoint. For more information, see Node metrics data from Kubernetes documentation.
Watchdog Component
The Watchdog component collects and stores the data for other LogicModules to consume. LogicMonitor uses kube-state-metrics (KSM) and Kubernetes Summary API to monitor Kubernetes cluster health.
There are two modules, watchdog module and consumer module. Watchdog fetches the data from the API and stores it in the local cache. The consumer uses the stored data.
- KSM Watchdog— KSM Watchdog collects data from kube-state-metrics.
- Summary Watchdog— Summary Watchdog fetches metrics from the summary API and provides data to LogicModules.
| Module Name | AppliesTo |
| Kubernetes_ KSM_Watchdog | system.devicetype == “8” && system.collector == “true” && hasCategory(“KubernetesKSM”) |
| Kubernetes_Summary_Watchdog | system.collector == “true” && hasCategory(“KubernetesKSM”) |
For more information on AppliesTo, see AppliesTo Scripting Overview.
Consumer LogicModules
Kubernetes-related LogicModules utilize the data which is collected by Kubernetes Watchdog. For example, Kubernetes_KSM_Pods, Kubernetes_KSM_Nodes are collected by Watchdog.
Requirements for Monitoring using KSM
- Ensure to add all the Kubernetes modules under LM Exchange in the Kubernetes package.
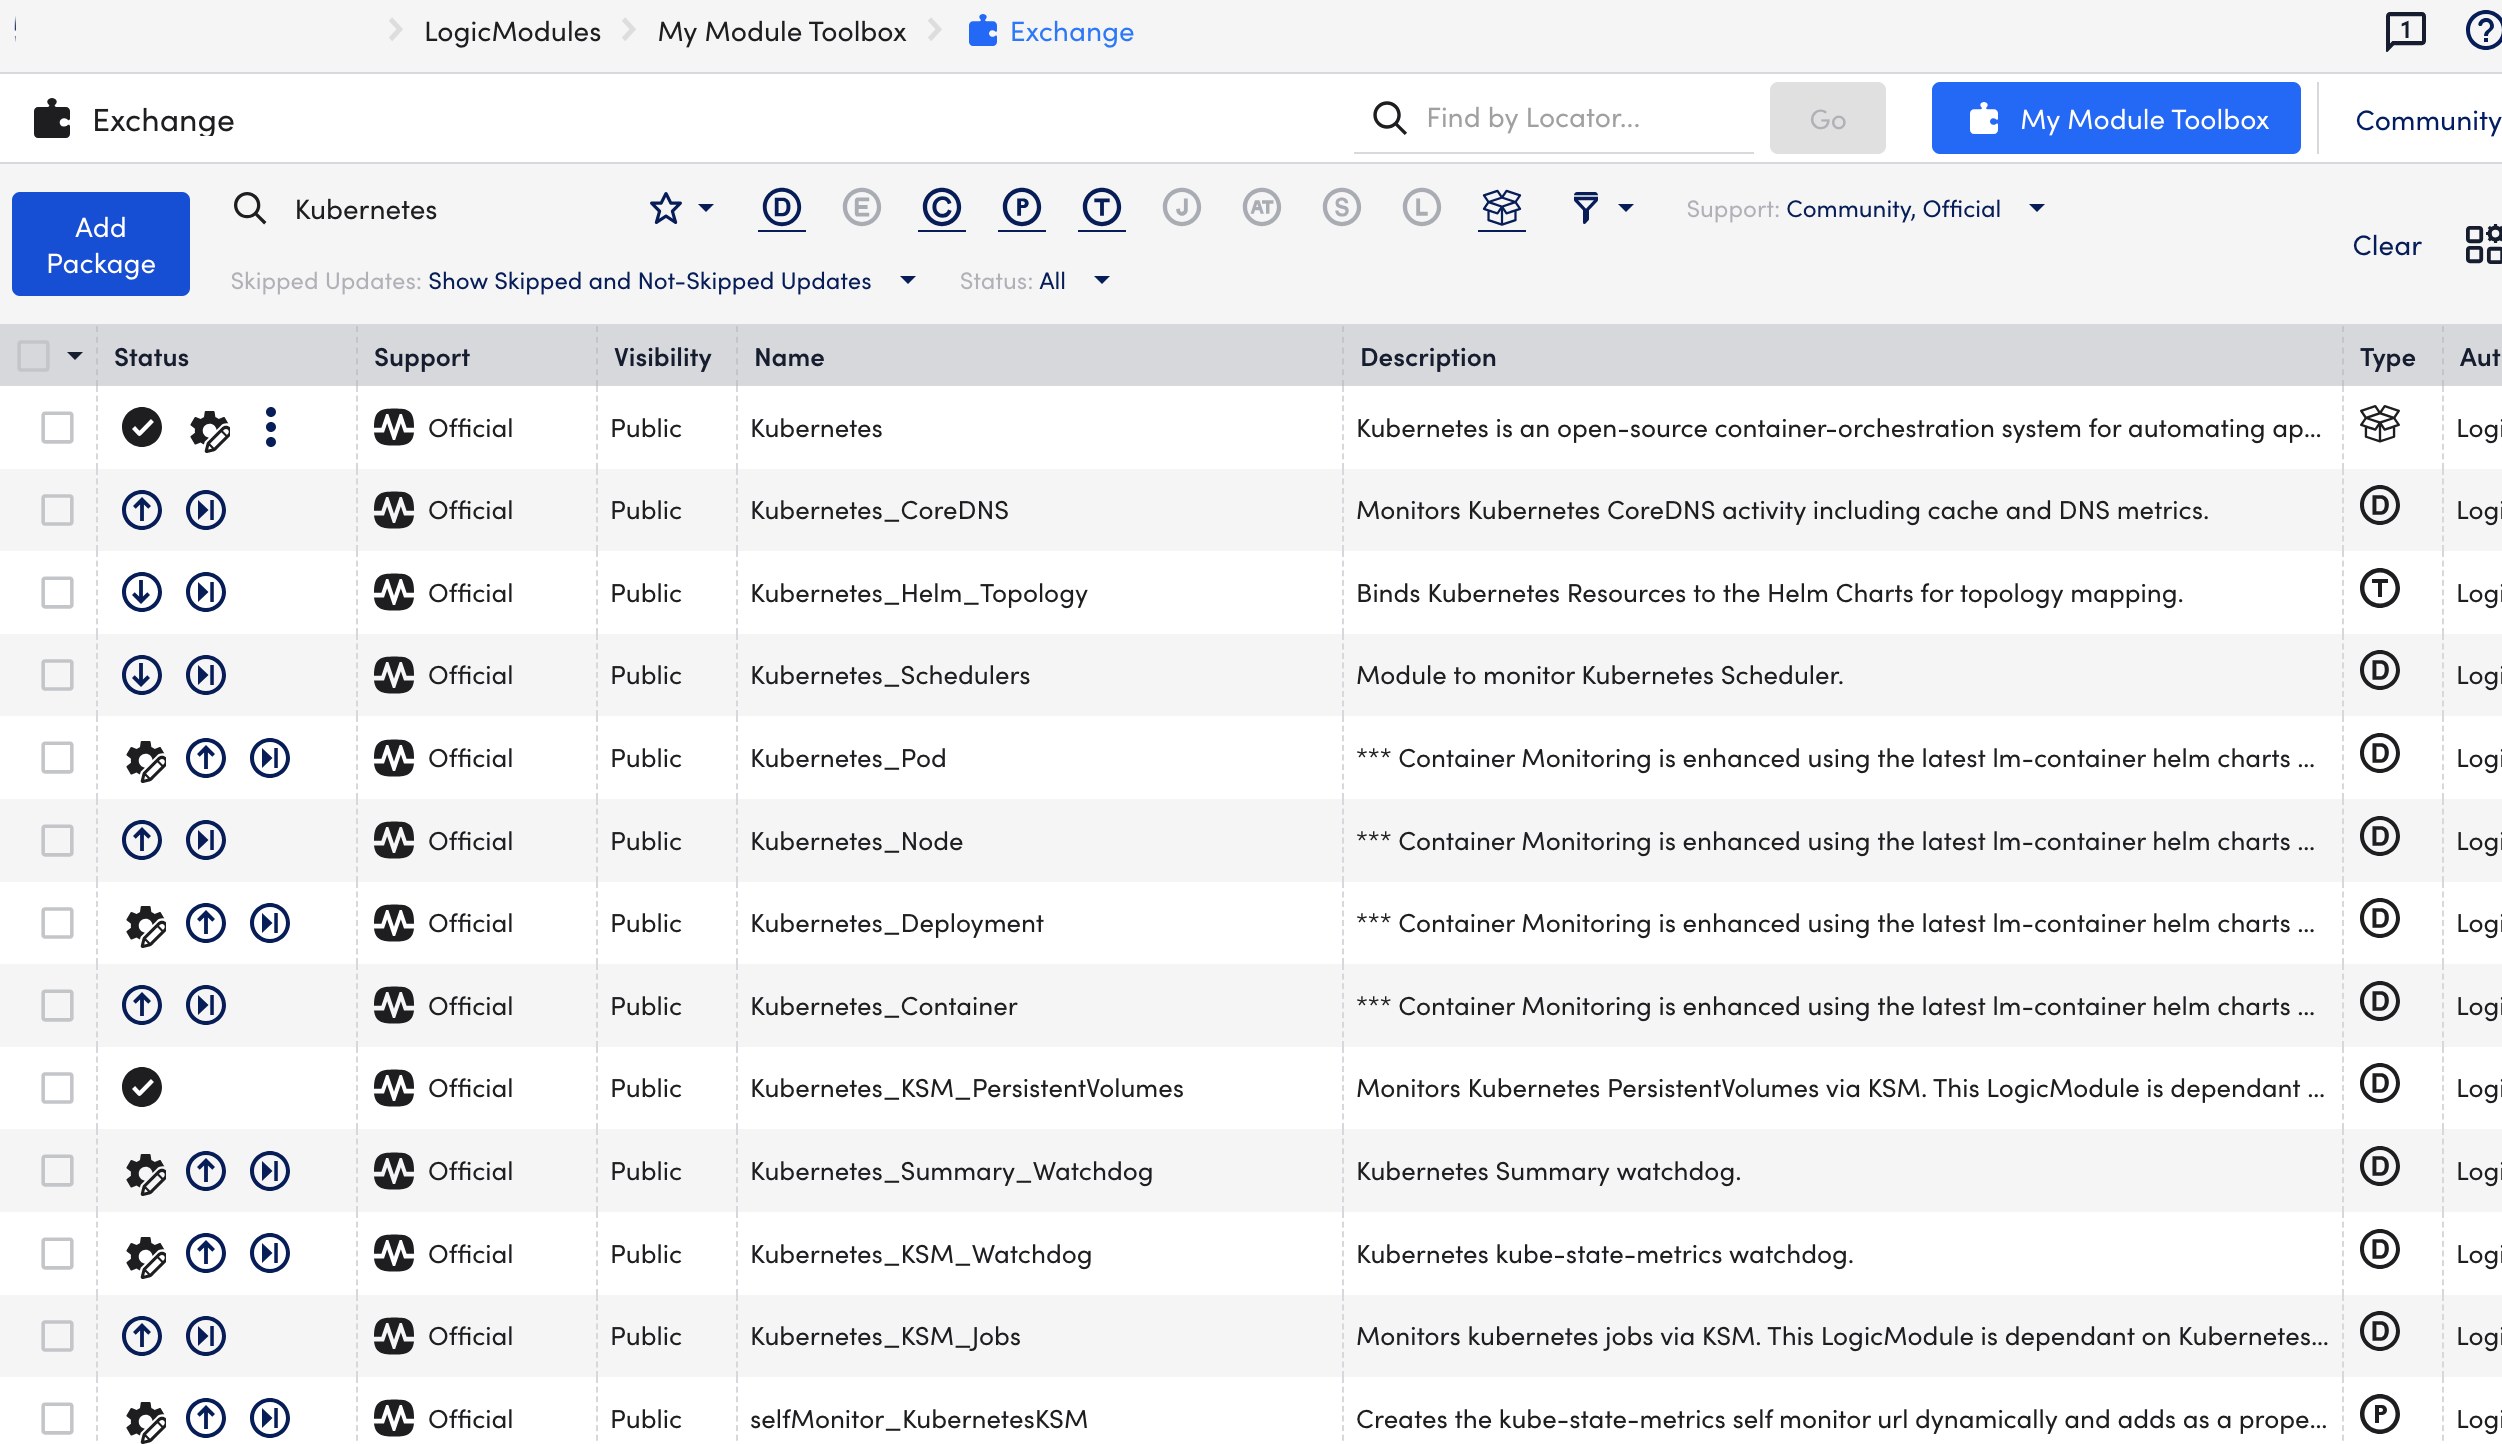
- Ensure that Kubernetes_ KSM_Watchdog and Kubernetes_Summary_Watchdog modules are installed.
Installing KSM
You do not need any separate installation on your server to use kube-state-metrics (KSM). If the value of kube-state-metrics.enabled property is set to true in the lm-container helm values.yaml file, KSM installs automatically. In addition, you can configure KSM while installing or upgrading LM Container Helm Charts.
Note:
- If you already have KSM installed and intend to use the same, set the kube-state-metrics.enabled property to false.
- In case the existing KSM service is changed, you must restart the LM Collector Pod.
Installing and Upgrading KSM with LM Container Helm Charts
Install LM Container Charts. For more information, see Installing the LM Container Helm Chart.
To upgrade the existing cluster to the latest version, see Upgrading LM Container Charts.
Installing and Upgrading KSM without LM Container Helm Charts
Install Argus. For more information, see Argus Installation.
To upgrade the existing cluster to the latest version, see Upgrading Kubernetes Monitoring Applications.
Running the PropertySource
To set the existing cluster for monitoring, you must run the addCategory_KubernetesKSM property source by completing the following steps:
- In LogicMonitor, navigate to Settings > PropertySources > addCategory_KubernetesKSM.
- In the PropertySouce window, click the More options.
- Run PropertySource.
Updating Dashboards
Dashboards can help you visualize the information in a meaningful manner that is retrieved by the modules. It does not affect the usability of the modules.
Requirements
Download the Dashboards from the LogicMonitor repo.
Procedure
- Log into your LogicMonitor portal.
- On the left panel, navigate to Dashboards and click the expand icon.
- On the Dashboards panel, click Add.
- From the Add drop-down list, select From File option.
- Click Browse, to add the dashboard file downloaded from the portal.
- Click Submit.
You can see the required dashboard added to the Dashboard page.
etdc is a lightweight, highly available key-value store where Kubernetes stores the information about a cluster’s state. For more information, see Operating etcd clusters for Kubernetes from Kubernetes documentation.
LogicMonitor can only monitor etcd clusters that are deployed within a Kubernetes Cluster, and not those that are deployed outside of the cluster.
Important: We do not support Kubernetes etcd monitoring for managed Kubernetes services like OpenShift, Amazon Elastic Kubernetes Service (EKS), Google Kubernetes Engine (GKE), and Azure Kubernetes Service (AKS) because they do not expose the Kubernetes Control Plane components.
Requirements for Monitoring etcd
Ensure you have enabled the Kubernetes_etcd DataSource.
Note: This is a multi-instance datasource, with each instance indicating an etcd node. This DataSource is available for download from LM Exchange.
Setting up Kubernetes etcd Monitoring
Installation
You do not need any separate installation on your server to use the Kubernetes etcd.
Depending on your preference, you can install LM Container with the following two options:
- Installing through the user interface. For more information, see Installing the LM Container Helm Chart.
- Installing through the command line interface. For more information, see Installing LM Container Chart using CLI.
Configuration
The Kubernetes etcd cluster is pre-configured for monitoring. No additional configurations are required. If you do not see any data for the Kubernetes etcd resource, do the following:
- In your system, enter /etc/kubernetes/manifests in the terminal.
- Open the etcd.yaml file for updating.
- In etcd Pod under kube-system namespace, change the value of –listen-metrics-urls at .spec.containers.command from http://127.0.0.1:2381 to http://0.0.0.0:2381.
Note: Changing the value of –listen-metrics-urls allows the collector pod to scrape the metrics URL of the etcd pod within the cluster only. - Save the etcd.yaml file.
Note: Ensure you disable the SSL certificate verification. To do this, use http instead of https for the –listen-metrics-urls value.
For monitoring custom etcd deployment, follow the instructions below:
- In LogicMonitor, navigate to Settings > DataSources > select Kubernetes etcd DataSource.
- In the Kubernetes etcd DataSource page, expand Active Discovery.
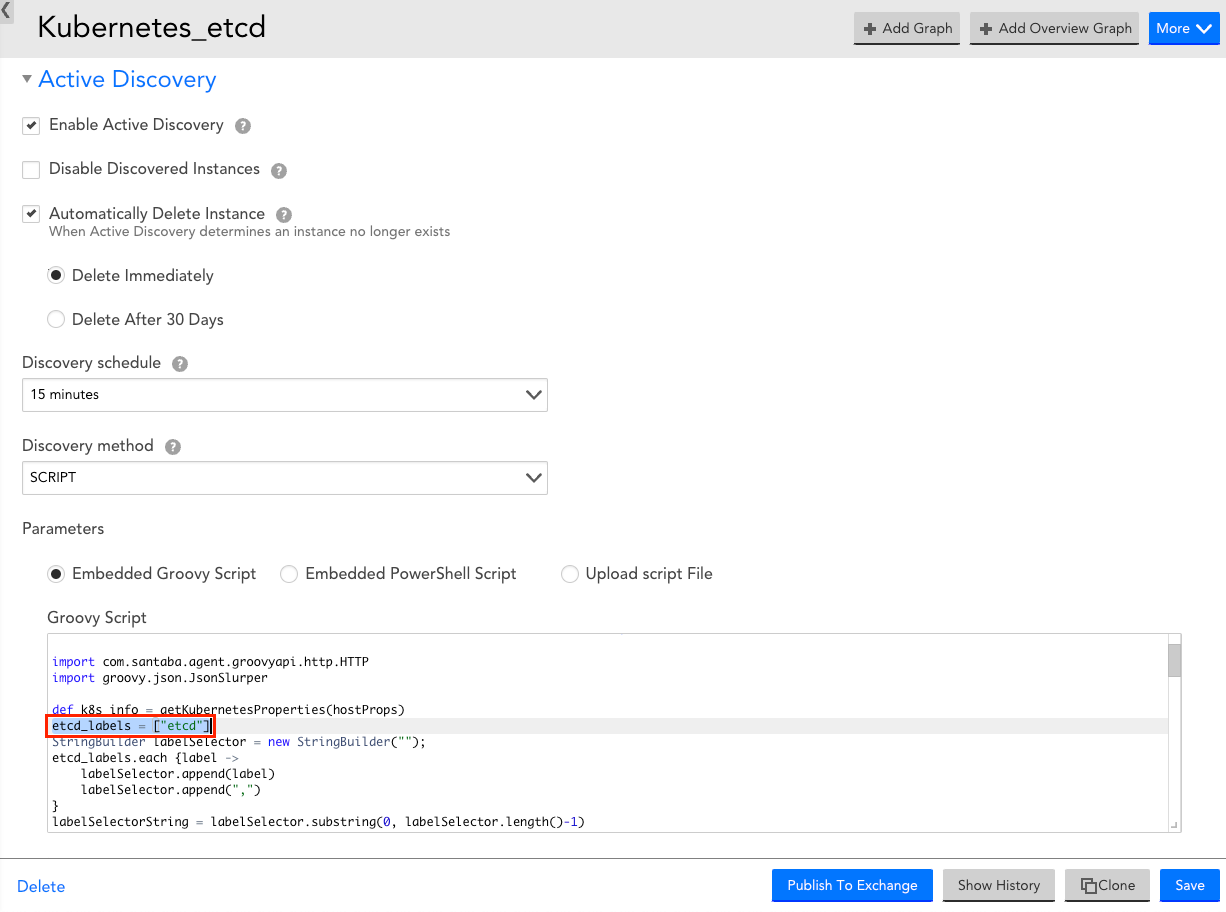
- In the Parameters section, select the Embedded Groovy Script option.
- In the Groovy Script field, enter the required component name for the etcd_label array.
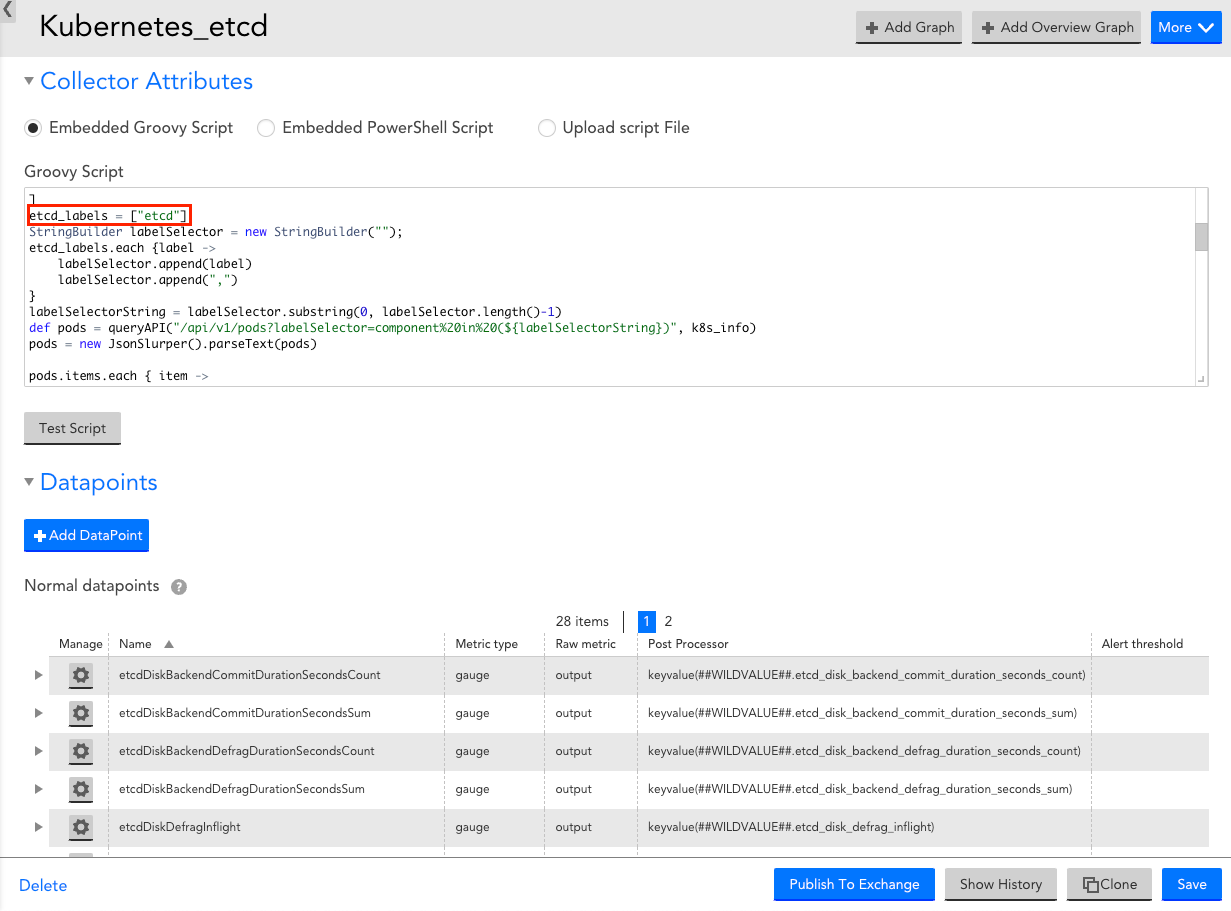
- Expand Collector Attributes, and in the Groovy Script field, enter the required component name for the etcd_label array.
- Select Save to save the Kubernetes etcd DataSource.
Viewing Kubernetes etcd Details
Once you have installed and configured the Kubernetes etcd on your server, you can view the etcd cluster properties and metrics on the Resources page.
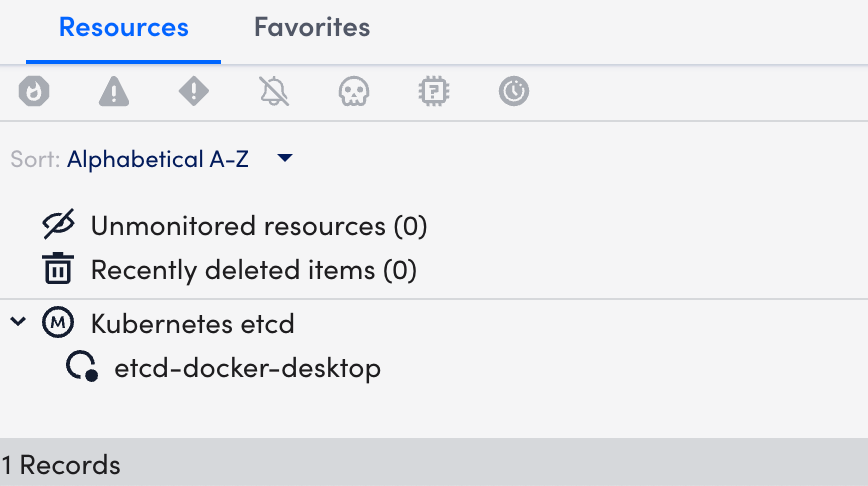
- In LogicMonitor, navigate to Resources > select the required etcd DataSource resource.
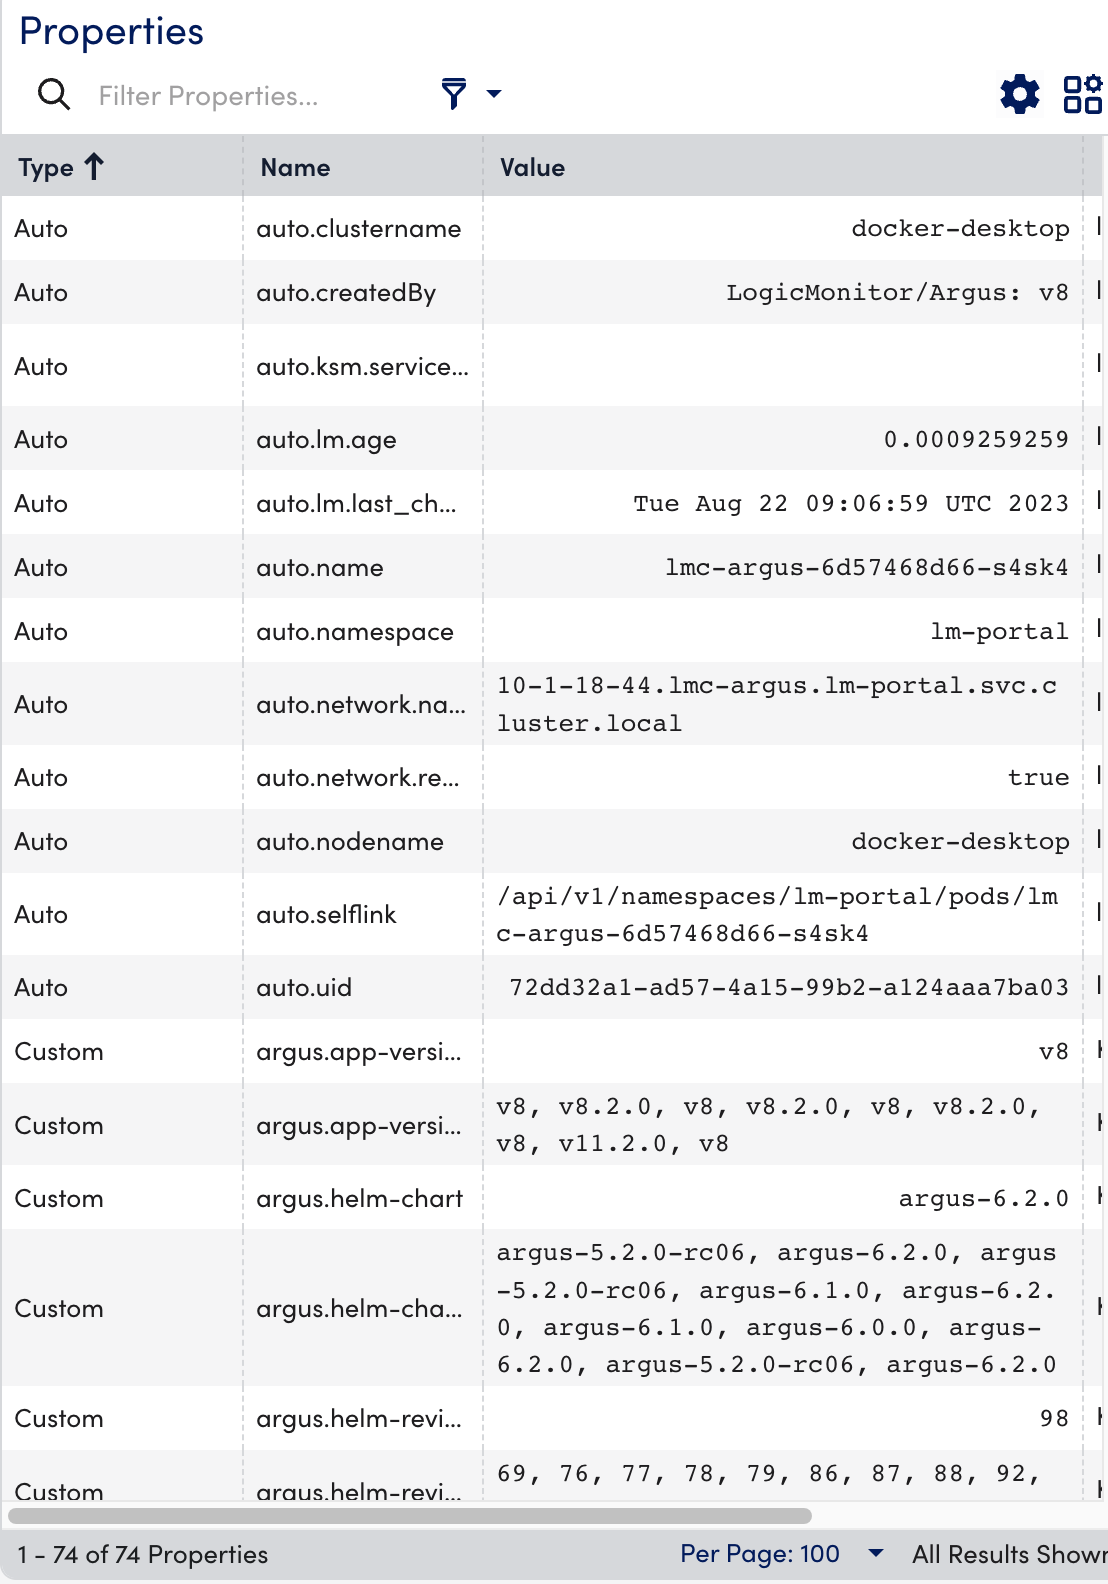
- Select the Info tab to view the different properties of the Kubernetes etcd.
- Select the Alerts tab to view the alerts generated while checking the status of the Kubernetes etcd resource.

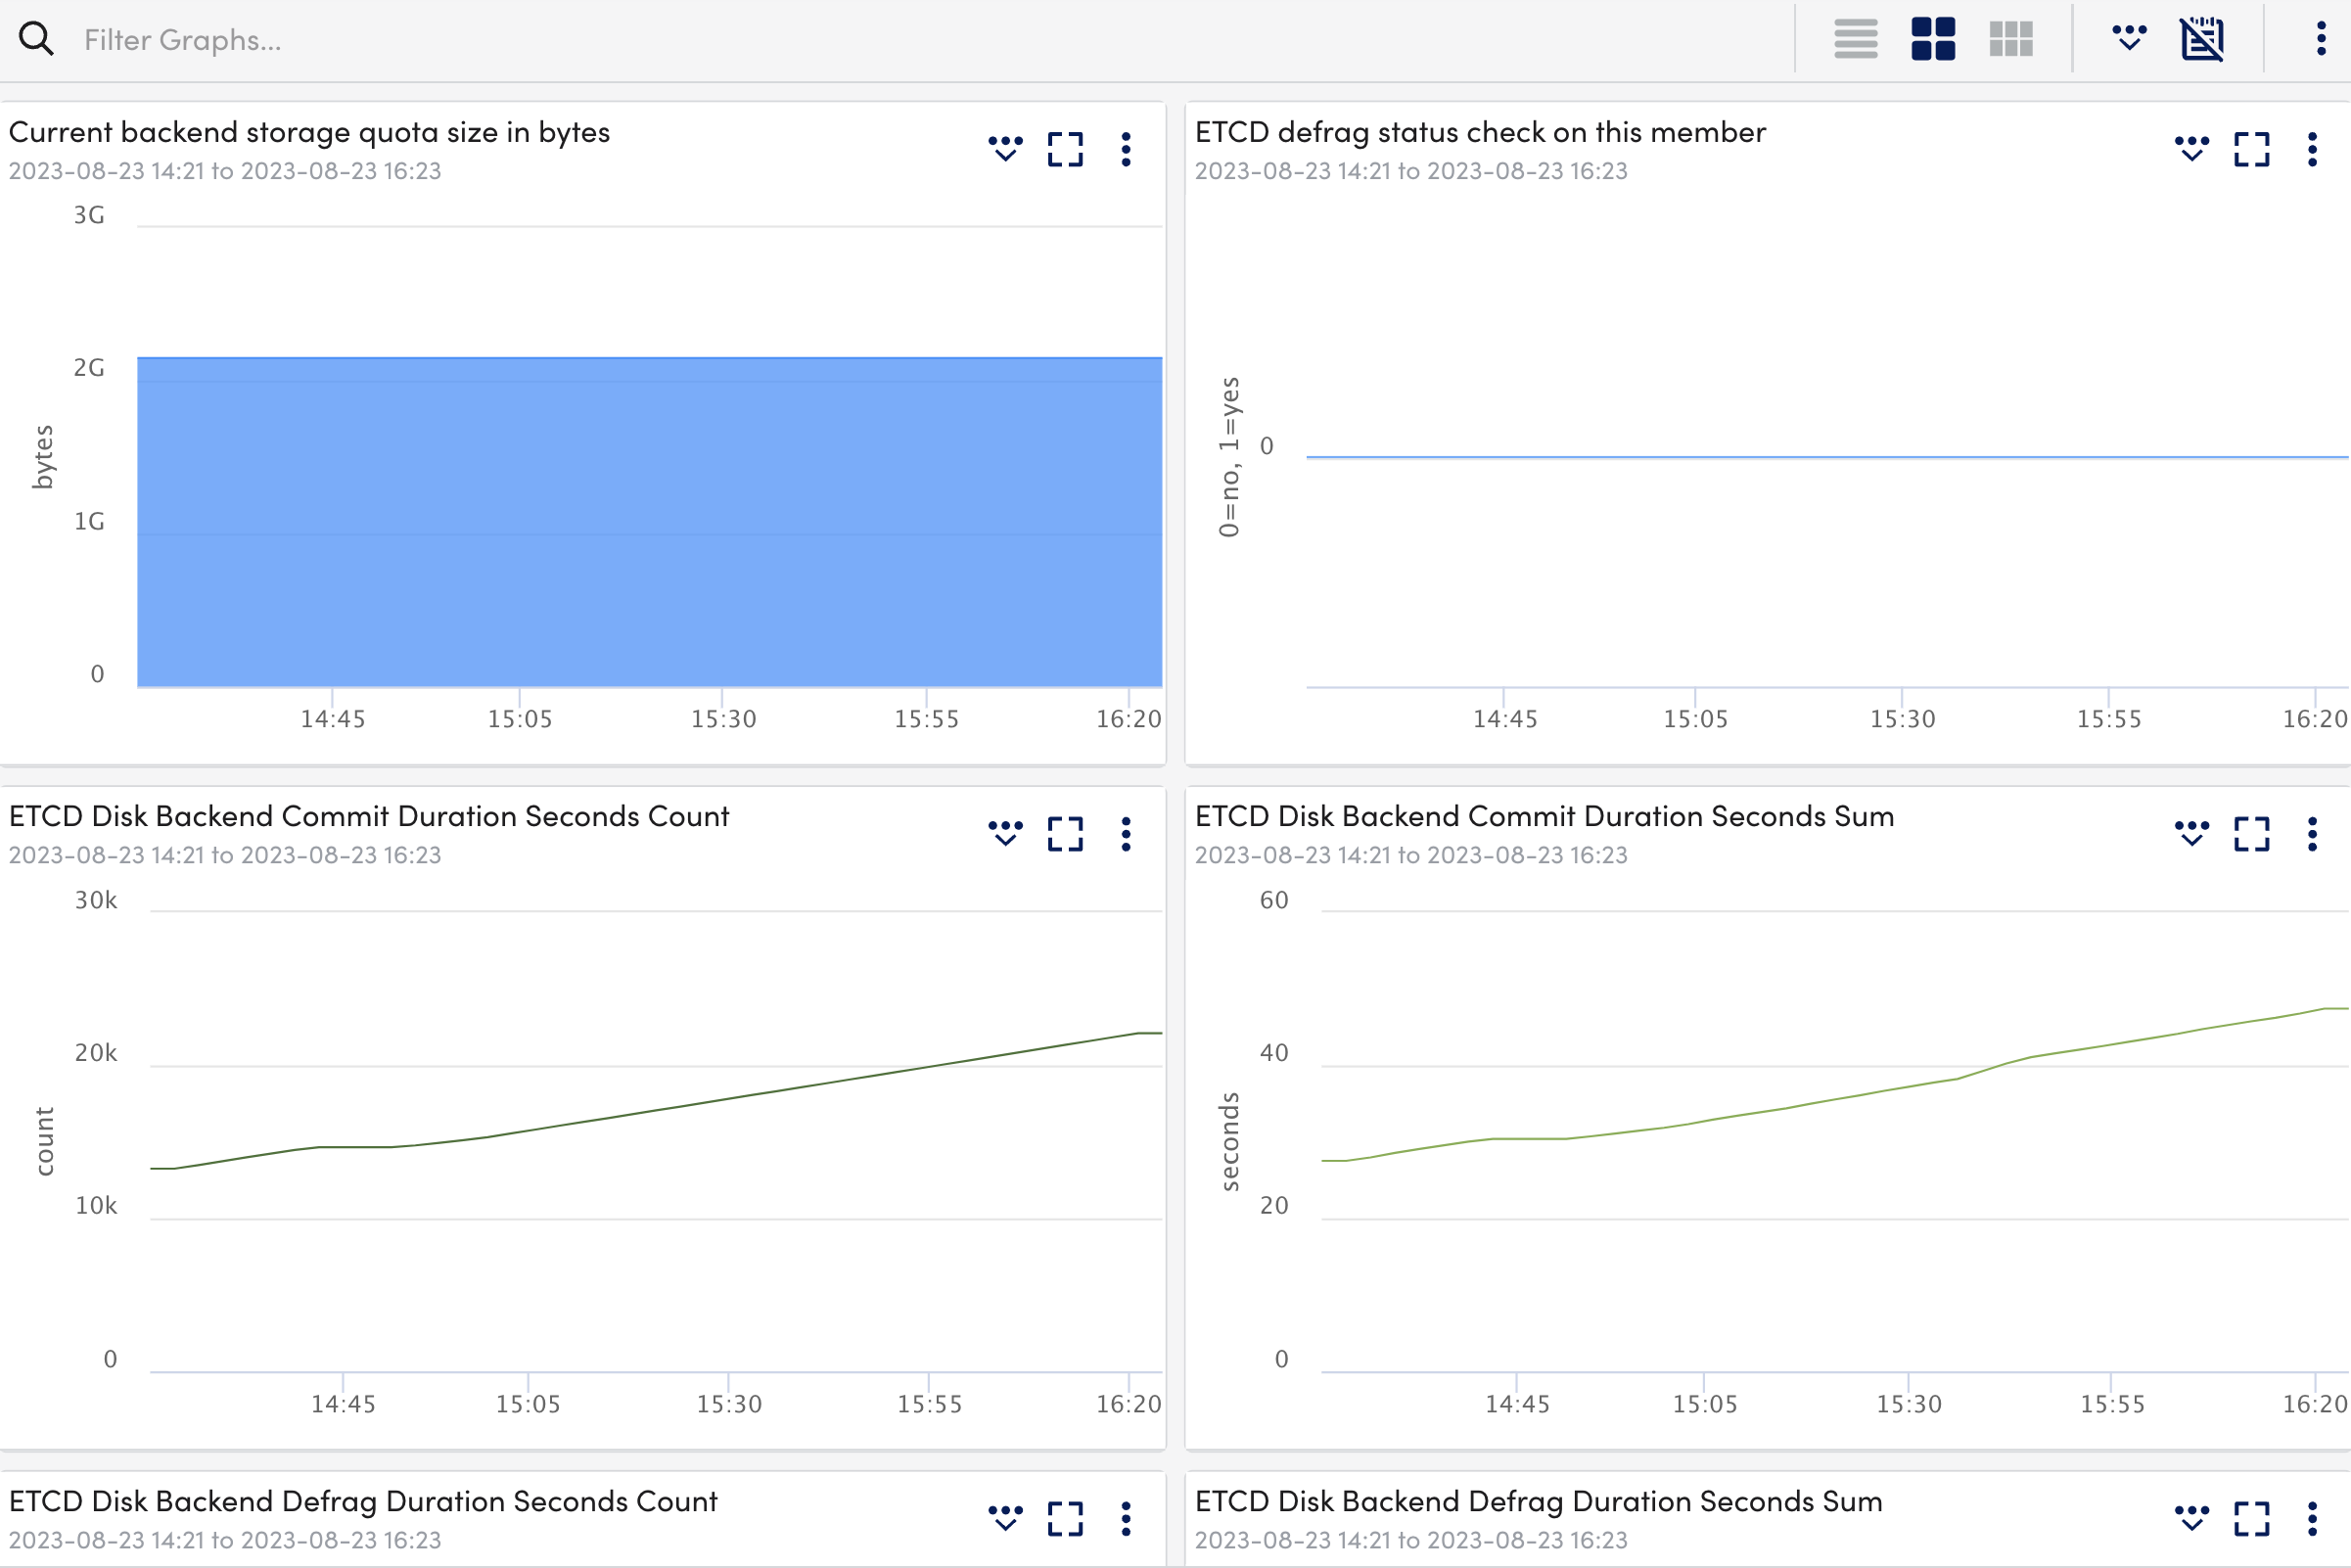
- Select the Graphs tab to view the status or the details of the Kubernetes etcd in the graphical format.
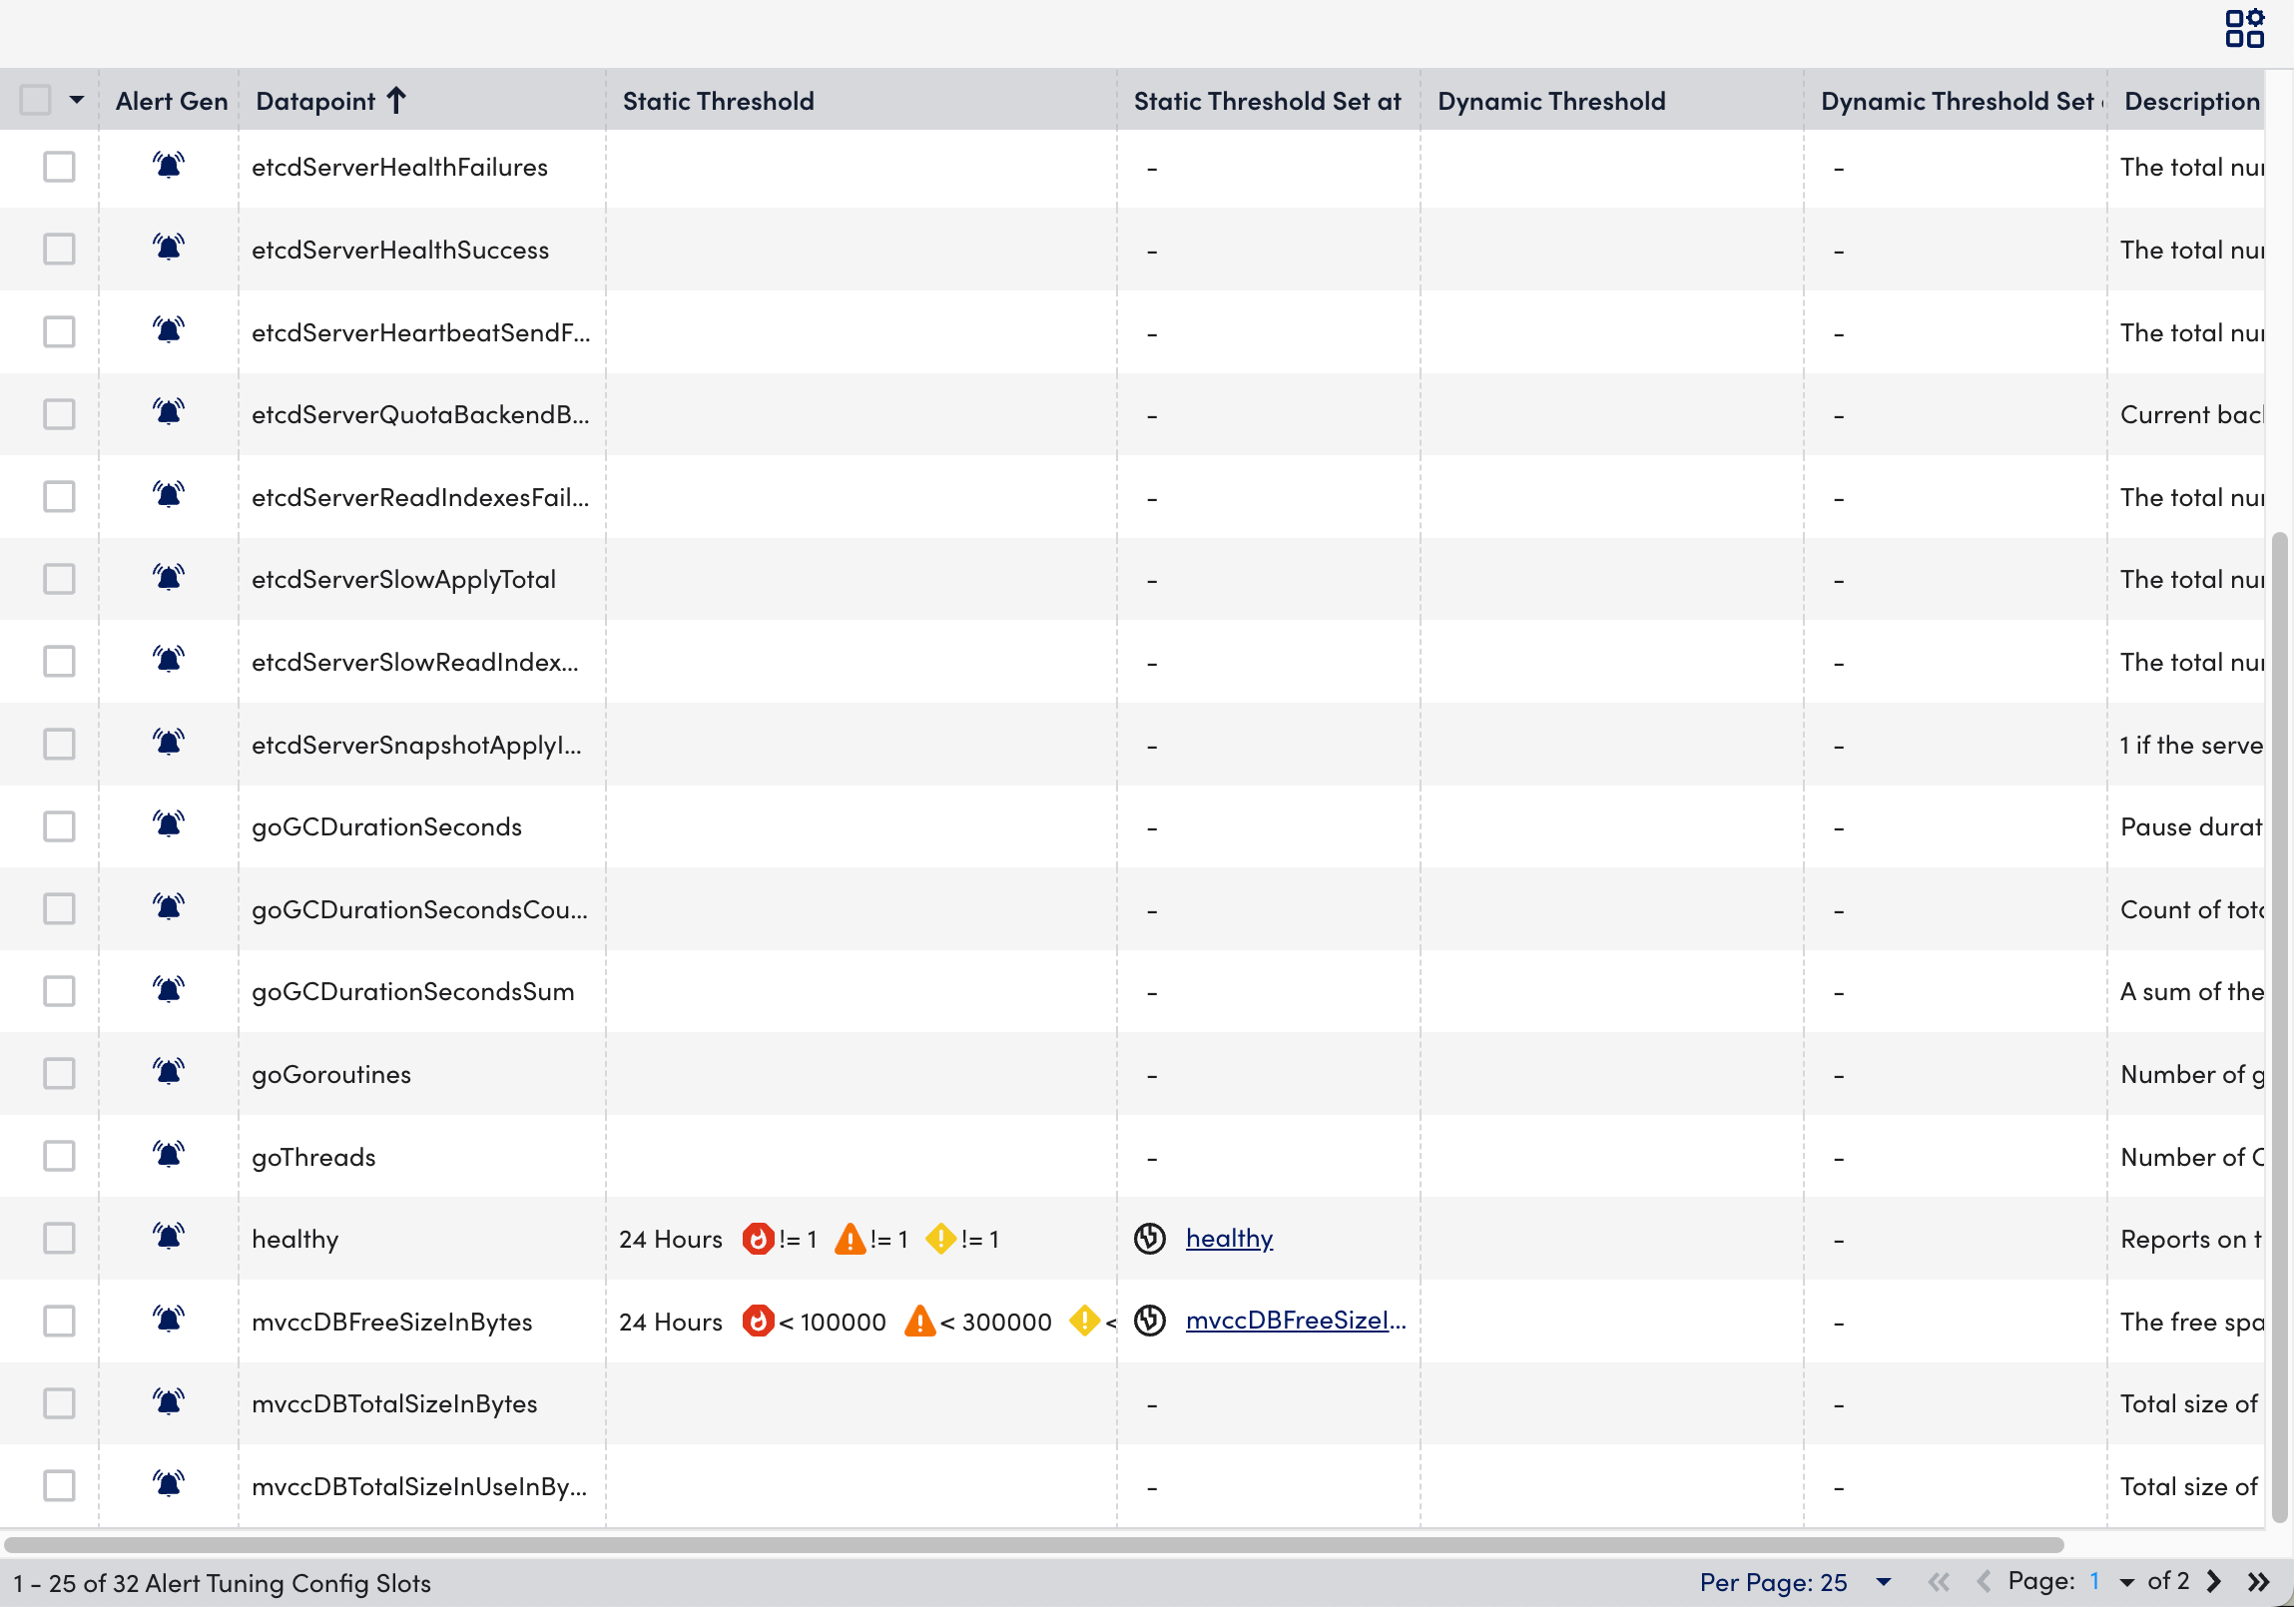
- Select the Alert Tuning tab to view the datapoints on which the alerts are generated.
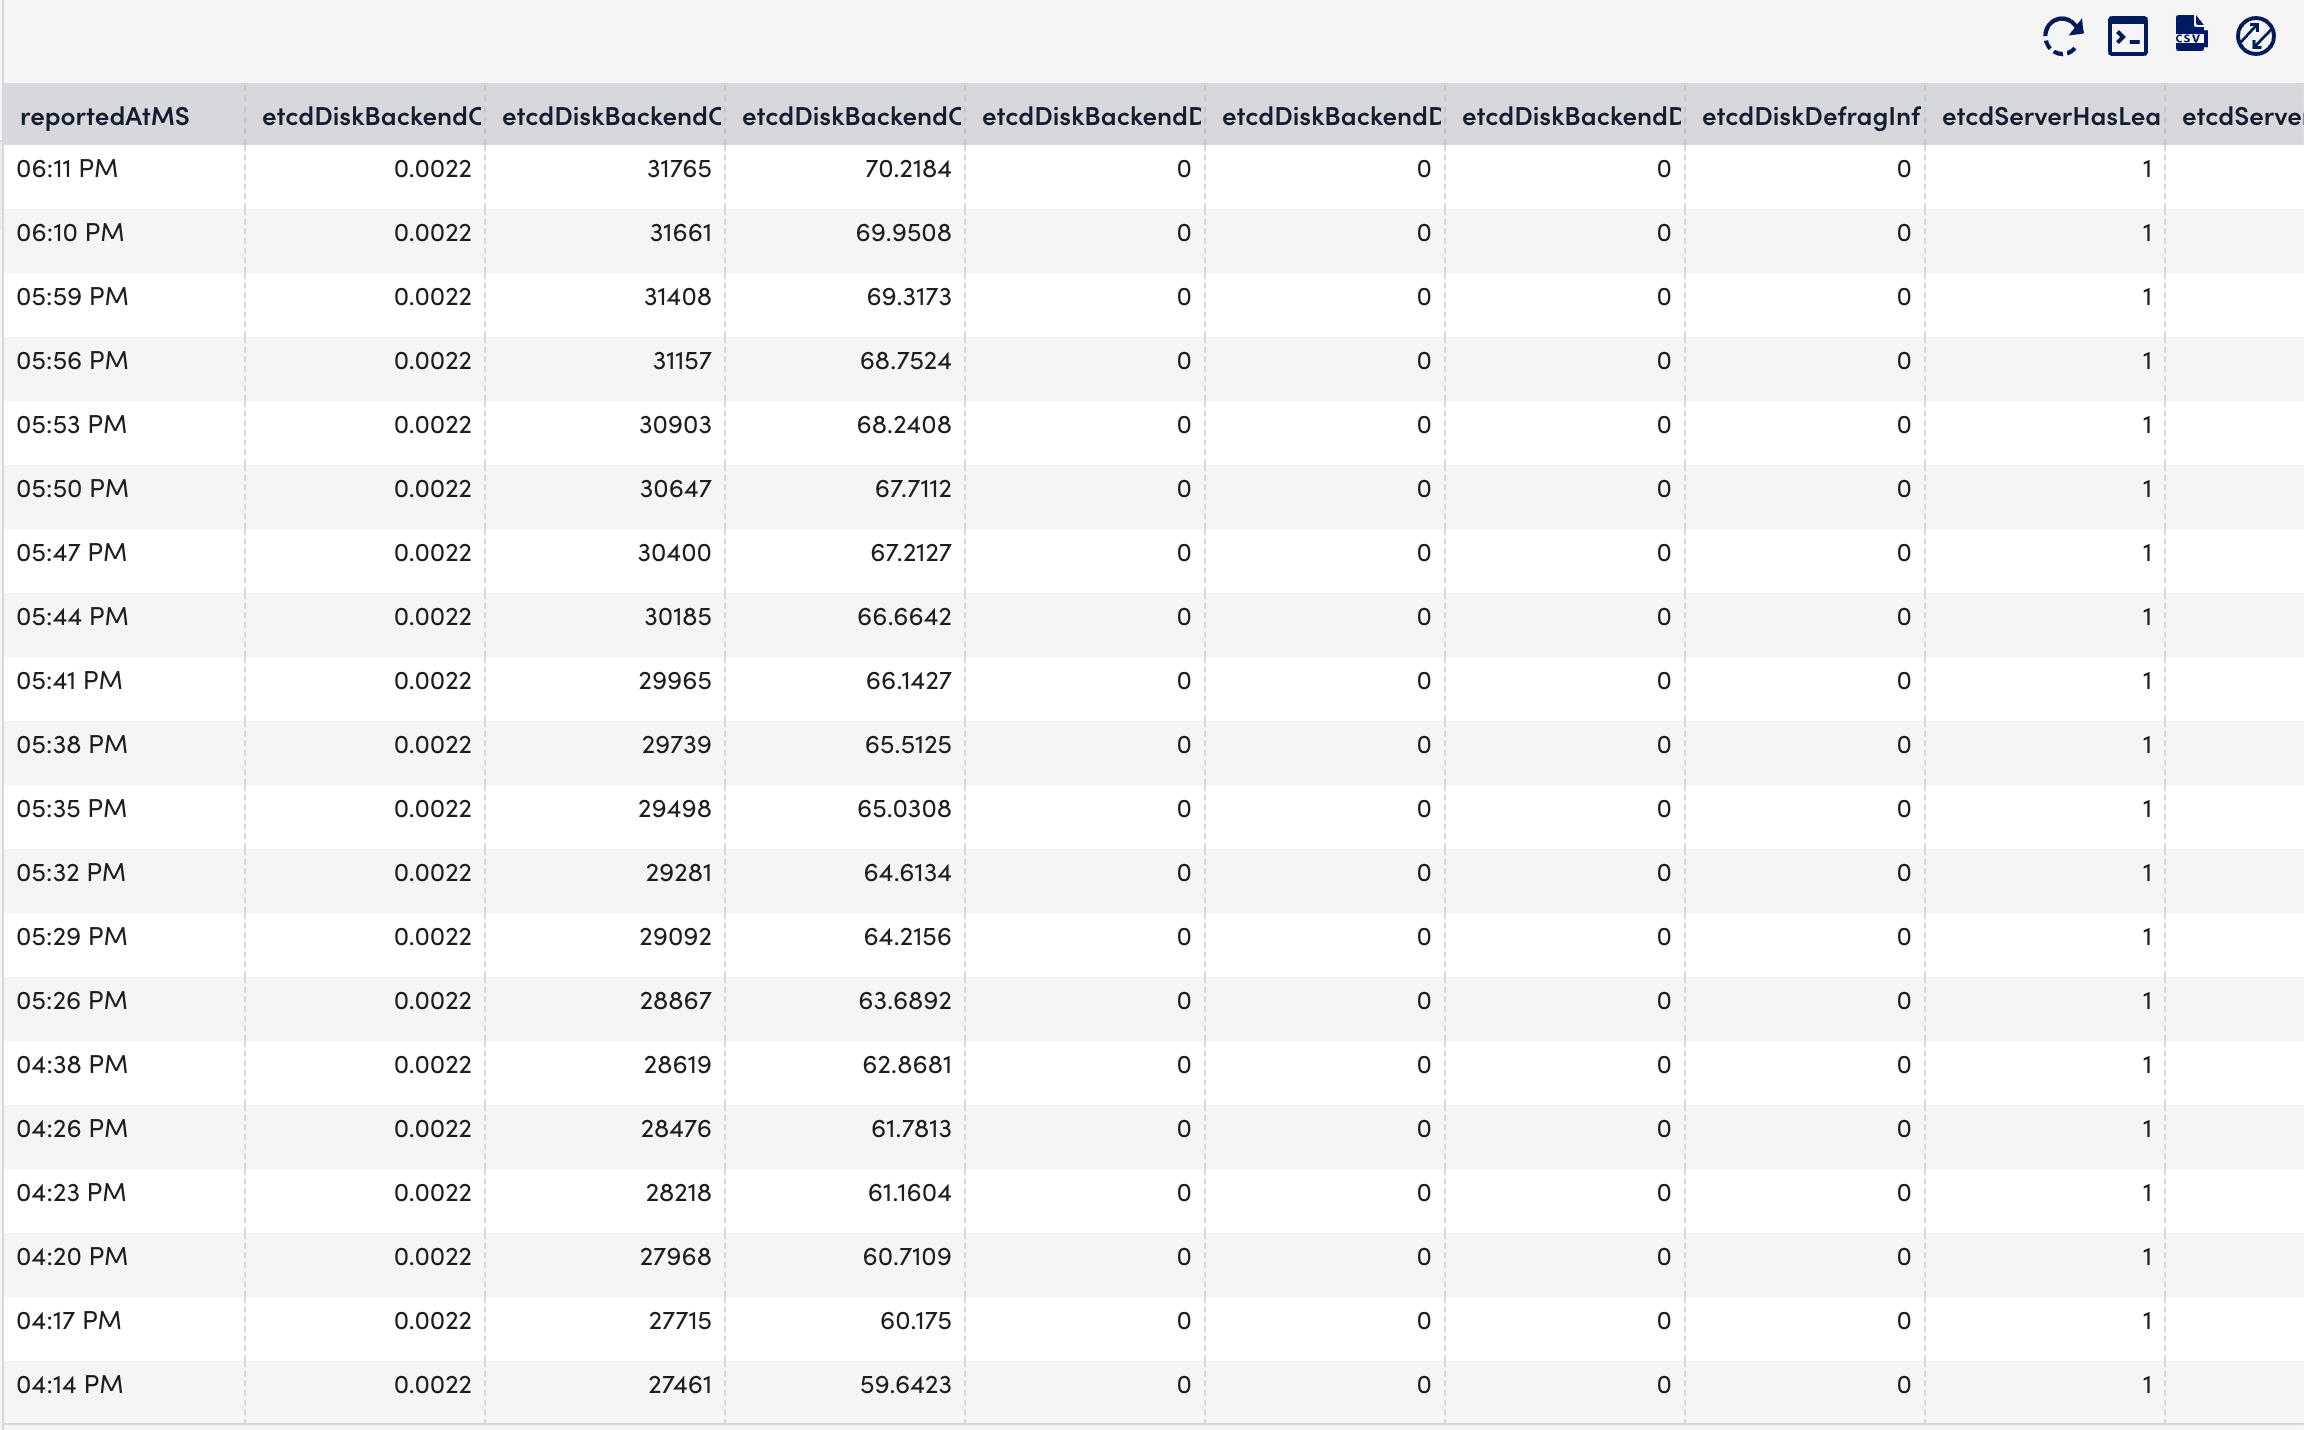
- Select the Raw Data tab to view all the data returned for the defined instances.
The Controller Manager are control loops that continuously watch the state of your cluster loop in a Kubernetes cluster. The Controller Manager monitors the current state of your cluster through the API Server and makes appropriate changes to keep the application running by ensuring sufficient Pods are in a healthy state. For more information, see Controllers from Kubernetes documentation.
Important: We do not support Kubernetes Controller Manager monitoring for managed services like OpenShift, Amazon Elastic Kubernetes Service (EKS), Google Kubernetes Engine (GKE), and Azure Kubernetes Service (AKS) because they do not expose the Kubernetes Control Plane components.
Requirements for Monitoring Controller Manager
Ensure you have the Kubernetes_Controller_Manager datasource enabled.
Note: This is a multi-instance datasource, with each instance indicating a Controller Manager. This datasource is available for download from LM Exchange.
Setting up Kubernetes Controller Manager Monitoring
Installation
You do not need separate installation on your server to use the Kubernetes Controller Manager.
Depending on your preference, you can install LM Containers with the following two options:
- Installing through the user interface. For more information, see Installing the LM Container Helm Chart.
- Installing through the command line interface. For more information, see Installing LM Container Chart using CLI.
Configuration
The Kubernetes Controller Manager is pre-configured for monitoring. If you do not see any data for the Kubernetes Controller Manager resource, do the following:
- In your system, enter /etc/kubernetes/manifests in the terminal.
- Open the kube-controller-manager.yaml file for updating.
- In kube-controller-manager Pod under kube-system namespace, change the –bind-address at .spec.containers.command from 127.0.0.1 to <Value of status.podIP present on kube-controller-manager pod>.
Note: Run the kubectl get pod -n kube-system -o yaml | grep “podIP” command to get the value of status.podIP present on kube-controller-manager pod .
- Save the kube-controller-manager.yaml file.
Note: If –bind-address is missing, the scheduler continues to run with its default value 0.0.0.0.
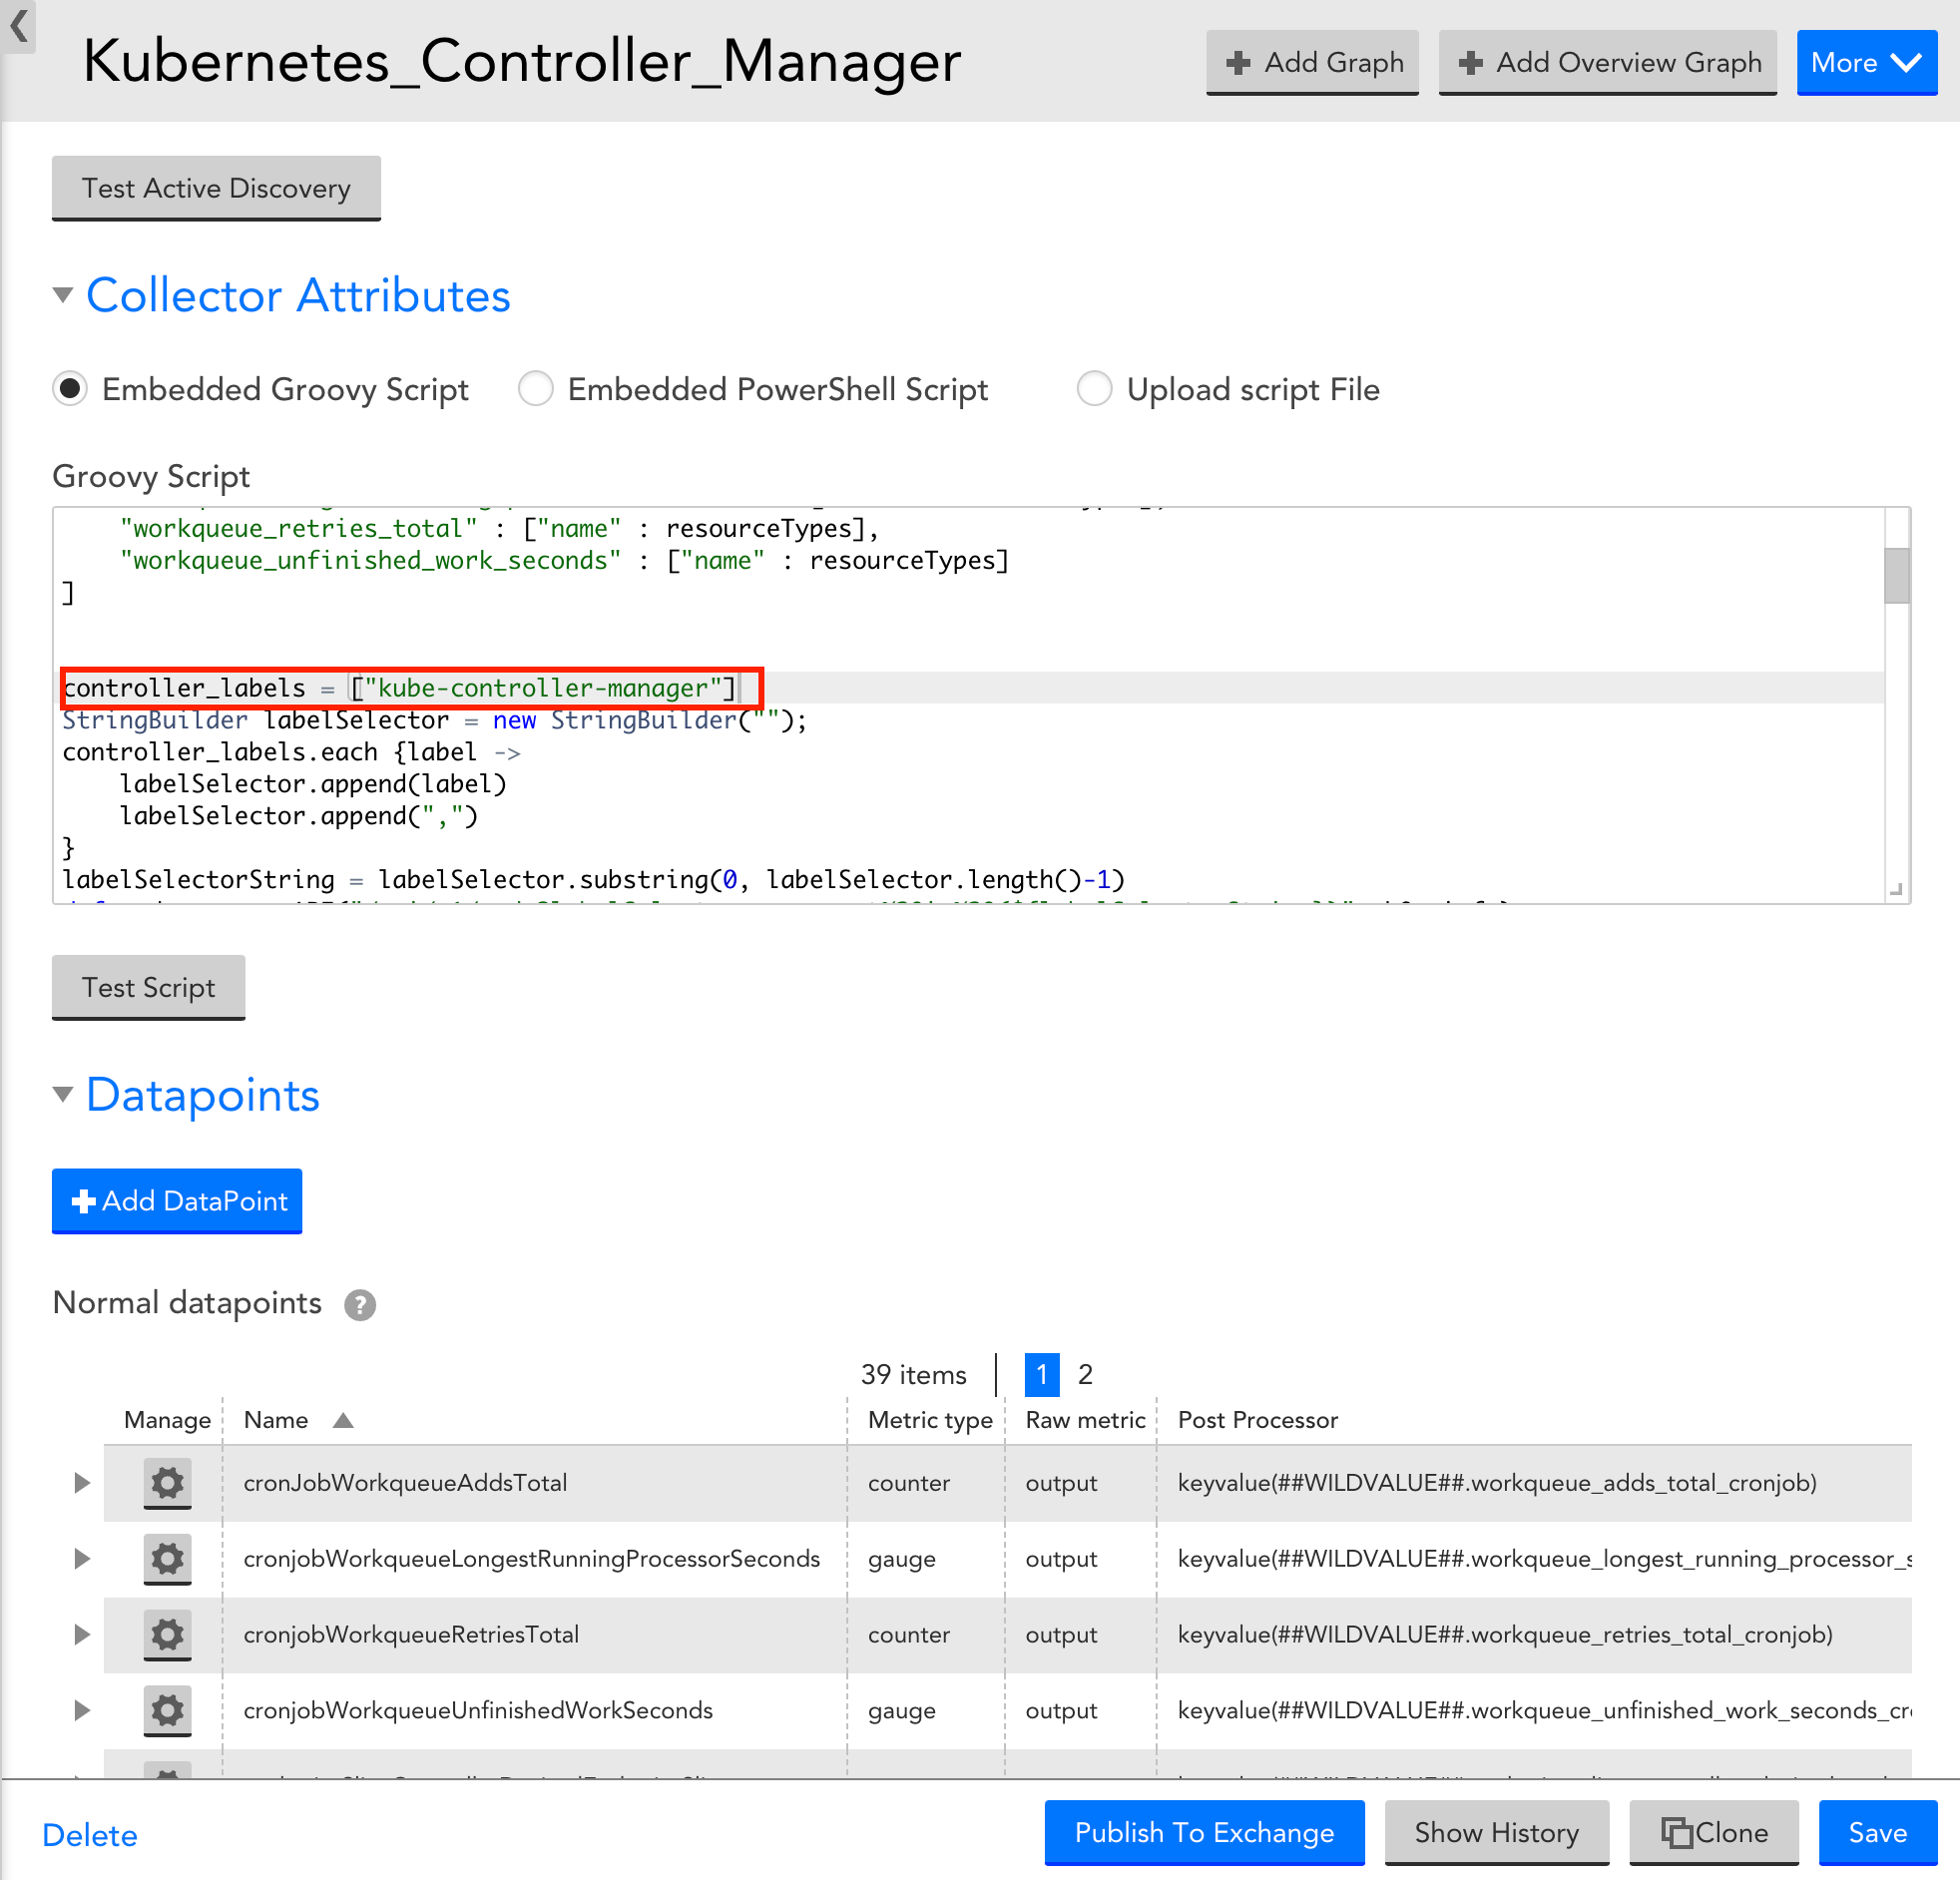
For monitoring custom controlled managers, do as follows:
- In LogicMonitor, navigate to Settings > DataSources > select Kubernetes Controller Manager DataSource.
- In the Kubernetes Controller Manager DataSource page, expand Active Discovery.
- In the Parameters section, select the Embedded Groovy Script option.
- In the Groovy Script field, enter the required component name for the controller_label array.
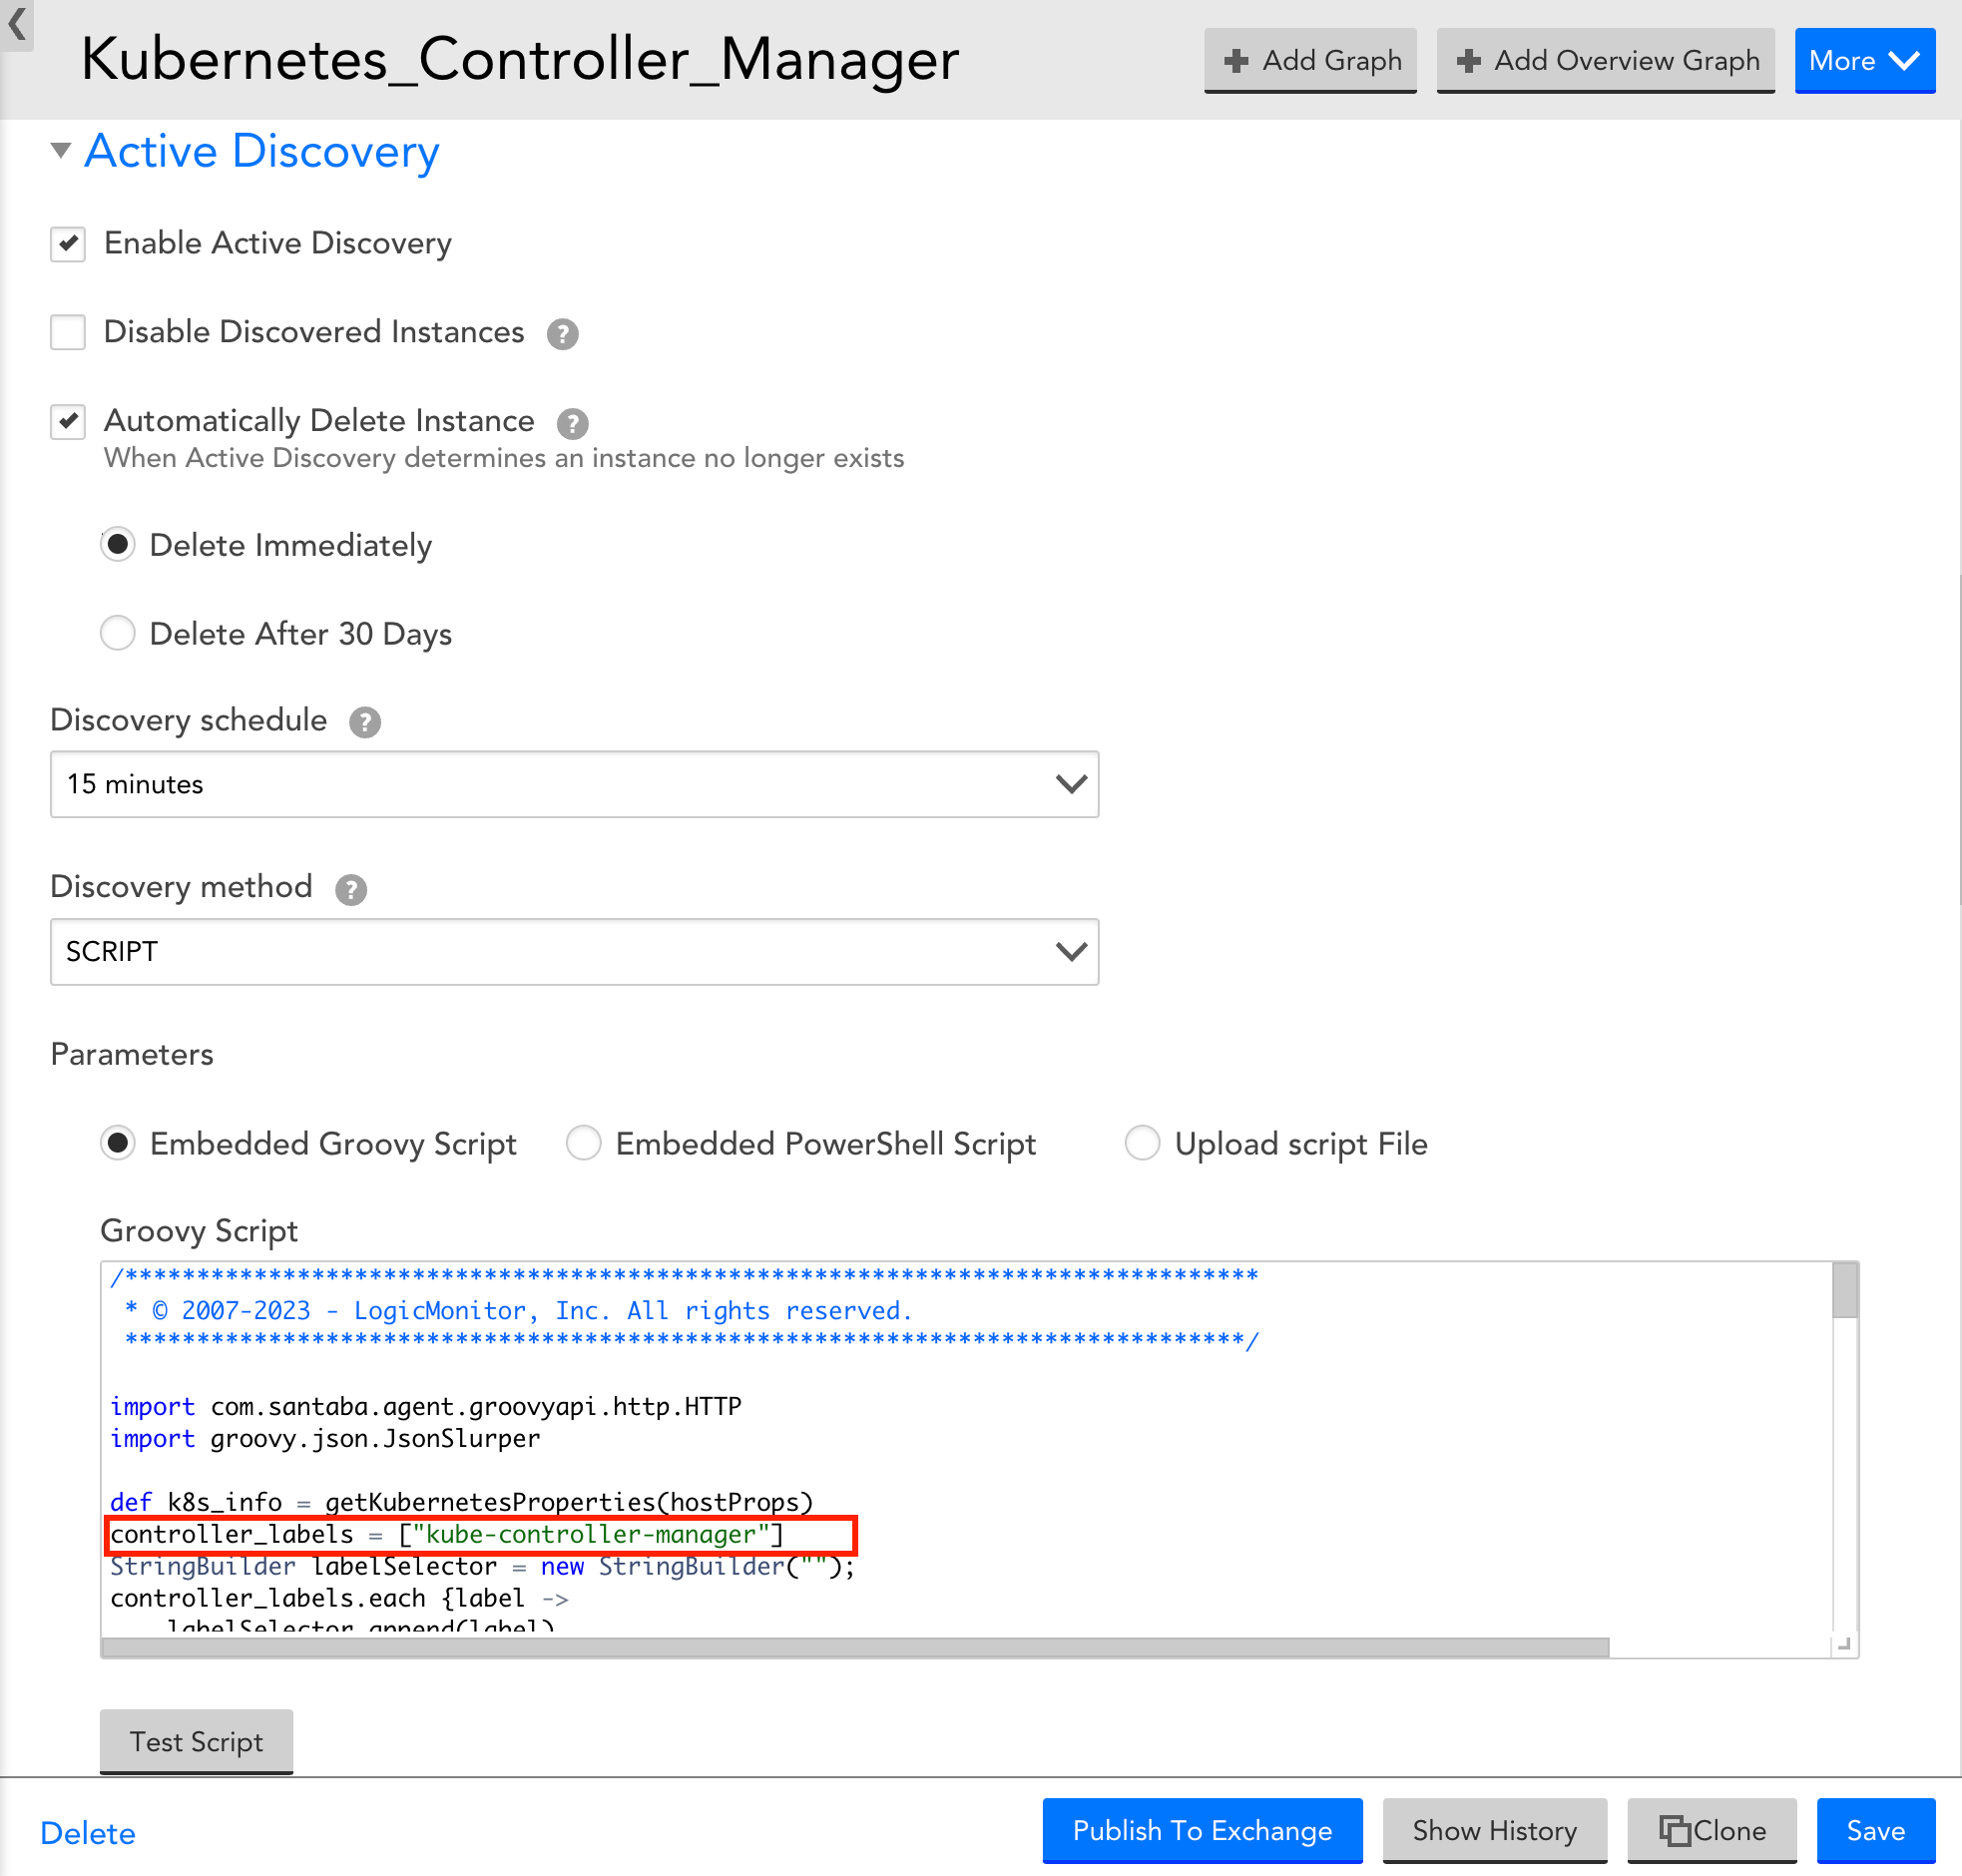
- Expand Collector Attributes and in the Groovy Script field, enter the required component name for the controller_label array.
- Select Save to save the Kubernetes Controller Manager DataSource.
Viewing Kubernetes Controller Manager Details
Once you have installed and configured the Kubernetes Controller Manager on your server, you can view all the relevant data on the Resources page.
- In LogicMonitor, navigate to Resources > select the required Kubernetes Controller Manager resource.
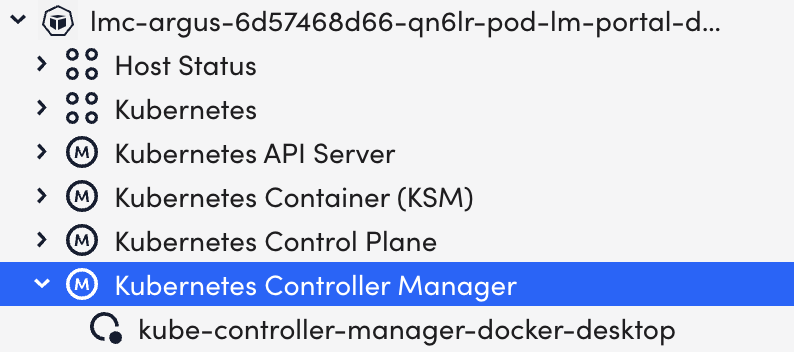
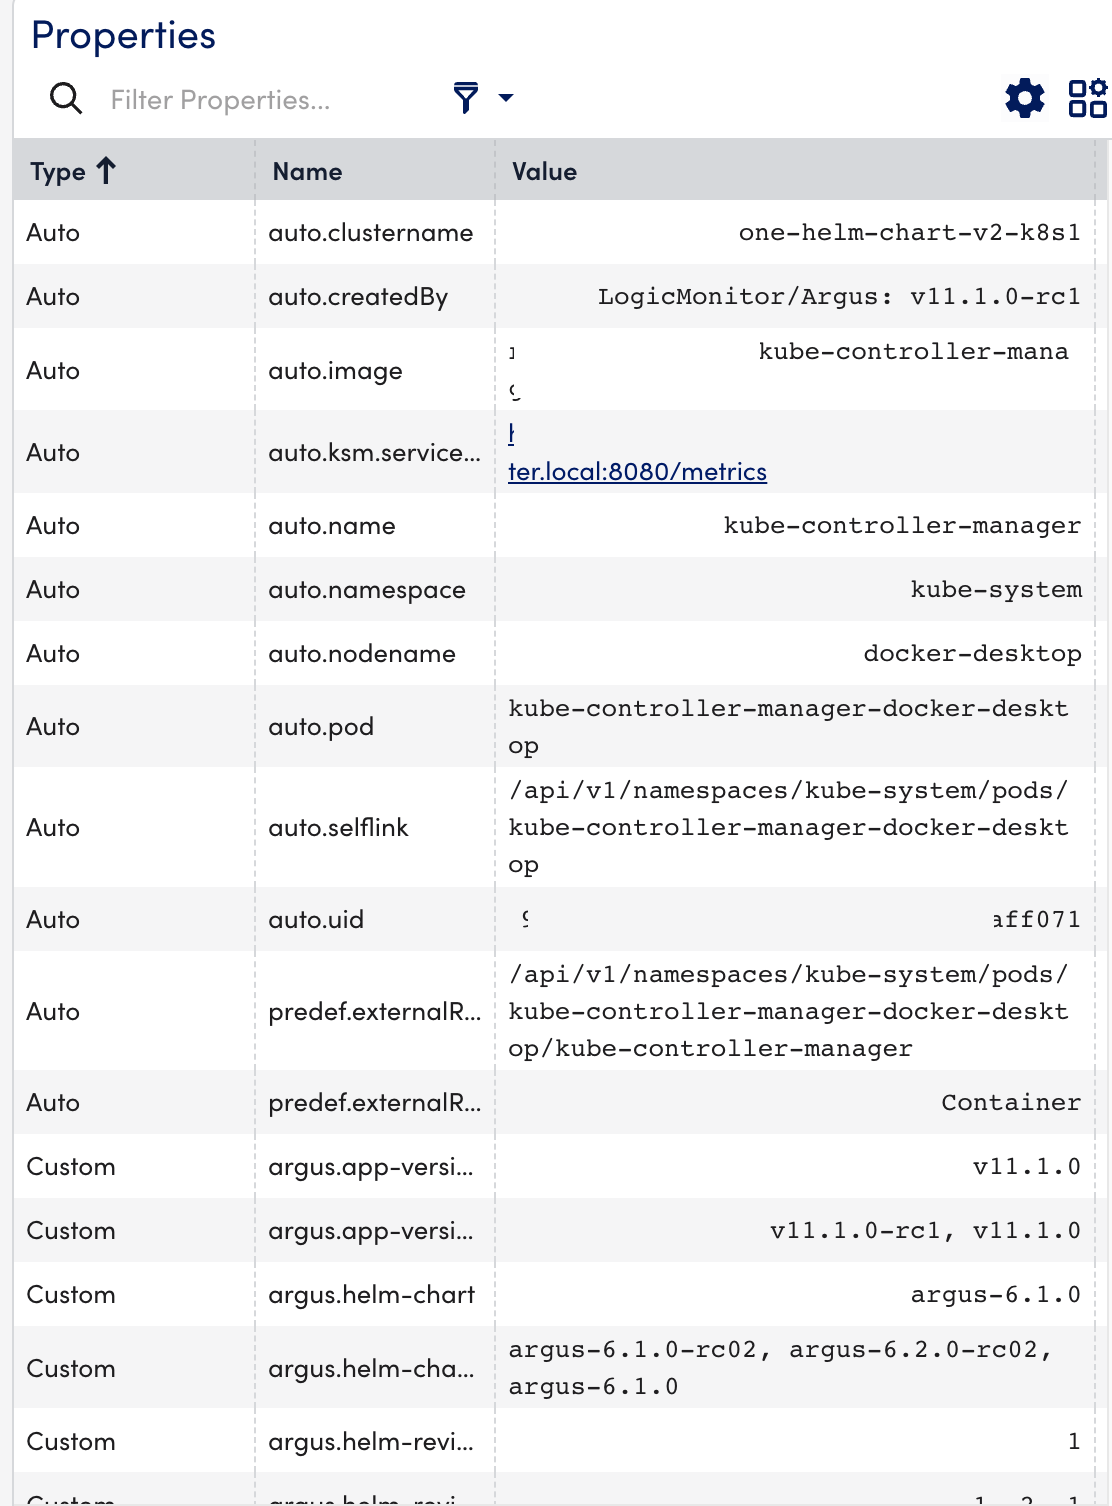
- Select the Info tab to view the different properties of the Kubernetes Controller Manager.
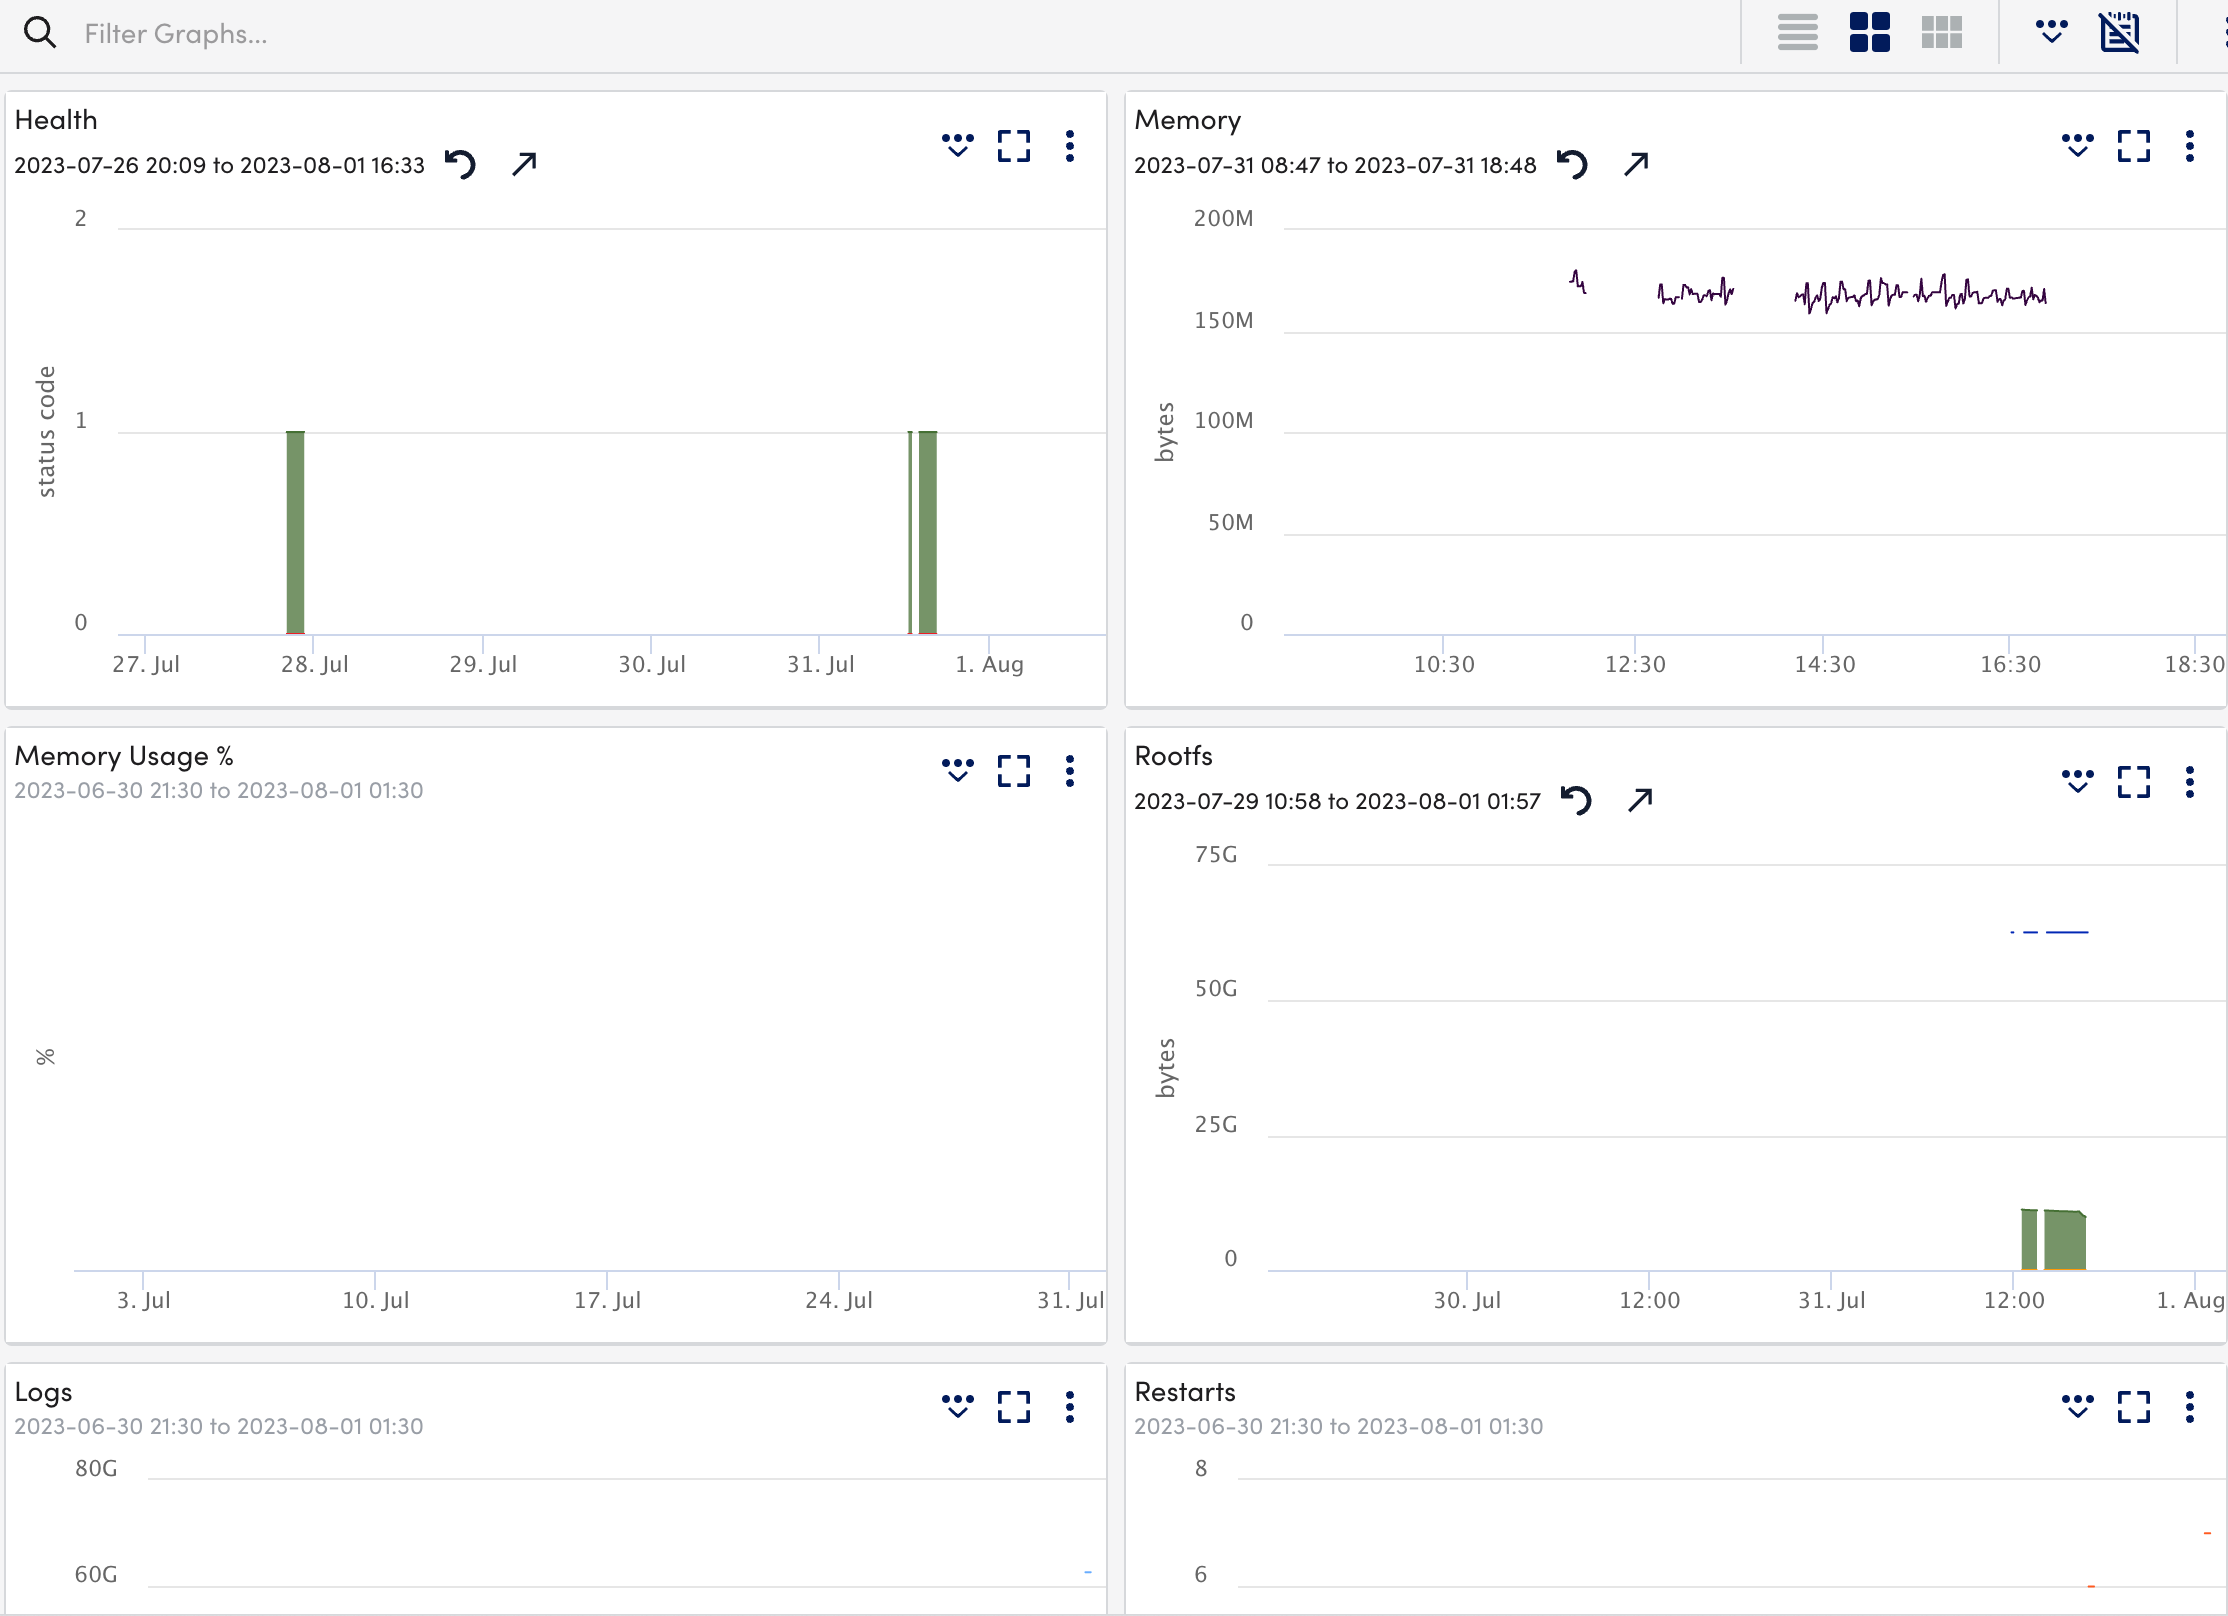
- Select the Alerts tab to view the alerts generated while checking the status of the Kubernetes Controller Manager resource.

- Select the Graphs tab to view the status or the details of the Kubernetes Controller Manager in the graphical format.
- Select the Alert Tuning tab to view the datapoints on which the alerts are generated.
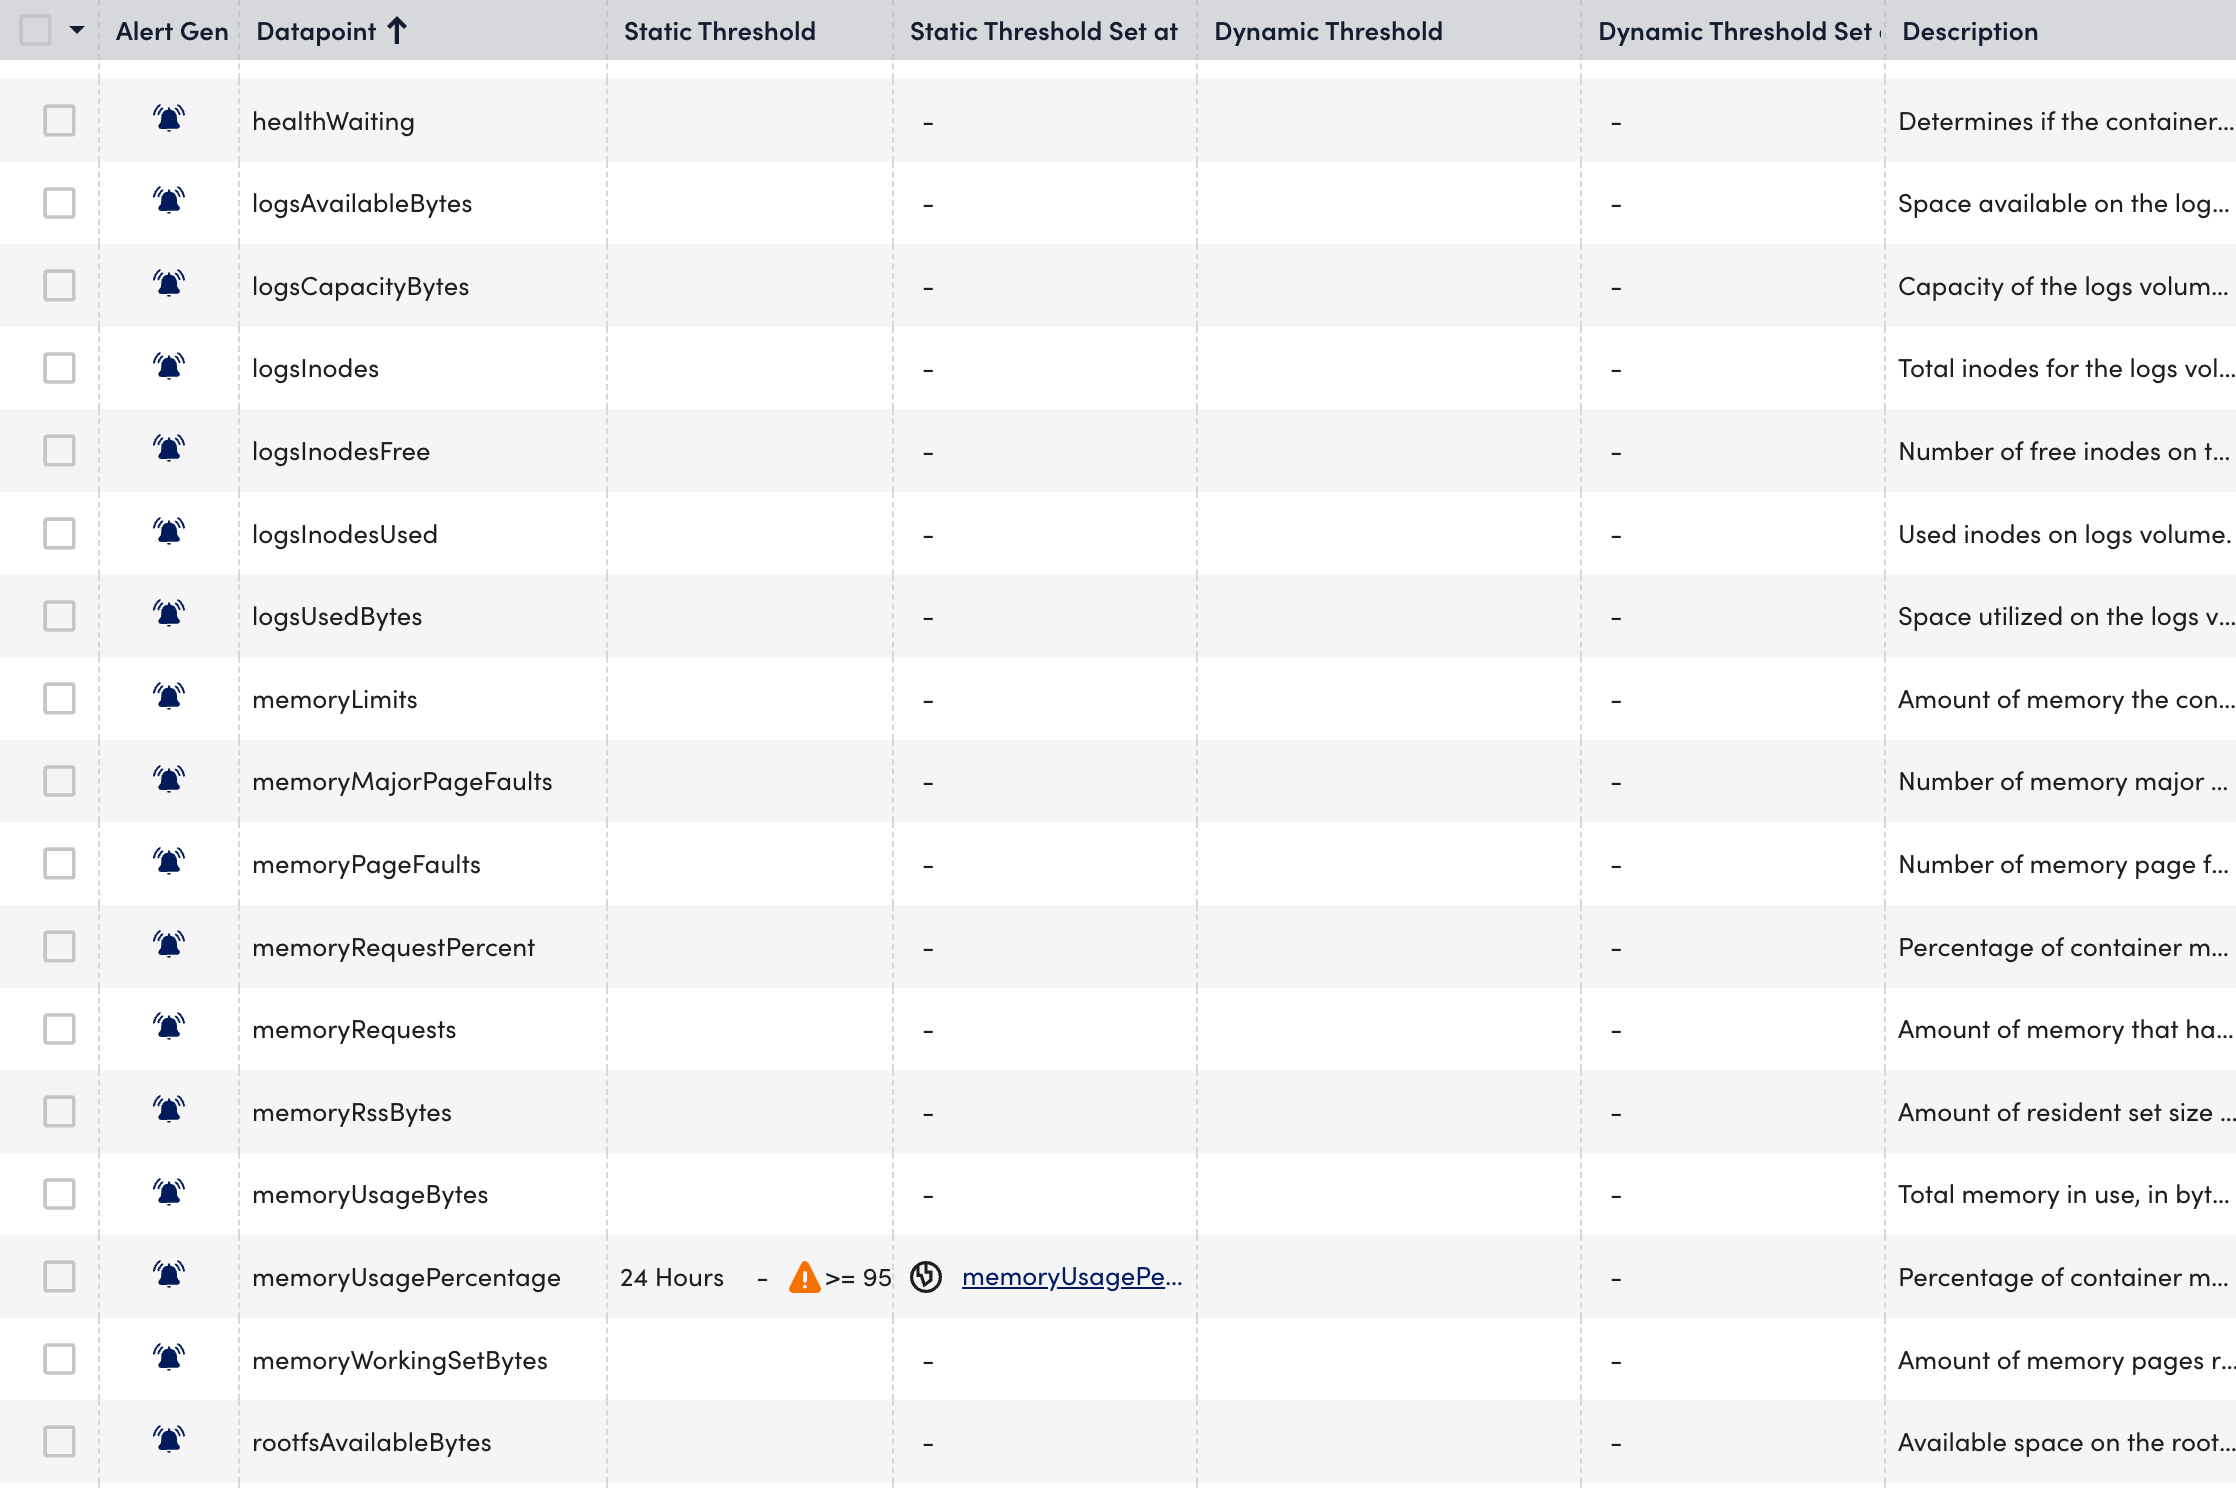
- Select the Raw Data tab to view all the data returned for the defined instances.

The Ingress is a Kubernetes resource that exposes HTTP and HTTPS routes from outside the cluster to services within the cluster. The cluster must have an ingress controller running for the Ingress resource to work. For more information, see Ingress and Ingress Controllers from Kubernetes documentation.
NGINX Ingress Controller is a type of ingress controller that runs in a cluster and configures an HTTP load balancer according to traffic routing rules. For more information, see How NGINX Ingress Controller Works from NGINX documentation.
Important: NGINX Ingress Controller Monitoring is available with LM Container Helm Charts version 4.2.0 or later.
Requirements for Monitoring NGINX Ingress Controller
- Ensure to enable Prometheus metrics in NGINX Ingress Controller. For more information on exposing Prometheus, see Prometheus from NGINX documentation.
- Ensure to have the Kubernetes_Nginx_IngressController datasource and addCategory_NginxIngressController propertysource enabled.
Note: This is a multi-instance datasource, with each instance indicating a replica (Pod) of the NGINX Ingress Controller. This datasource is available for download from LM Exchange.
Setting up NGINX Ingress Controller Monitoring
Installation
You do not need any separate installation on your cluster to use the NGINX Ingress Controller.
Depending on your preference, you can install LM Containers with the following two options:
- Installing through the user interface. For more information, see Installing the LM Container Helm Chart.
- Installing through the command line interface. For more information, see Installing LM Container Chart using CLI.
Configuration
The NGINX Ingress Controller is pre-configured for monitoring. No additional configurations are required.
Viewing NGINX Ingress Controller Details
Once you have installed and configured the NGINX Ingress Controller on your server, you can view all the relevant data on the Resources page.
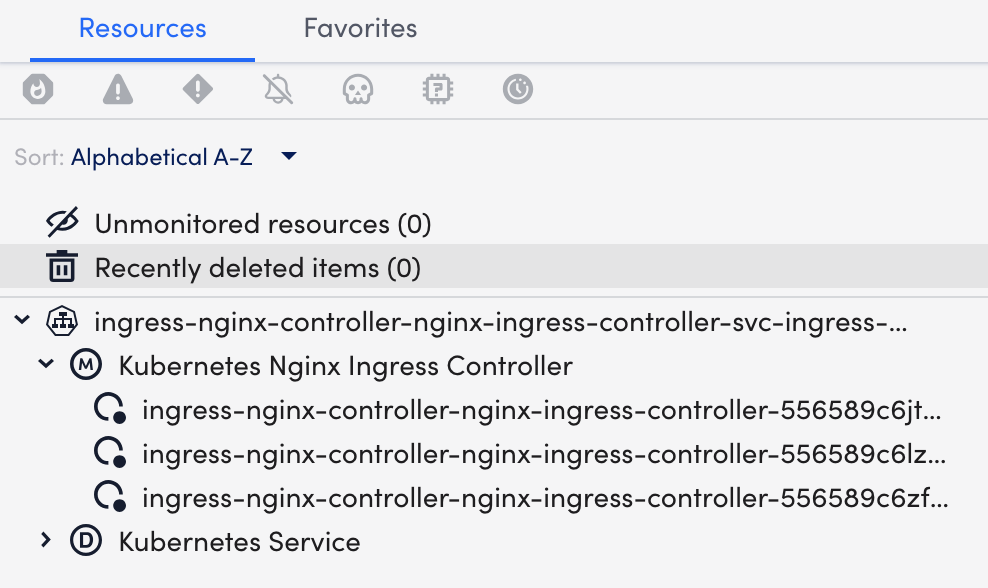
- In LogicMonitor, navigate to Resources > select the required NGINX Ingress Controller service.
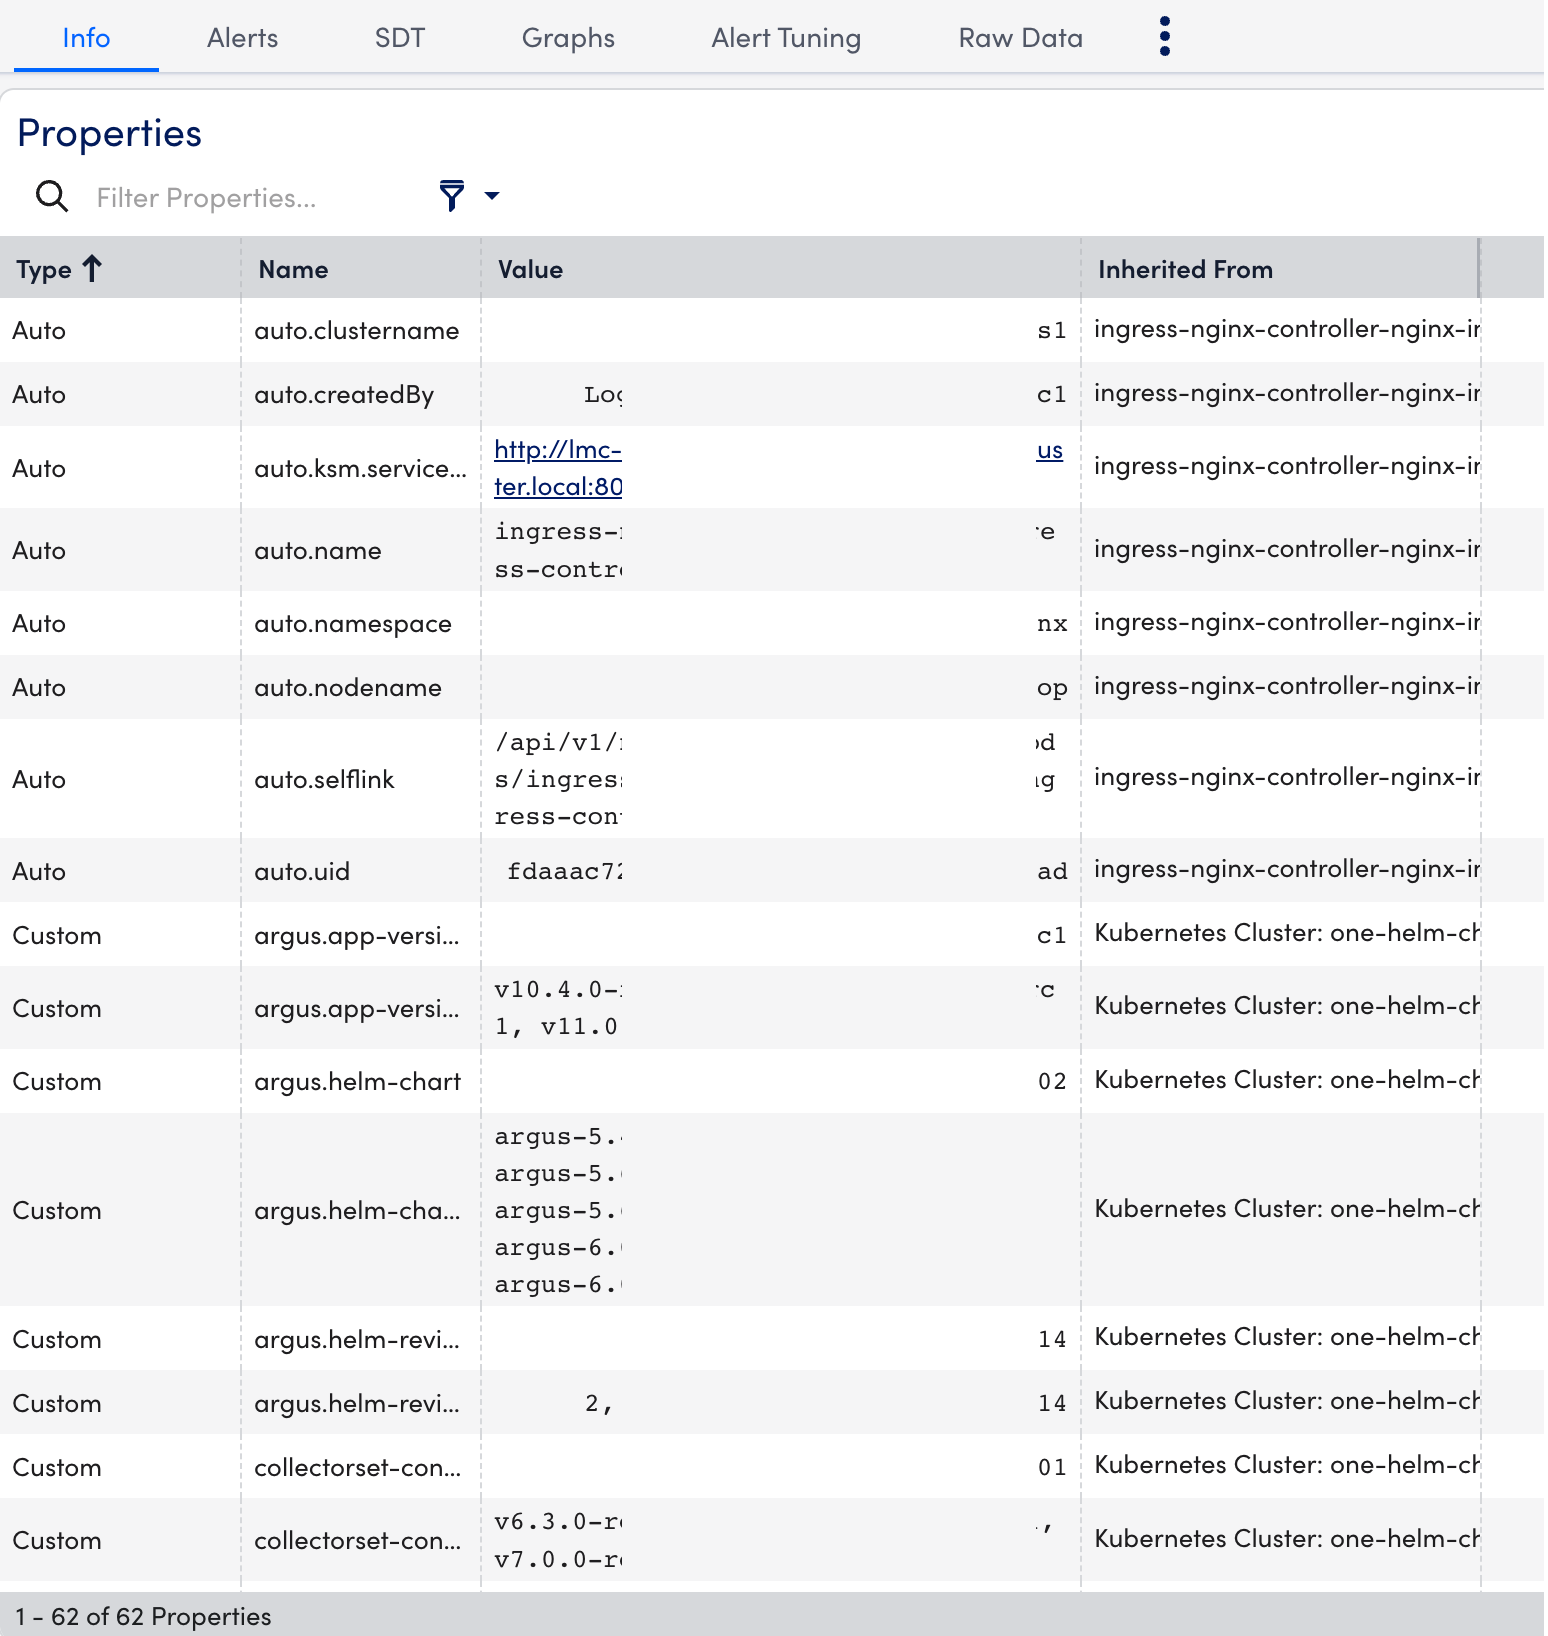
- Select the Info tab to view the different properties of the NGINX Ingress Controller.
- Select the Alerts tab to view the alerts generated while checking the status of the NGINX Ingress Controller resource.

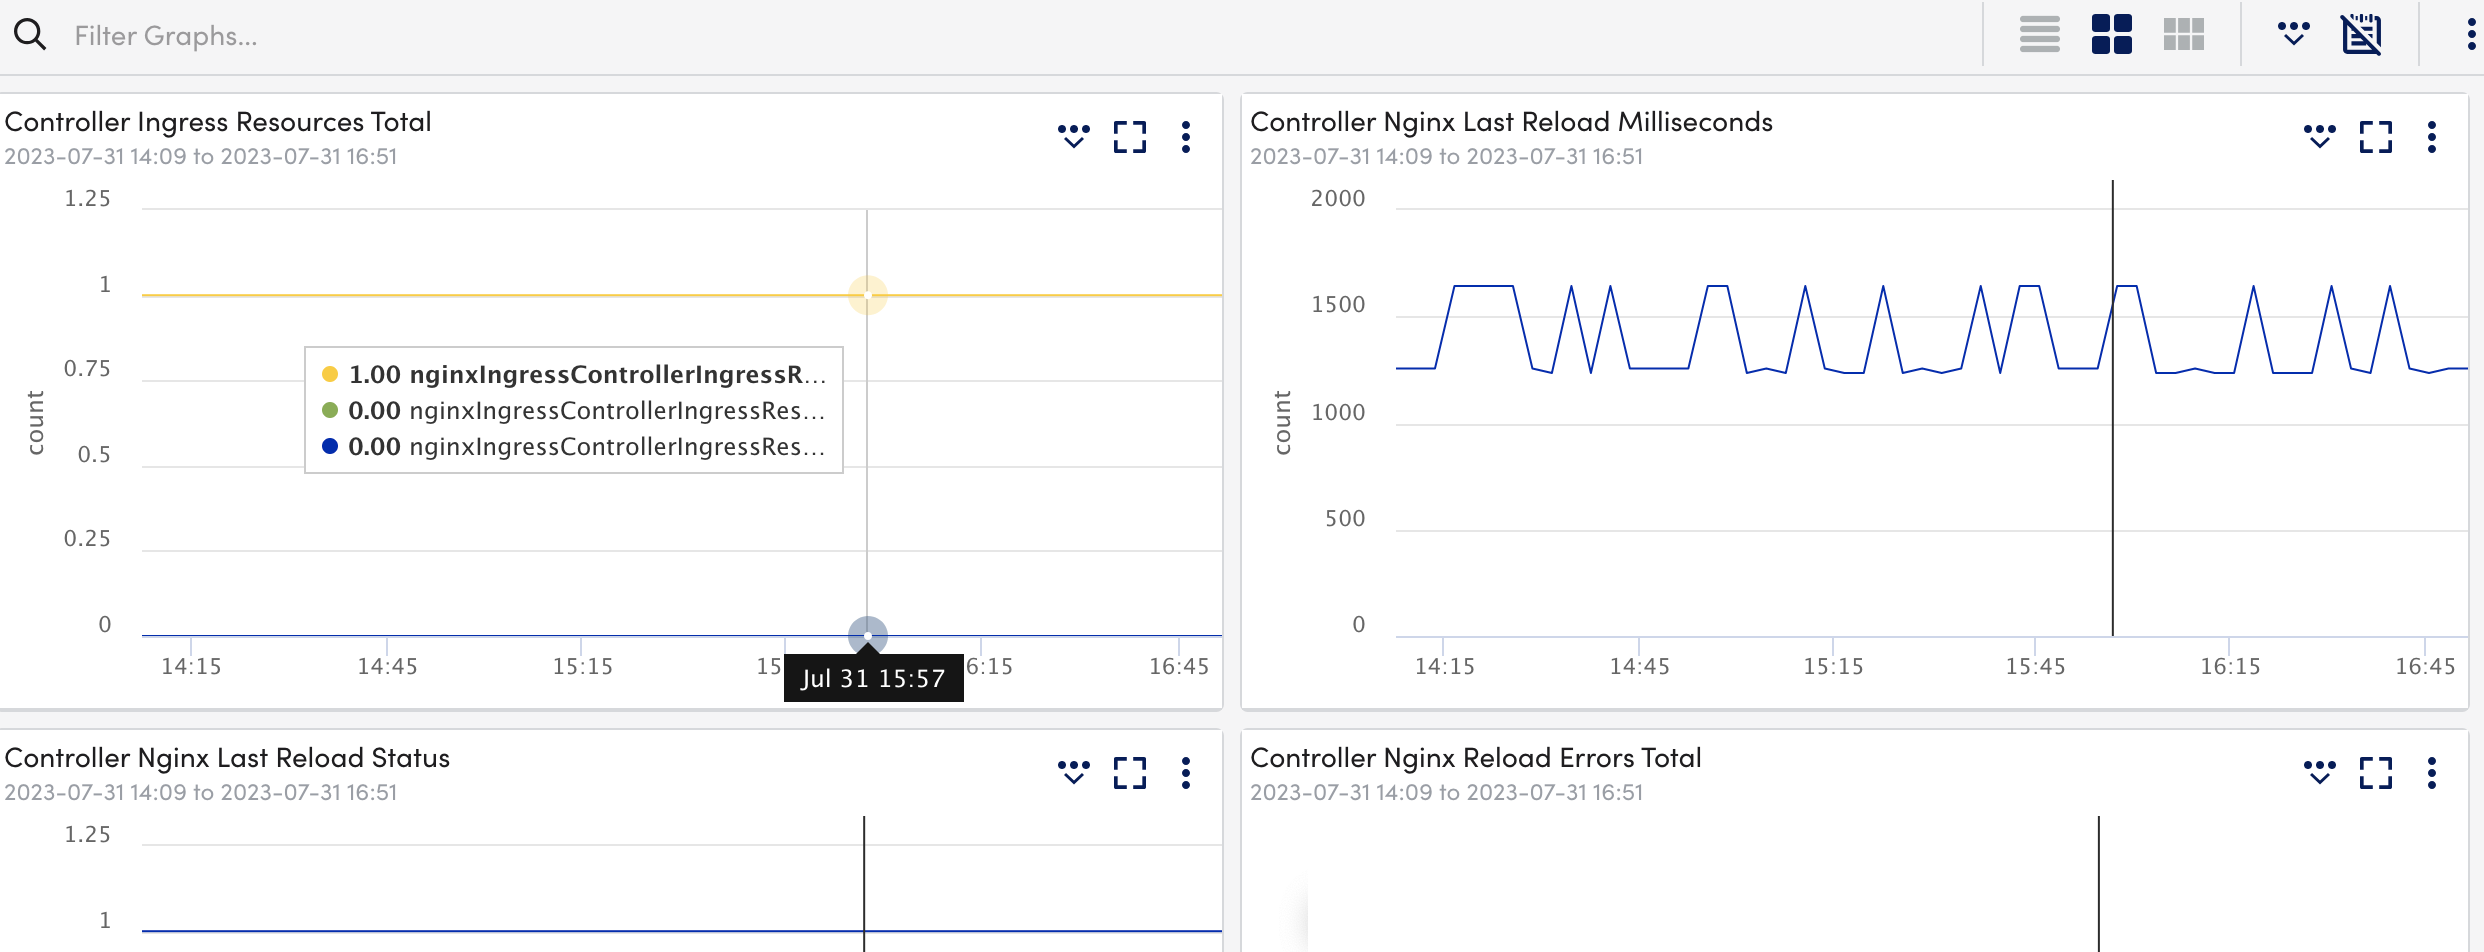
- Select the Graphs tab to view the status or the details of the NGINX Ingress Controller in the graphical format.
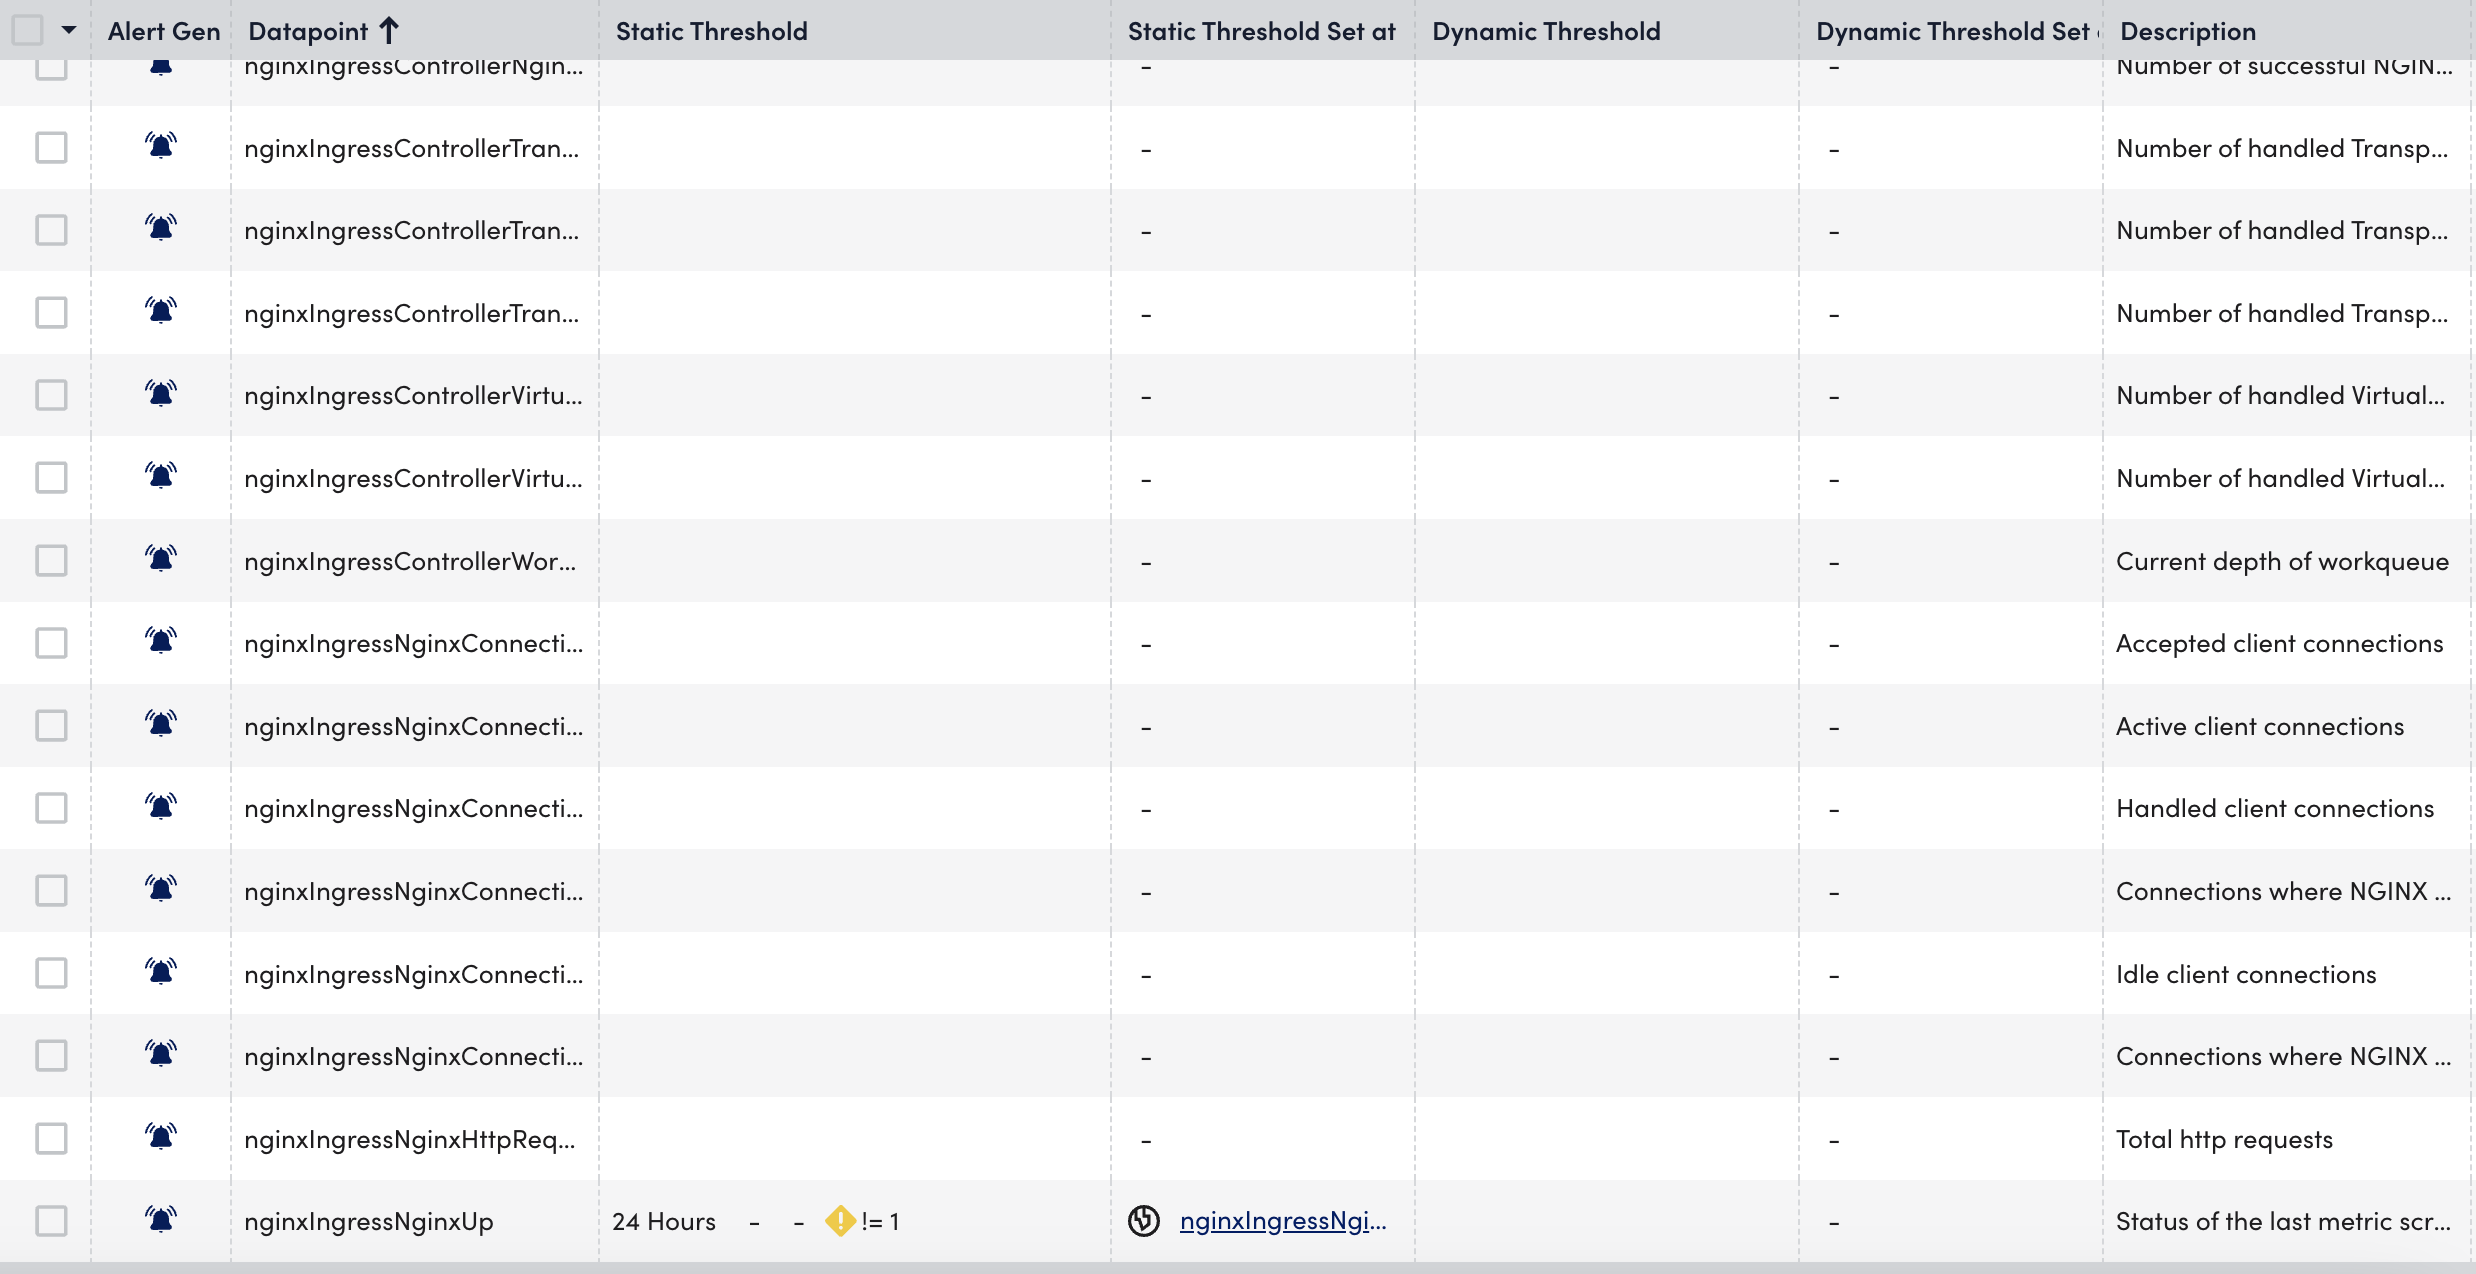
- Select the Alert Tuning tab to view the datapoints on which the alerts are generated.
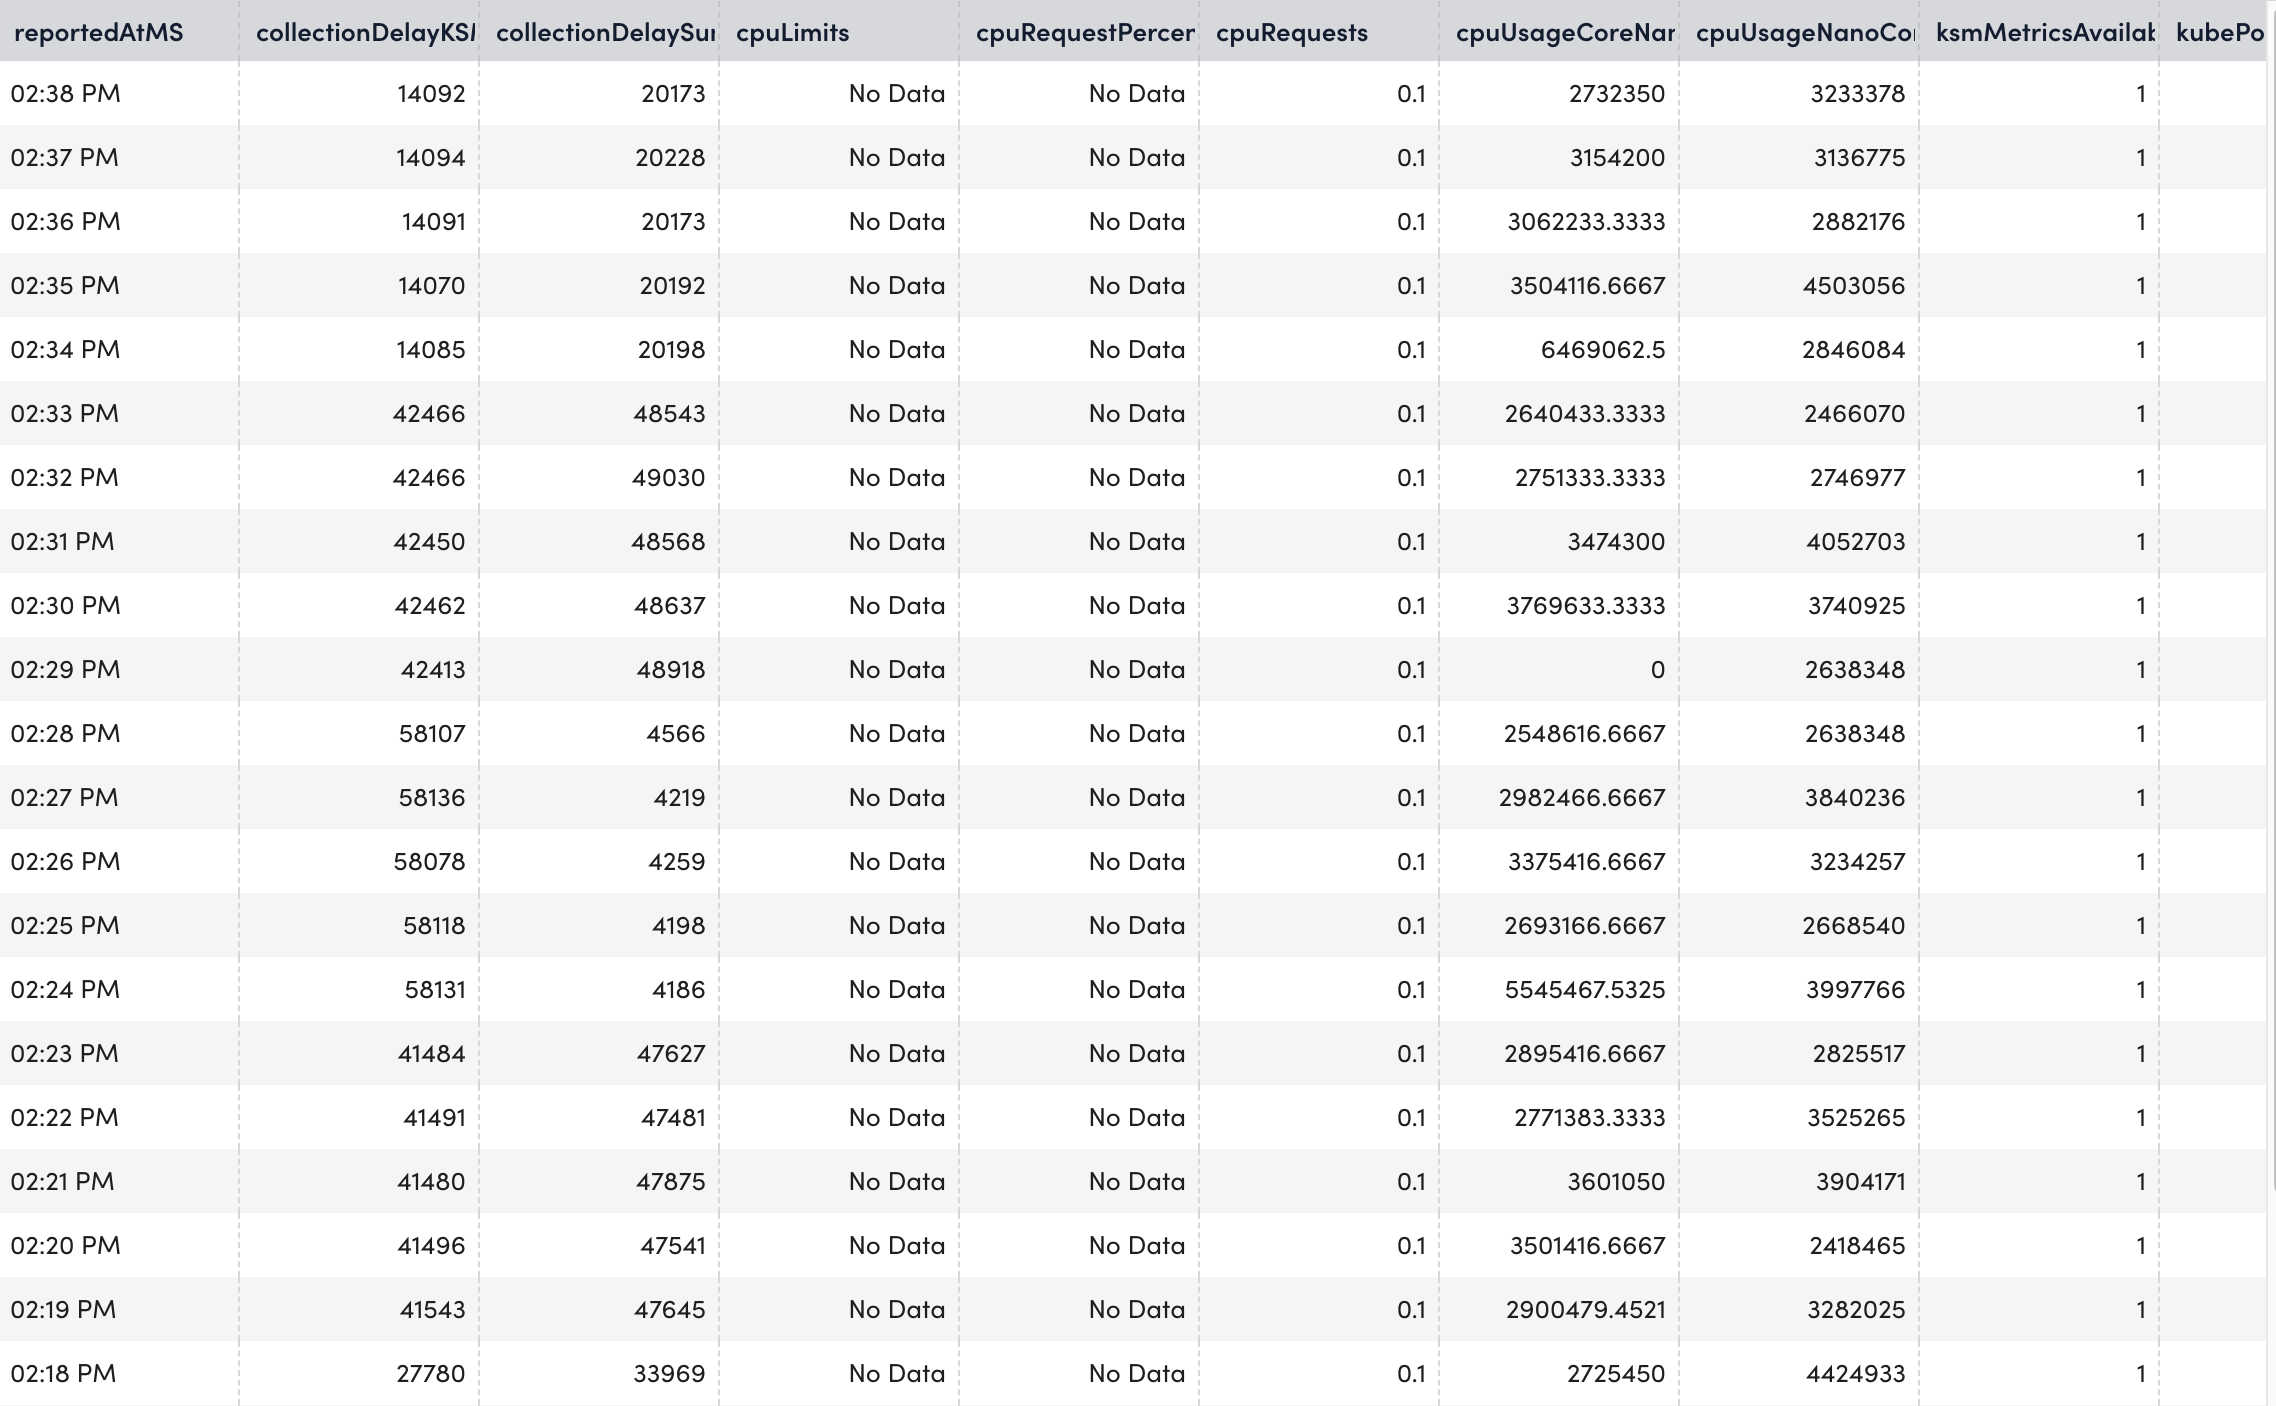
- Select the Raw Data tab to view all the data returned for the defined instances.
Amazon Elastic Kubernetes Service (EKS) is a managed Kubernetes service that helps you run Kubernetes on any standard Kubernetes environment (AWS). Using Amazon EKS, you can run Kubernetes without installing and operating a Kubernetes control plane or worker nodes.
LogicMonitor helps you to monitor your Amazon EKS environments in real-time. For more information, see What is Amazon EKS from Amazon documentation.
LogicMonitor officially supports running LM Container Kubernetes Monitoring on AWS Bottlerocket OS. For more information, see Bottlerocket from AWS documentation.
Requirements for Monitoring EKS Cluster
- Ensure you have a valid and running cluster on Amazon EKS.
- Ensure to run the supported Kubernetes cluster version on Amazon EKS. For more information, see the Support Matrix for Kubernetes Monitoring.
Setting up Amazon EKS Cluster
You don’t need separate installations on your server to monitor the Amazon EKS cluster, since LogicMonitor already integrates with Kubernetes and AWS. For more information on LM Container installation, see Installing the LM Container Helm Chart or Installing LM Container Chart using CLI.
Amazon EKS Cluster Dashboards
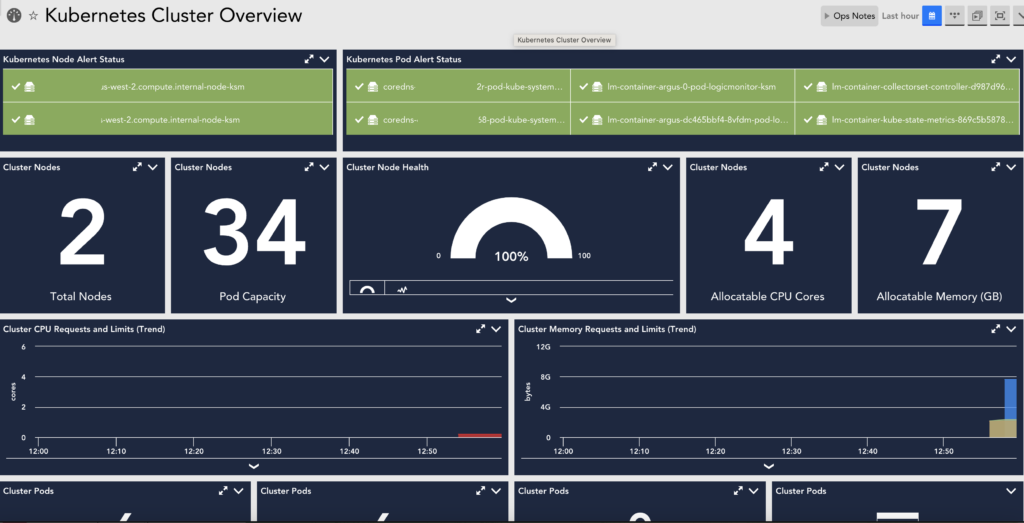
You don’t need to create any separate Amazon EKS cluster dashboards. If you have integrated LogicMonitor with Kubernetes and AWS, the Amazon EKS cluster data will display on the relevant dashboards.
Kubernetes Monitoring Considerations
- LM Container treats each Kubernetes object instance as a device.
- Our Kubernetes integration is Container Runtime Interface (CRI) agnostic. For more information, see Container Runtime Interface from Kubernetes documentation.
- LM Container officially supports the most recent five versions of Kubernetes at any given time and aims to offer support for new versions within 60 days of the official release. For more information, see Support Matrix for Kubernetes Monitoring.
- All Kubernetes Clusters added are displayed on the Resources page. For more information, see Adding Kubernetes Cluster Using LogicMonitor Web Portal.
Kubernetes Monitoring Dependencies
- LM Container Helm Chart — Unified LM Container Helm chart allows you to install all the services necessary to monitor your Kubernetes cluster, including Argus, Collectorset-Controller, and the kube-state-metrics (KSM) service.
- Argus— Uses LogicMonitor’s API to add Nodes, Pods, and Services into monitoring.
- Collectorset-Controller— Manages one or more Dockerized LogicMonitor Collectors for data collection. Once Kubernetes Cluster resources are added to LogicMonitor, data collection starts automatically. Data is collected for Nodes, Pods, Containers, and Services via the Kubernetes API. Additionally, standard containerized applications (e.g. Redis, MySQL, etc.) will be automatically detected and monitored.
- Dockerized Collector— An application used for data collection.
- Kube-state-metrics (KSM) Service— A simple service that listens to the Kubernetes API server and generates metrics about the state of the objects.
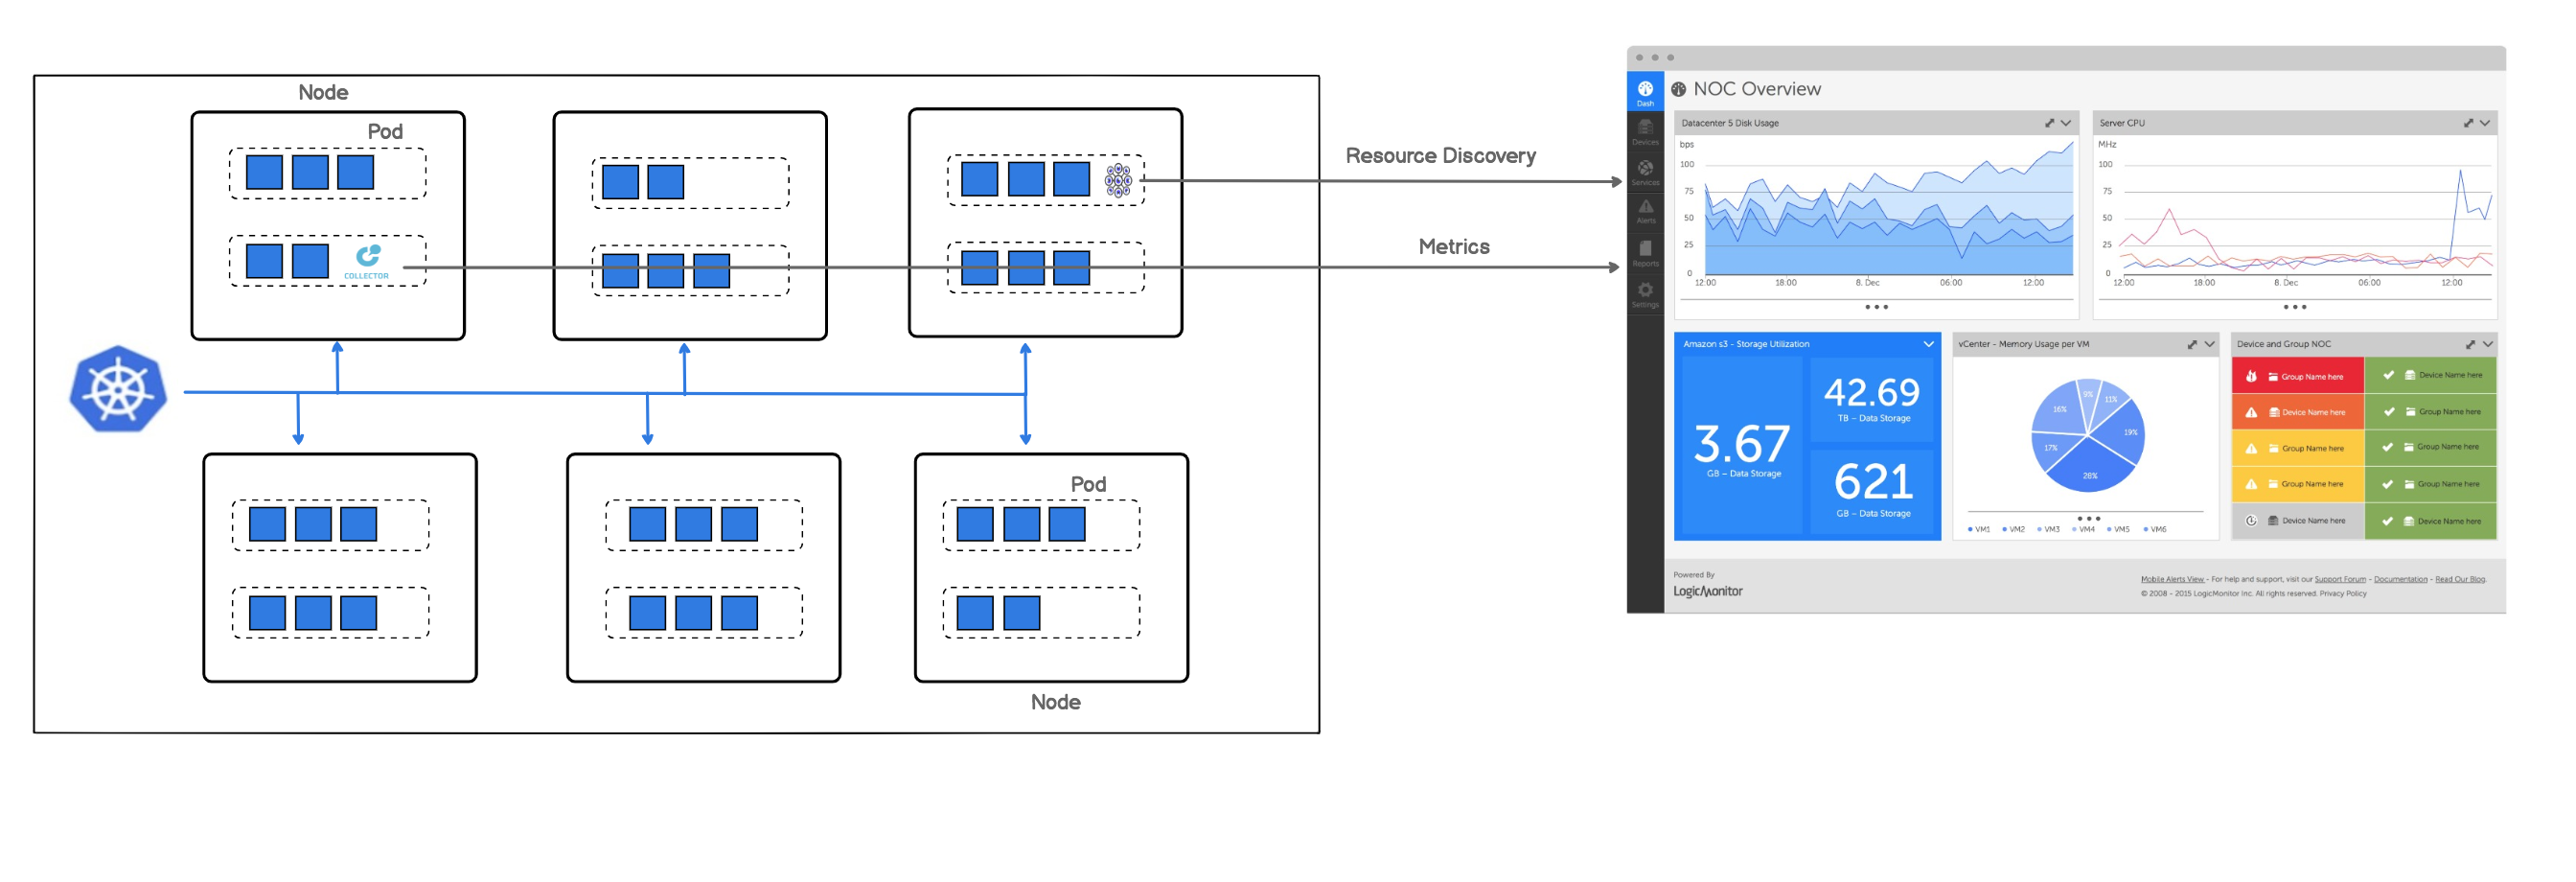
The following image displays how LogicMonitor’s application runs in your cluster as a pod.
Note: LogicMonitor’s Kubernetes monitoring integration is an add-on feature called LM Container. You may contact your Customer Success Manager (CSM) for more information.
LogicMonitor Portal Permissions
- You should have manage permissions of:
- Settings:
- LogicModules
- Minimum one dashboard group.
- Minimum one resource group.
- Minimum one collector group.
Resources are created if the hosts running in your clusters do not already exist in monitoring.
- Settings:
- You should have view permissions for all the collector groups.
- For creating API tokens for authentication purposes, ensure to check the Allow Creation of API Token checkbox under Settings > User Profile. Any user except an out-of-the-box administrator user role can create API tokens. For more information, see API Tokens.
- Best to install the LM Container from LM portal with the Administrator user role. For more information, see Roles.
Kubernetes Cluster Permissions
There are minimum permissions that are required to install the LM Container.
For creating ClusterRole, do the following:
- Create and save a cluster-role.yaml file with the following configuration:
apiVersion: rbac.authorization.k8s.io/v1

kind: ClusterRole

metadata:

  name: lm-container-min-permissions

rules:

- apiGroups:

  - ""

  resources:

  - "*"

  verbs:

  - get

  - list

  - create

- apiGroups:

  - ""

  resources:

  - configmaps

  verbs:

  - "*"

- apiGroups:

  - apps

  resources:

  - deployments

  - statefulsets

  - replicasets

  verbs:

  - get

  - list

  - create

- apiGroups:

  - rbac.authorization.k8s.io

  resources:

  - clusterroles

  - clusterrolebindings

  - roles

  - rolebindings

  verbs:

  - "*"

- apiGroups:

  - apiextensions.k8s.io

  resources:

  - customresourcedefinitions

  verbs:

  - "*"

- apiGroups:

  - "*"

  resources:

  - collectorsets

  verbs:

- "*"- Enter the following command:
kubectl apply -f cluster-role.yaml- Run the following command to create cluster-role-binding to give view-only permissions of all the resources for a specific user.
kubectl create clusterrolebinding role-binding-view-only --clusterrole view --user <user-name>- Run the following command to create cluster-role-binding to give permissions to specific user to install LM container components.
kubectl create clusterrolebinding role-binding-lm-container --clusterrole lm-container-min-permissions --user <user-name>For more information on LM Container installation, see Installing the LM Container Helm Chart or Installing LM Container Chart using CLI.

