LogicMonitor uses the JMX collection method to collect performance and configuration data from Java applications using exposed MBeans (Managed Beans). These MBeans represent manageable resources in the Java Virtual Machine (JVM), including memory, thread pools, and application-specific metrics.
To collect data using the JMX collection method, configure a datapoint that references a specific MBean and one of its attributes. Specify the following:
- MBean ObjectName— A domain and one or more key–value properties.
For example,domain=java.lang, propertiestype=Memory. - Attribute— The attribute to collect from the MBean.
Each MBean exposes one or more attributes that can be queried by name. These attributes return one of the following:
- A primitive Java data type (for example,
int,long,double, orstring) - An array of data (for example, an array of primitives or nested objects)
- A hash of data (for example, key–value pairs, including nested structures or attribute sets)
LogicMonitor supports data collection for all JMX attribute types.
Note:
LogicMonitor does not support JMX queries that include dots (periods) unless they are used to navigate nested structures.For example:
- rep.Container is invalid if it is a flat attribute name.
- MemoryUsage.used is valid if MemoryUsage is a composite object and used in a field inside it.
When configuring the JMX datapoint, LogicMonitor uses this information to identify and retrieve the correct value during each collection cycle.
For more technical details on MBeans and the JMX architecture, see Oracle’s JMX documentation.
Simple Attribute Example
If the attribute is a top-level primitive:
- MBean ObjectName:
java.lang:type=Threading - MBean Attribute:
ThreadCount
LogicMonitor collects the total number of threads in the JVM.
Nested Attribute Example
If the attribute is part of a composite or nested object, use the dot/period separator as follows:
- MBean ObjectName:
java.lang:type=Memory - MBean Attribute:
HeapMemoryUsage.used
LogicMonitor collects the amount of heap memory used.
Multi Level Selector Example
To collect data from a map or nested structure with indexed values:
- MBean ObjectName:
LogicMonitor:type=rrdfs - MBean Attribute:
QueueMetrics.move.key1
LogicMonitor retrieves the value associated with the key key1 from the map identified by index move under the QueueMetrics attribute of the MBean.
CompositeData and Map Support
Some JMX MBean attributes return structured data such as:
- CompositeData: A group of named values, like a mini object or dictionary.
- Map: A collection of key-value pairs.
LogicMonitor supports collecting values from both.
Accessing CompositeData Example
A CompositeData attribute is like a box of related values, where each value has a name (field). To collect a specific field from the structure, use a dot (.) separator.
MBean: java.lang:type=GarbageCollector,name=Copy
Attribute: LastGcInfo
Value Type: CompositeData
To access the specific value for the number of GC threads use: LastGcInfo.GcThreadCount
Note: Maps in JMX behave similarly to CompositeData, but instead of fixed fields, values are retrieved using a key.
TabularData Support
Some MBean attributes return data in the form of TabularData, a structure similar to a table, with rows and columns. LogicMonitor can extract specific values from these tables.
A TabularData object typically consists of:
- Index columns: Used to uniquely identify each row (like primary keys in a database)
- Value columns: Contain the actual data you want to collect
You can access a value by specifying:
- The row index (based on key columns)
- The column name for the value you want
Single Index TabluarData Example
The MBean java.lang:type=GarbageCollector,name=Copy has an attribute LastGcInfo. One of its child values, memoryUsageAfterGc, is a TabularData. 
The table has 2 columns – key and value. The column key is used to index the table so you can uniquely locate a row by specifying an index value.
For example, key=”Code Cache” returns the 1st row.
To retrieve the value from the value column of the row indexed by the key "Eden Space", use the expression: LastGcInfo.memoryUsageAfterGc.Eden Space.value
In this expression, "Eden Space" is the key used to identify the specific row, and value is the column from which the data will be collected.
Multi-Index TabularData Example
Some tables use multiple index columns to identify rows.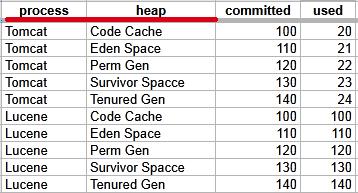
This TabularData structure has four columns, with process and heap serving as index columns. A unique row is identified by the combination of these index values.
To retrieve the value from the committed column in the row where process=Tomcat and heap=Perm Gen, use the expression: LastGcInfo.memoryUsageAfterGc.Tomcat,Perm Gen.committed
Here, Tomcat,Perm Gen specifies the row, and committed is the column containing the desired value.
Array or List Support
Some MBean attributes return arrays or lists of values. LogicMonitor supports collecting data from these array or list values using index-based access.
For example, the MBean: java.lang:type=GarbageCollector,name=Copy has an Attribute: MemoryPoolNames with Type: String[] 
To access/collect the first element of this array, the expression “MemoryPoolNames.0“ can be used, where “0” is the index to the array (0-based).
You can access the array elements by changing the index as follows:
MemoryPoolNames.0 = "Eden Space"MemoryPoolNames.1="Survivor Space"
The same rule applies if the attribute is a Java List. Use the same dot and index notation.
To enable JMX collection for array or list attributes:
- Make sure your Java application exposes JMX metrics.
- Confirm that the username and password for JMX access are correctly set as device properties:
jmx.userjmx.pass
These credentials allow the Collector to connect to the JMX endpoint and retrieve the attribute data, including elements in arrays or lists.
Configuring a Datapoint using the JMX Collection Method
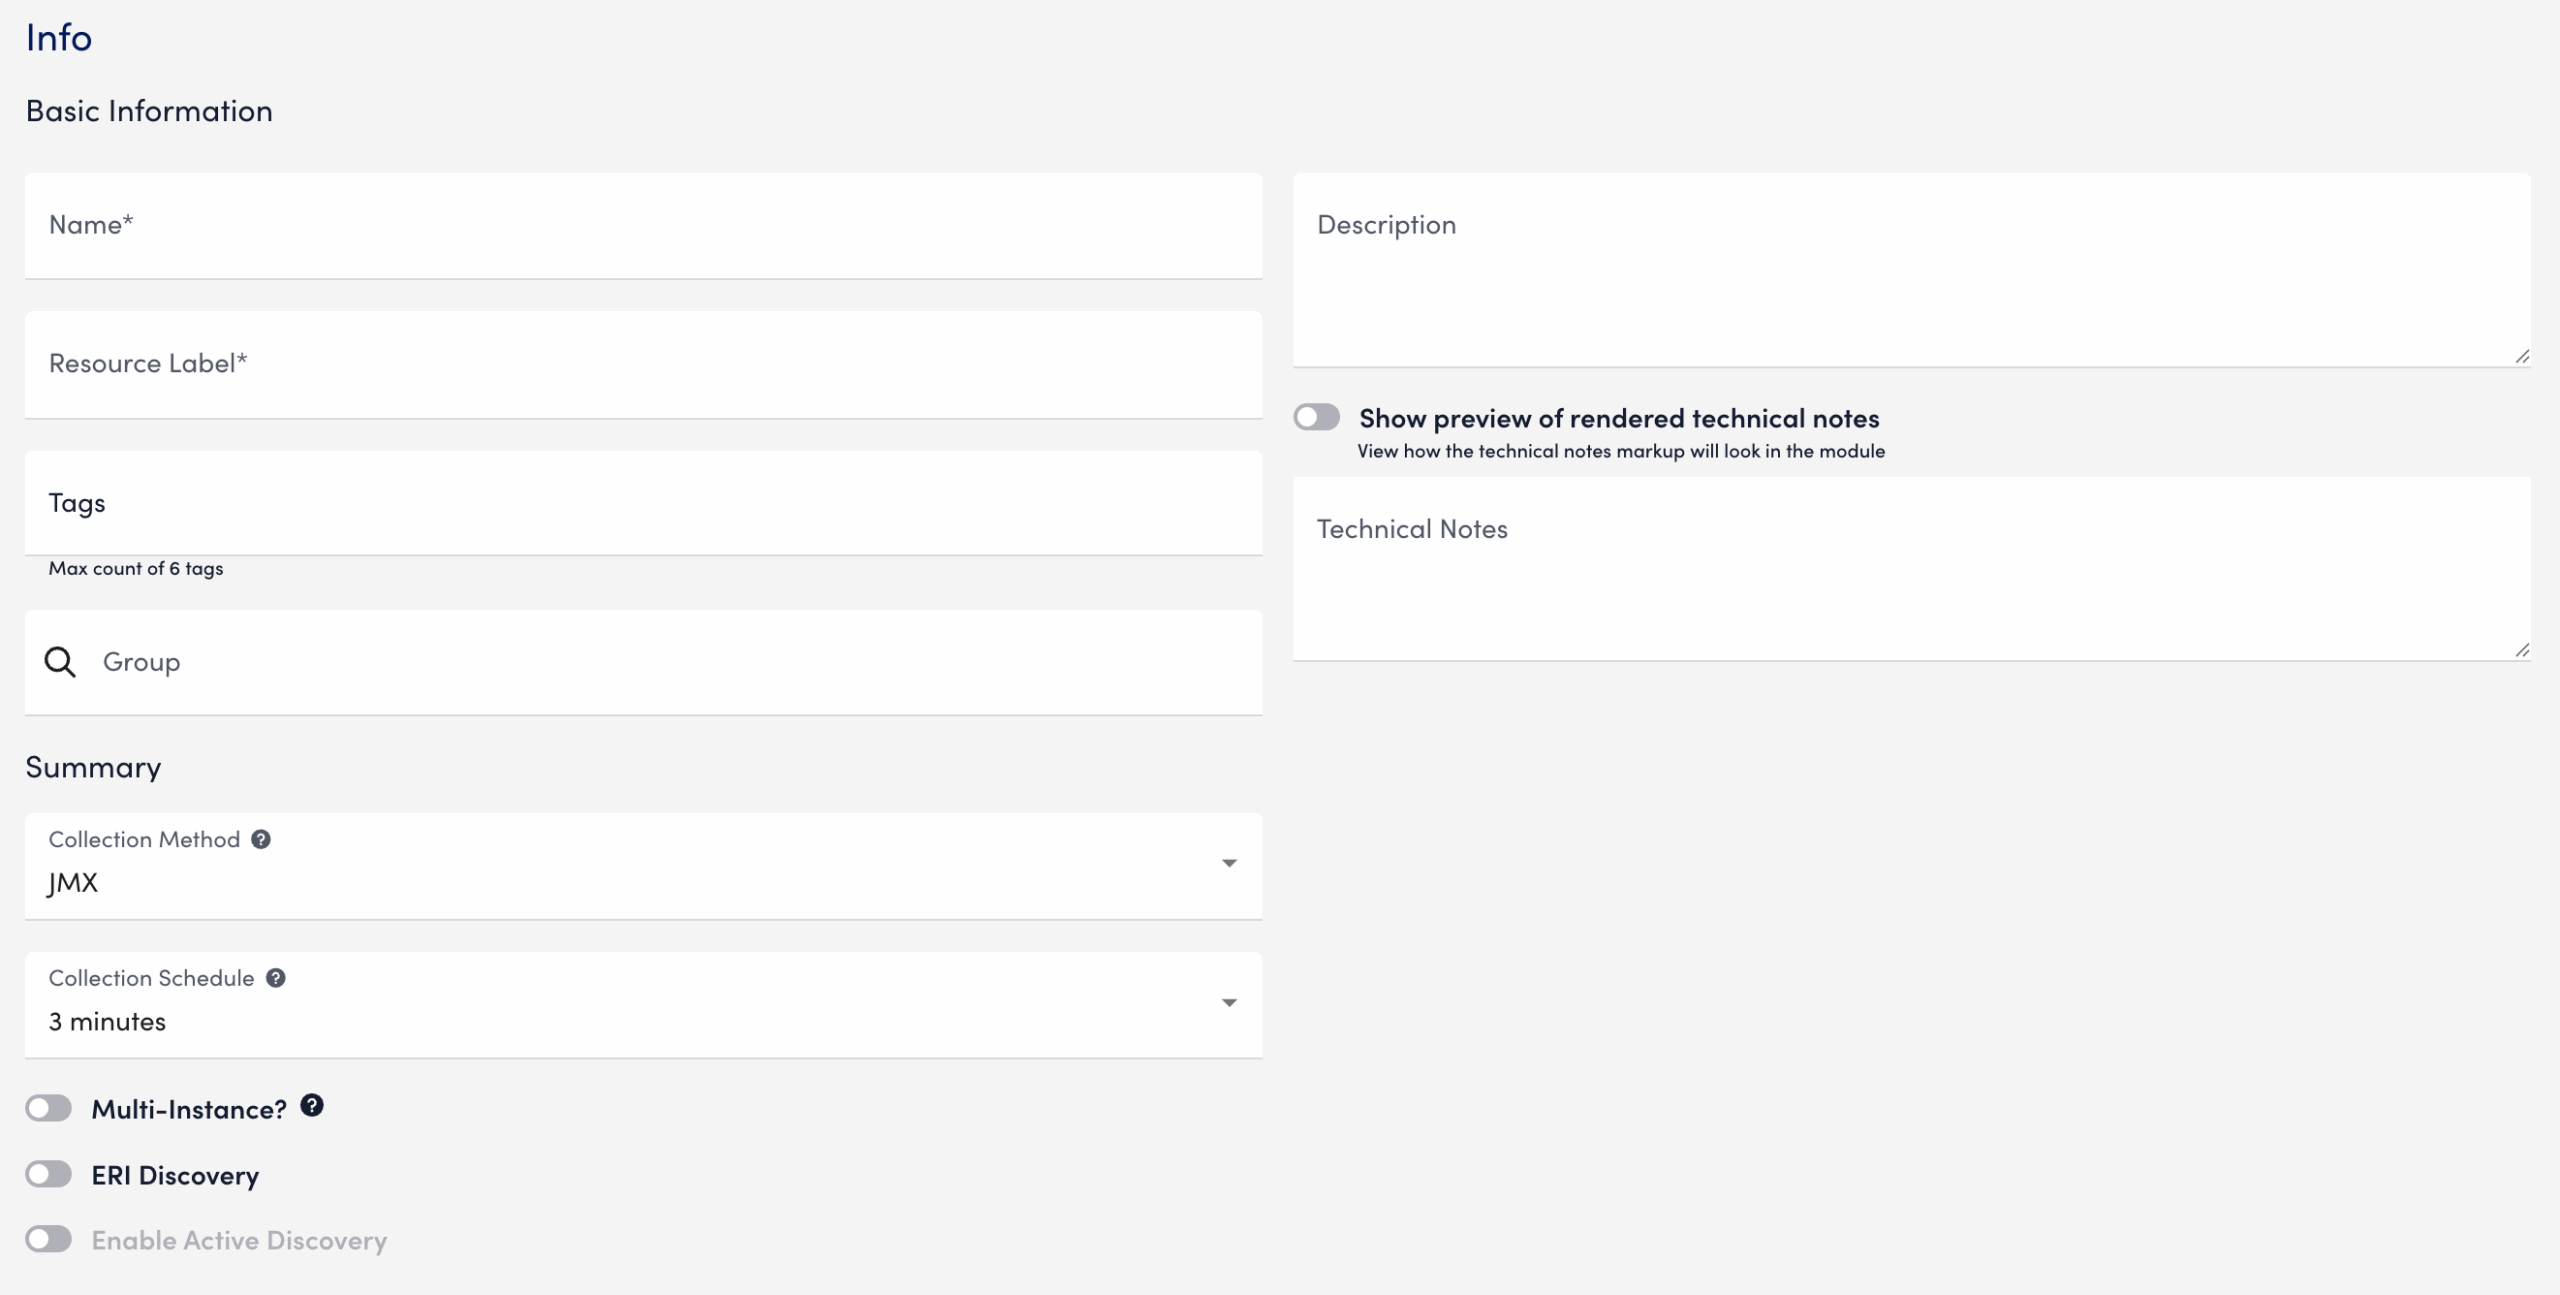
- In LogicMonitor, navigate to Modules. Add a new DataSource or open an existing module to add a datapoint for JMX collection.
For more information, see Custom Module Creation or Modules Management in the product documentation. - In the Collection Method field, select “JMX”.
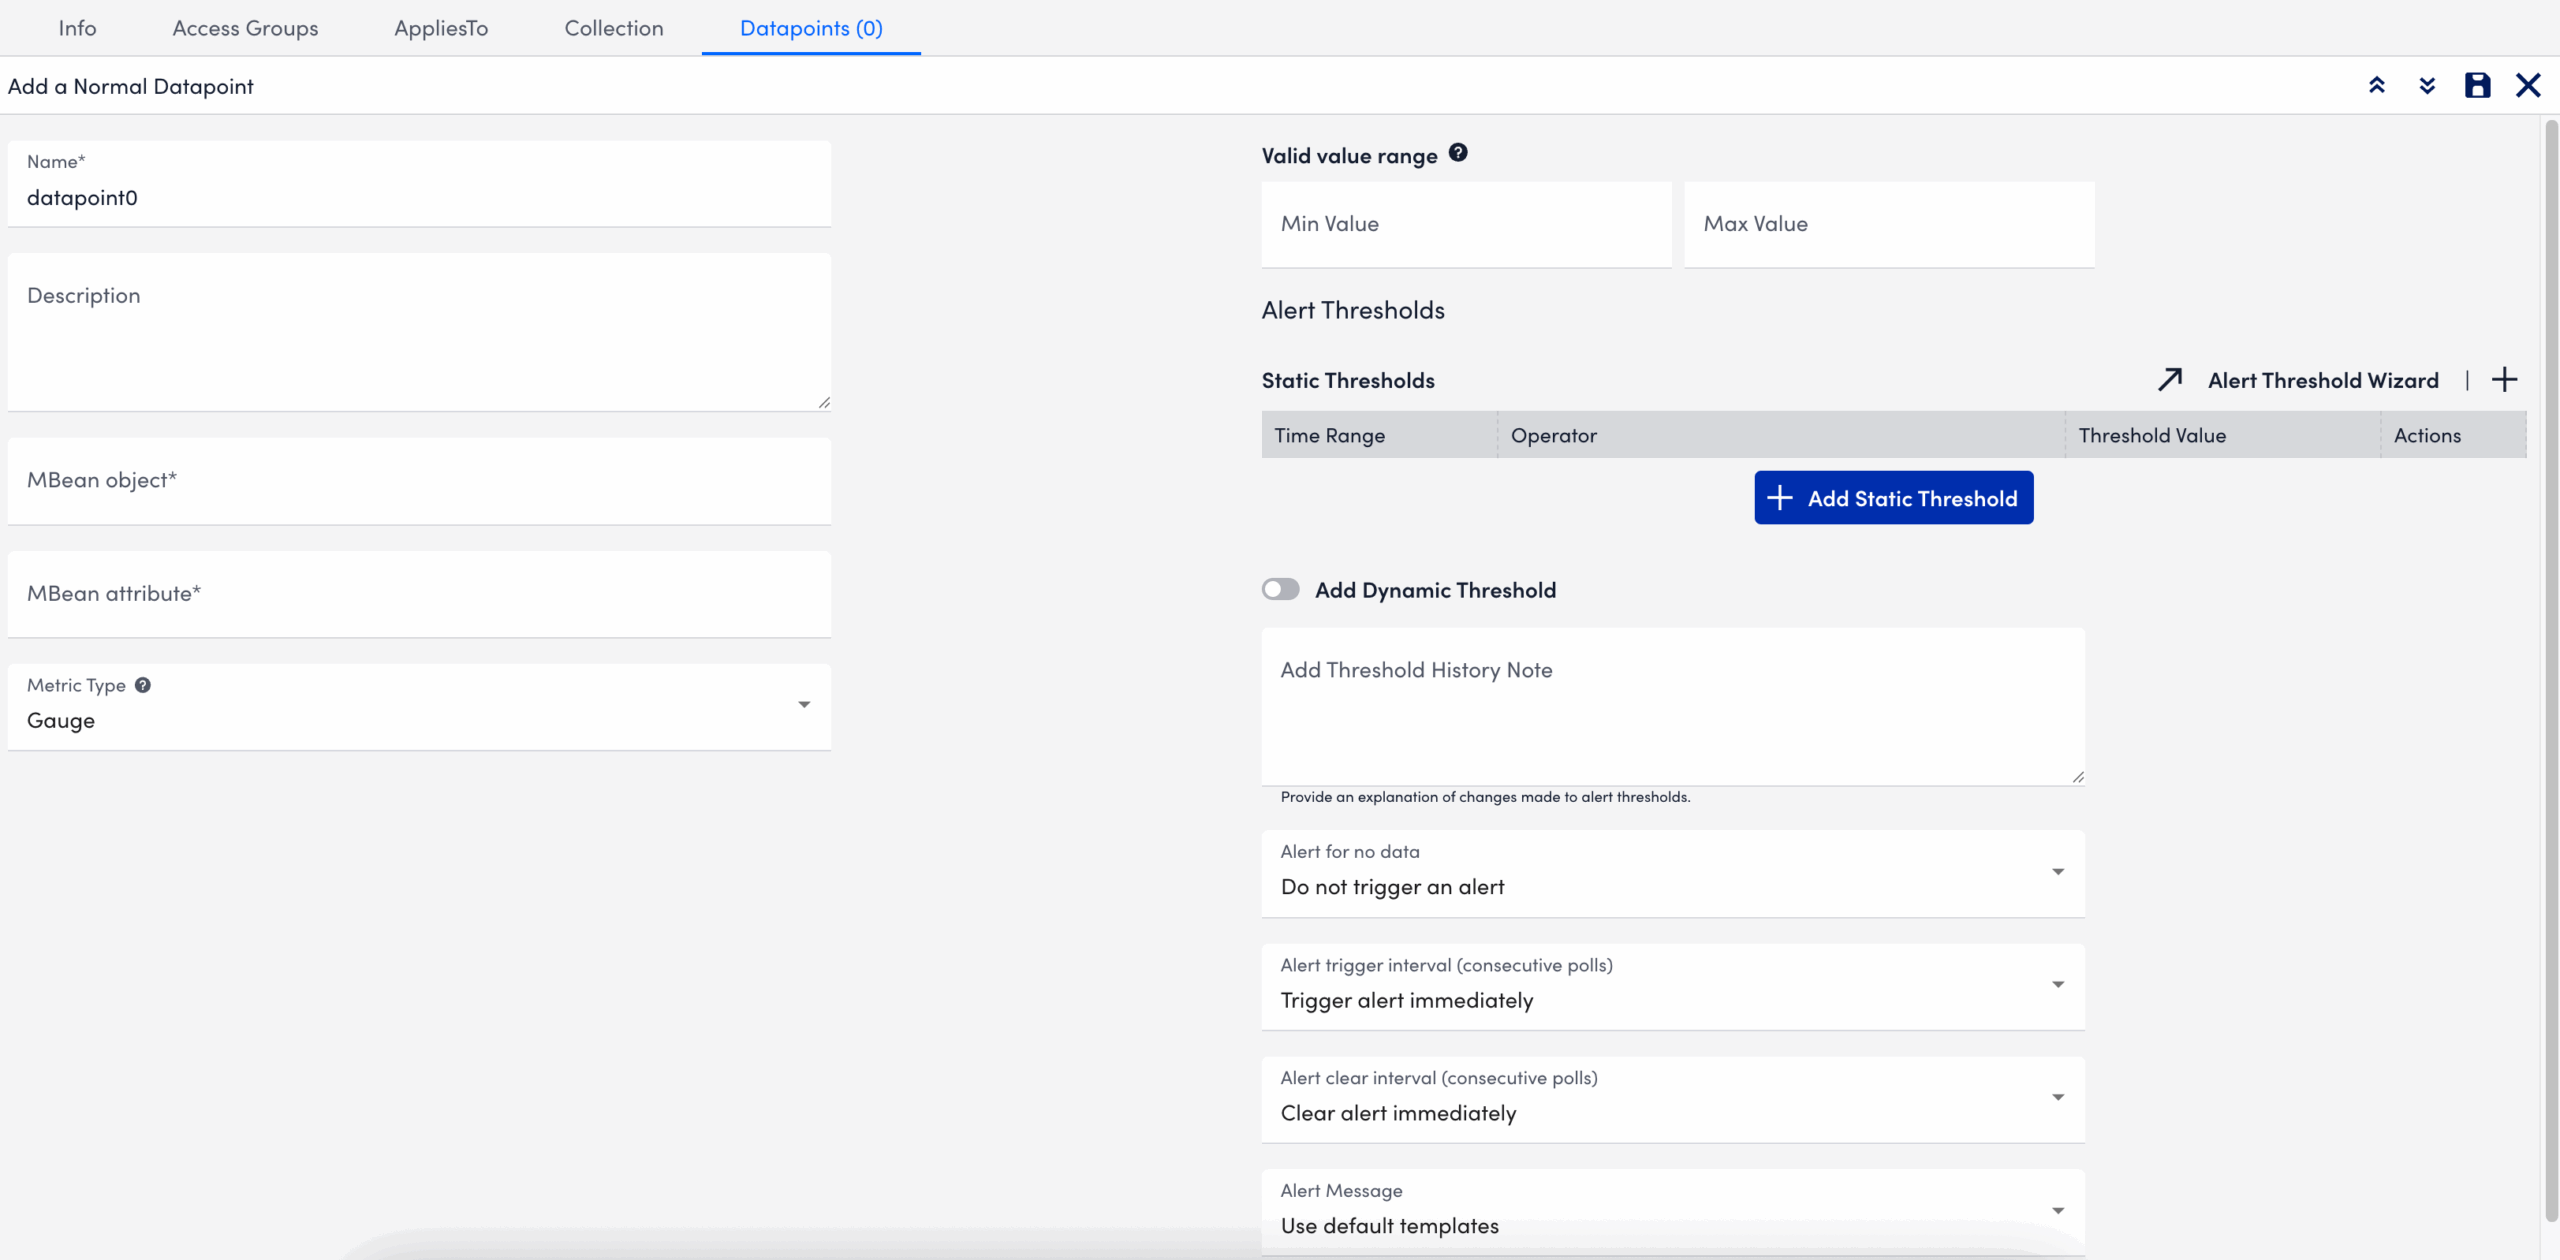
- Select Add a Normal Datapoint.
- In the Name field, enter a name for the datapoint.
- In the Description field, enter a description.
- In the MBean object field, enter the MBean path, including the domain and properties.
- In the MBean attribute field, enter the specific attribute or nested field to collect.
- In the Metric Type field, select the metric type for the response.
- Configure any additional settings, if applicable.
- Select
 Save.
Save.
The datapoint is saved for the module and you can configure additional settings for the module as needed. For more information, see Custom Module Creation or Modules Management.
Troubleshooting JMX Data Collection
Collector does not support the first-level JMX attributes that contain dots(.). By default, the Collector treats dots as path separators to access nested data. If the dot is simply a part of the attribute’s name and not intended to indicate a hierarchy, it can cause:
- ANullPointerException in the JMX debug window,
- NaN (Not a Number) values in the Poll Now results, and
- Failure to collect data correctly
Mitigating JMX Data Collection Issues
To prevent data collection errors with attributes that include dots, do the following:
- Identify the attribute name in your MBean that contains dots.
For example (attribute name):jira-software.max.user.count - Determine whether the dots are part of the attribute name or indicate a nested path.
- If the dots are part of the attribute name, escape each dot with a backslash (
\.).
For example:jira-software\.max\.user\.count - If the dots indicate navigation inside a structure, do not escape them.
- If the dots are part of the attribute name, escape each dot with a backslash (
- Enter the attribute in the LogicModule or JMX Debug window, using the escaped form only when the dots are part of the attribute name.
- Verify the data collection using the Poll Now feature or JMX debug window.
Attribute Interpretation Examples
| Attribute Format | Interpreted in Collector Code as |
jira-software.max.user.count | jira-software, max, user, count (incorrect if flat attribute) |
jira-software\.max\.user\.count | jira-software.max.user.count (correct interpretation) |
jira-software\.max.user\.count | jira-software.max, user.count |
jira-software.max.user\.count | jira-software, max, user.count |
Introduction
A datapoint is a piece of data that is collected during monitoring. Every DataSource definition must have at least one configured datapoint that defines what information is to be collected and stored, as well as how to collect, process, and potentially alert on that data.
Normal Datapoints vs. Complex Datapoints
LogicMonitor defines two types of datapoints: normal datapoints and complex datapoints. Normal datapoints represent data you’d like to monitor that can be extracted directly from the raw output collected.
Complex datapoints, on the other hand, represent data that needs to be processed in some way using data not available in the raw output (e.g. using scripts or expressions) before being stored.
For more information on these two types of datapoints, see Normal Datapoints and Complex Datapoints respectively.
Configuring Datapoints
Datapoints are configured as part of the DataSource definition. LogicMonitor does much of the work for you by creating meaningful datapoints for all of its out-of-the-box DataSources. This means that, for the majority of resources you monitor via LogicMonitor, you’ll never need to configure datapoints.
However, there may be occasions where you want to customize an existing DataSource with new or edited datapoints (or are creating a custom DataSource). For these occasions, LogicMonitor does support the creation/editing of datapoints. This is done from the Datapoints area of a DataSource definition (navigate to Settings|DataSources|[DataSource Name]).
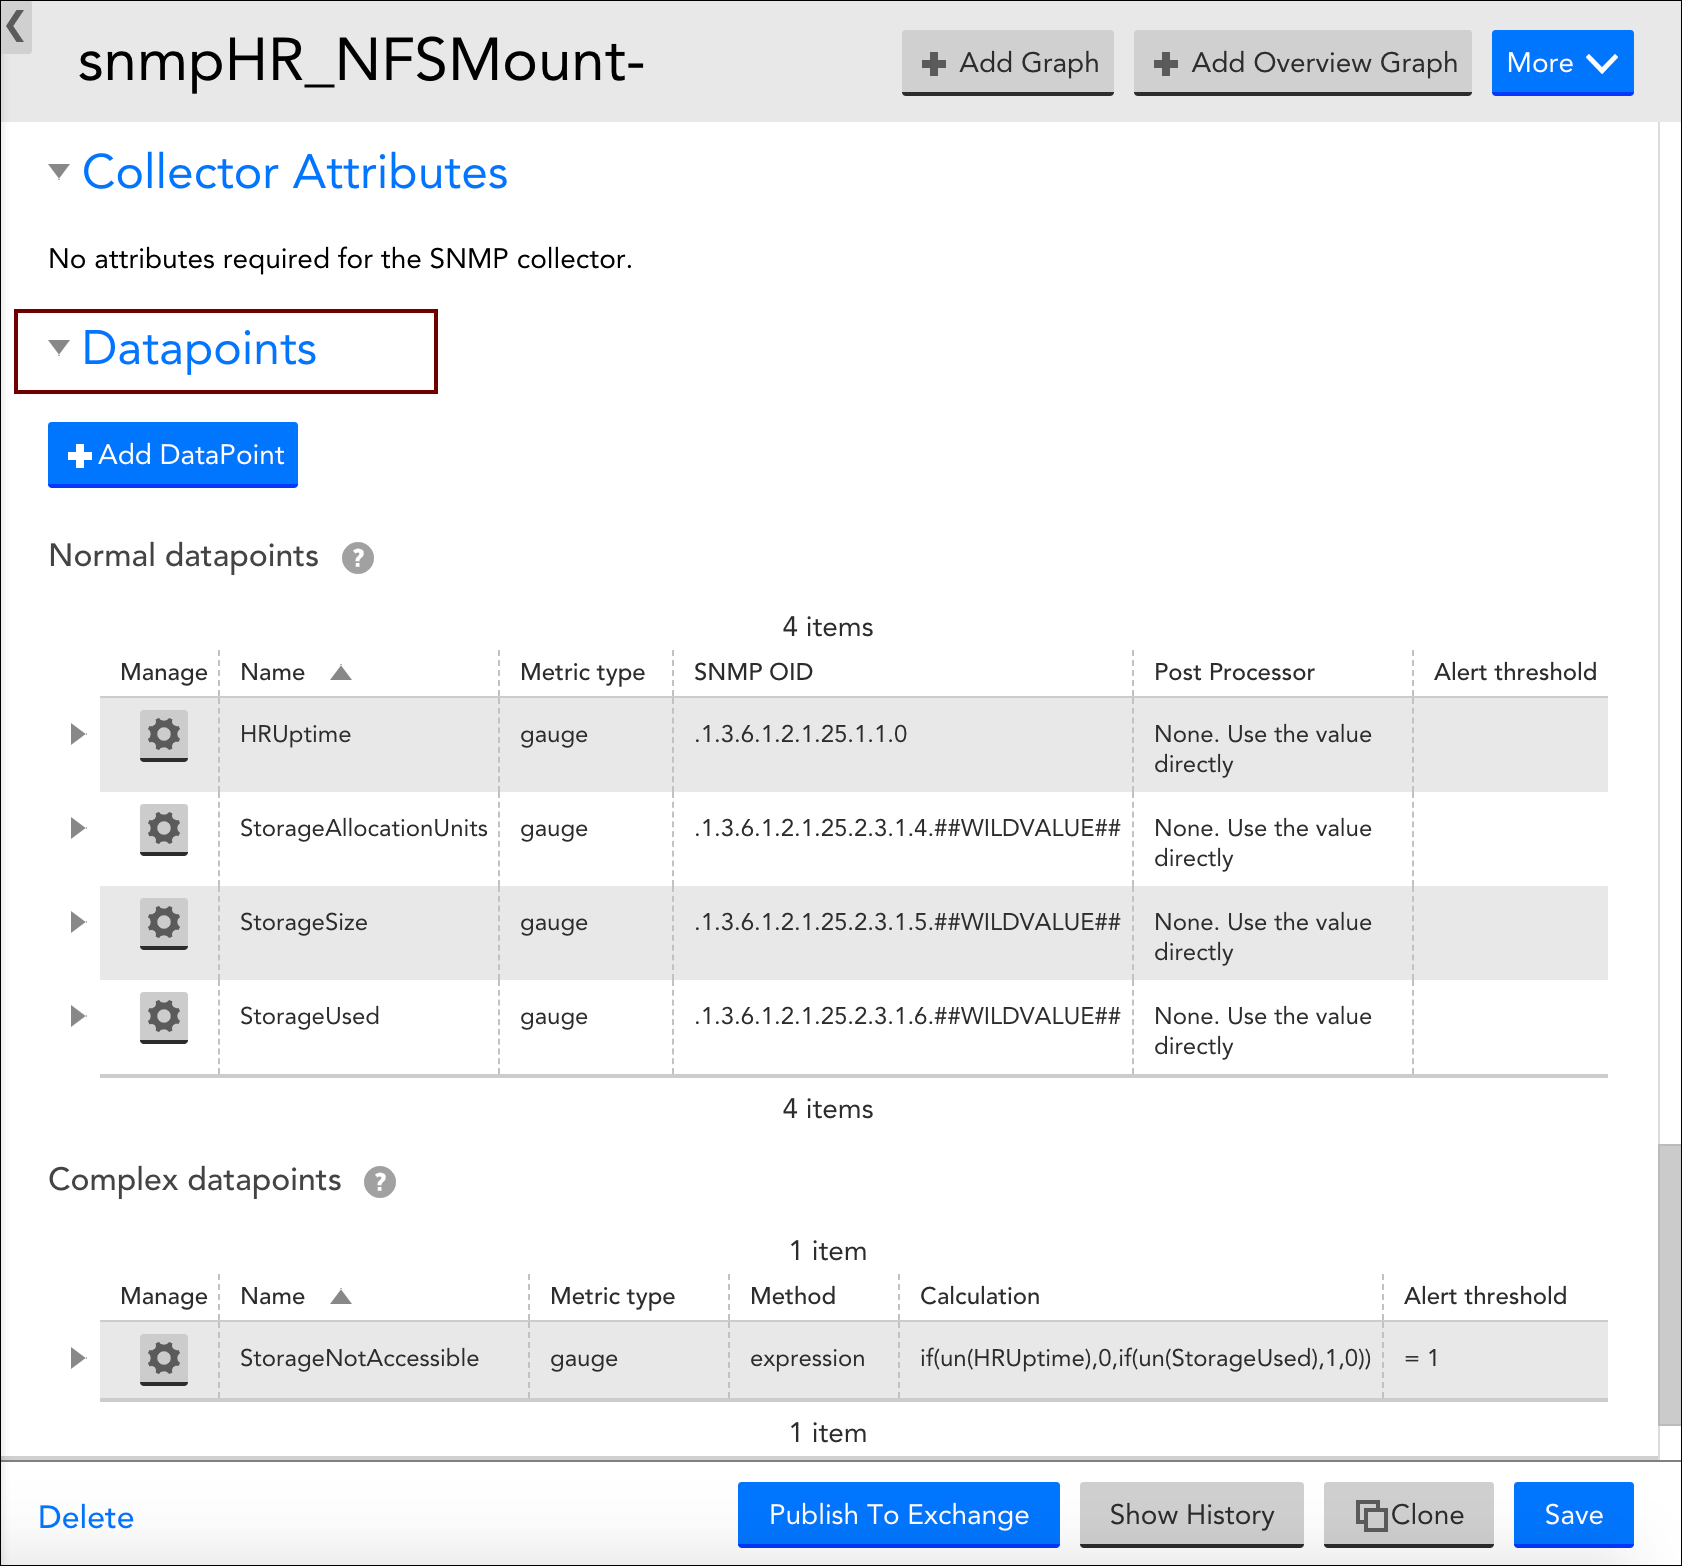
When adding a new datapoint or editing an existing datapoint, there are several settings that must be configured. The following three sections categorize these settings according to the type of datapoint being created.
Configurations Common to Normal and Complex Datapoints
Datapoint Type
If you are creating a brand new datapoint, choose whether it is a Normal datapoint or Complex datapoint. These options are only available when creating a new datapoint; existing datapoints cannot have their basic type changed. For more information on the differences between normal and complex datapoints, see the Normal Datapoints vs. Complex Datapoints section of this support article.
Name and Description
Enter the name and description of the datapoint in the Name and Description fields respectively. The name entered here will be displayed in the text of any alert notifications delivered for this datapoint so it is best practice to make the name meaningful (e.g. aborted_clients is meaningful whereas datapoint1 is not as it would not be helpful to receive an alert stating “datapoint1 is over 10 per second”.
Note: To ensure successful DataSource creation and updates for aggregate tracked queries, do not use reserved keywords as metric names.
A metric name (referred to as a datapoint name) is the identifier for a metric extracted from your log query, such as “events”, “anomalies”, or “avg_latency_ms”. Each metric from your logs becomes a datapoint within the created DataSource.
The following reserved keywords must not be used as datapoint names:
SIN, COS, LOG, EXP, FLOOR, CEIL, ROUND, POW, ABS, SQRT, RANDOM
LT, LE, GT, GE, EQ, NE, IF, MIN, MAX, LIMIT, DUP, EXC, POP
UN, UNKN, NOW, TIME, PI, E, AND, OR, XOR, INF, NEGINF, STEP
YEAR, MONTH, DATE, HOUR, MINUTE, SECOND, WEEK, SIGN, RND, SUM2
AVG2, PERCENT, RAWPERCENTILE, IN, NANTOZERO, MIN2, MAX2
Also, Tracked query names should follow the same guidelines as datasource display names. For more information, see Datasource Style Guidelines.
Note: Datapoint names cannot include any of the operators or comparison functions used in datapoint expressions, as listed in Complex Datapoints.
Valid Value Range
If defined, any data reported for this datapoint must fall within the minimum and maximum values entered for the Valid value range field. If data does not fall within the valid value range, it is rejected and “No Data” will be stored in place of the data. As discussed in the Alerting on Datapoints section of this support article, you can set alerts for this No Data condition.
The valid value range functions as a data normalization field to filter outliers and incorrect datapoint calculations. As discussed in Normal Datapoints, it is especially helpful when dealing with datapoints that have been assigned a metric type of counter.
Alert Settings
Once datapoints are identified, they can be used to trigger alerts. These alert settings are common across all types of datapoints and are discussed in detail in the Alerting on Datapoints section of this support article.
Configurations Exclusive to Normal Datapoints
The configurations you need to complete for normal datapoints are highly dependent on the type of collection method being used by the DataSource (as determined by the Collector field, see Creating a DataSource).
For example, the Metric Type and Interpret output with fields are available when using the SNMP and WMI data collection methods, but not when evaluating returned status codes using the script or webpage method. For more information on these fields, see Normal Datapoints.
In addition, there is a field (or set of options) that specify what raw output should be collected, but the wording for these fields/options dynamically changes, also dependent upon the collection method being used. For example, this field is titled WMI CLASS attribute when defining datapoints collected via WMI and OID when defining datapoints collected via SNMP. Similarly, if defining datapoints collected via JMX, the fields MBean object and MBean attribute display. And to provide one more example, if defining datapoints collected via script or batchscript, a listing of script source data options displays. For more information on configuring this dynamic raw output field, see the individual support articles available in our Data Collection Methods topic.
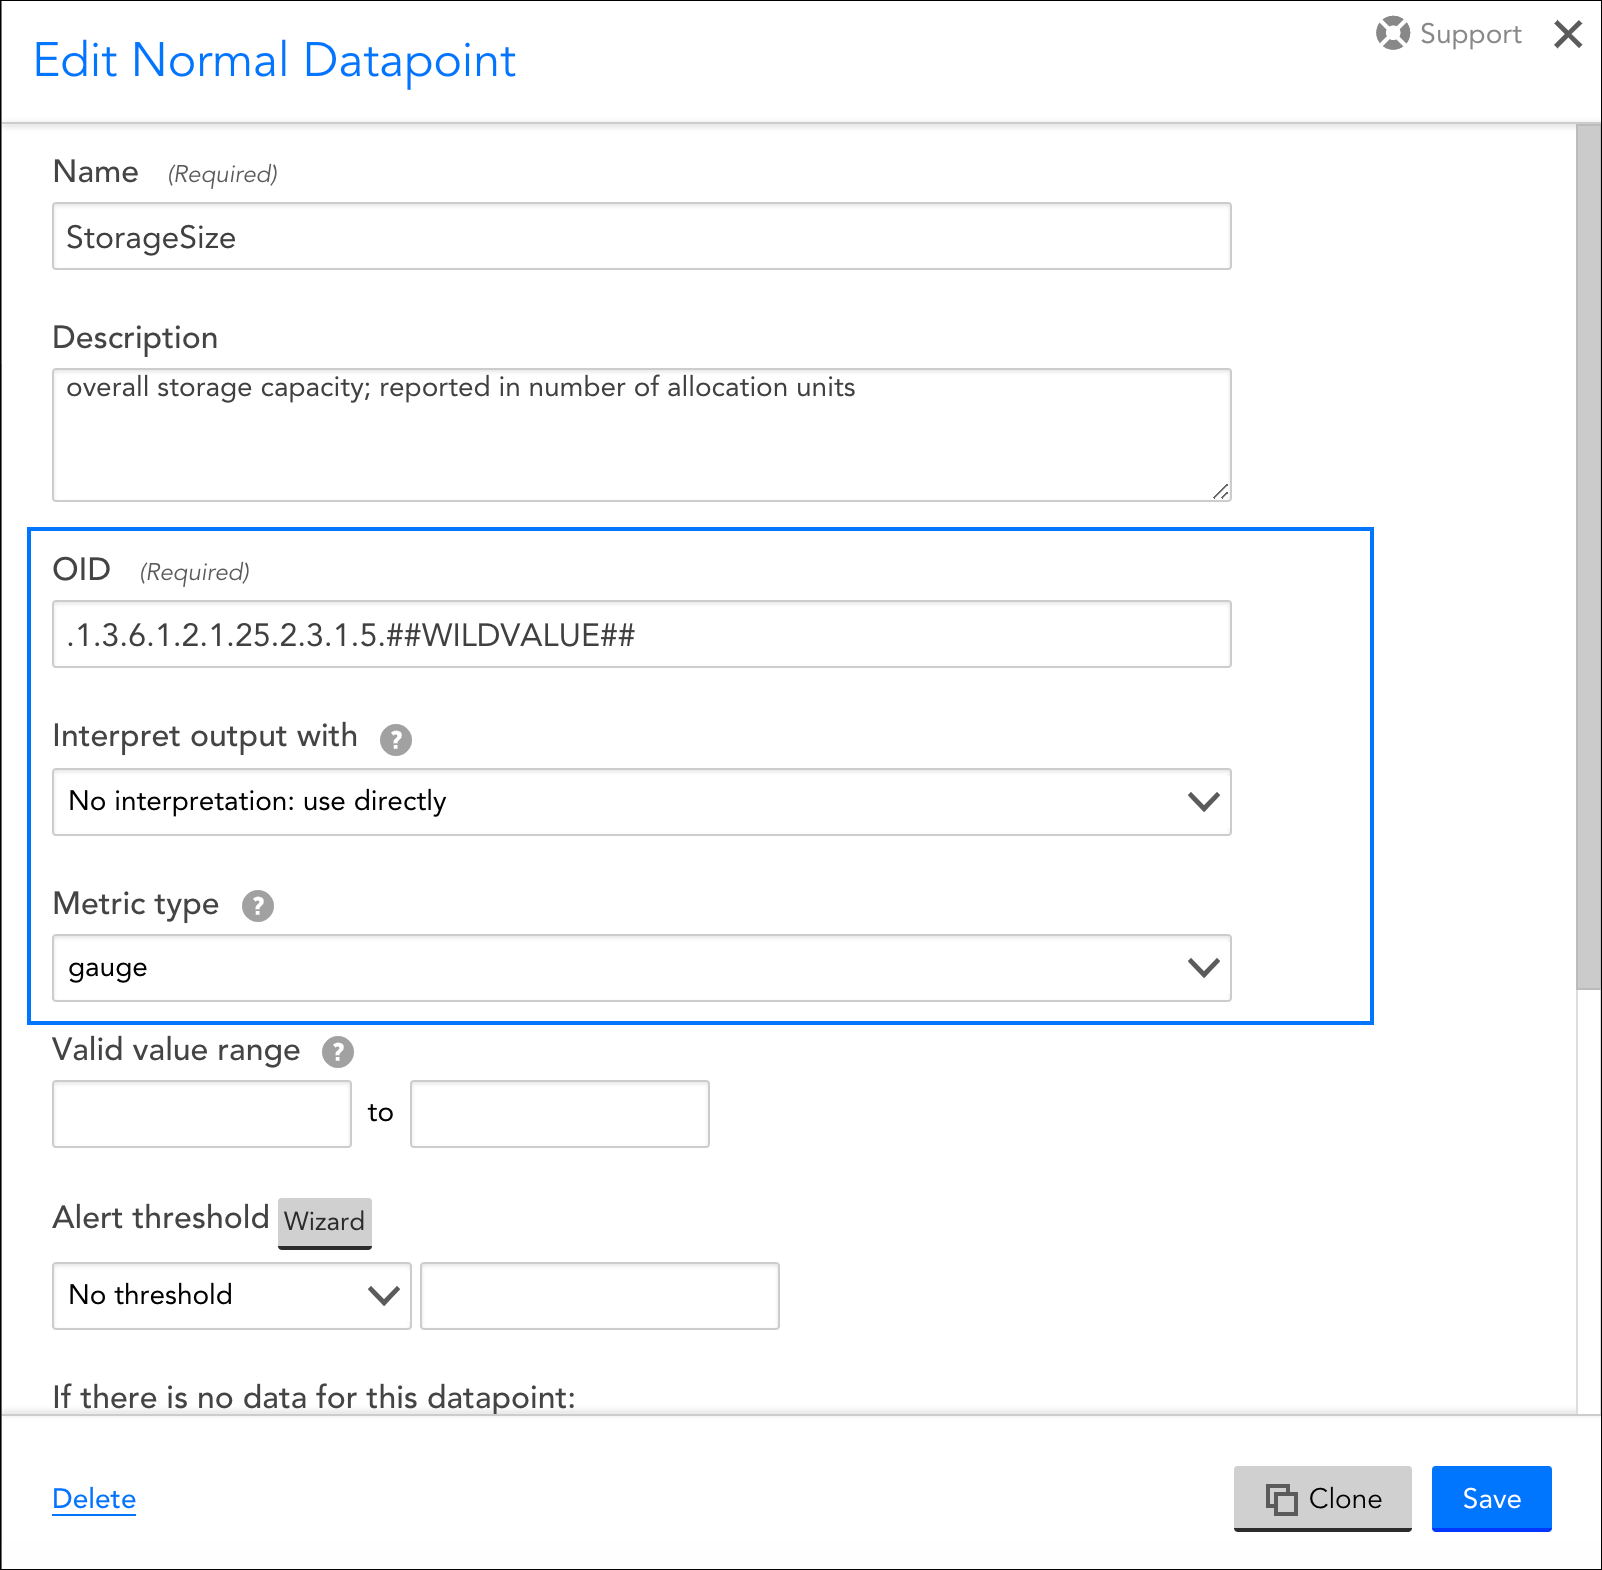
These datapoint configurations display for DataSources that use an SNMP collection method, but for other types of collection methods (e.g. WMI, script, JMX, etc.), a different set of configurations displays.
Configurations Exclusive to Complex Datapoints
Method
If you are constructing your complex datapoint as an expression that is based on existing normal datapoints or resource properties (called a standard complex datapoint), select “Use an expression (infix or rpn) to calculate the value” from the Method field’s dropdown menu.
If you need to process the raw collected data in a more sophisticated way that cannot be achieved by manipulating the normal datapoints or assigned resource properties, select “Use groovy script to calculate the value” from the Method field’s dropdown menu. This is called a Groovy complex datapoint.
For more information on these two methods for building complex datapoints, along with sample expressions and Groovy scripts, see Complex Datapoints.
Expression/Groovy Source Code
If the “Use an expression (infix or rpn) to calculate the value” option was chosen from the Method field’s dropdown menu, enter the expression for your standard complex datapoint in the Expression field.
If the “Use groovy script to calculate the value” option was chosen, enter the Groovy script that will be used to process the datapoint in the Groovy Source Code field.
For more information on building complex datapoints using expressions and Groovy scripts, see Complex Datapoints.
Alerting on Datapoints
Once datapoints are configured, they can be used to trigger alerts when data collected exceeds the threshold(s) you’ve specified, or when there is an absence of expected data. When creating or editing a datapoint from the Add/Edit Datapoint dialog, which is available for display from the Datapoints area of the DataSource definition, you can configure several alert settings per datapoint, including the value(s) that signify alert conditions, alert trigger and clear intervals, and the message text that should be used when alert notifications are routed for the datapoint.
Thresholds
Datapoint alerts are based on thresholds. When the value returned by a datapoint exceeds a configured threshold, an alert is triggered. There are two types of thresholds that can be set for datapoints: static thresholds and dynamic thresholds. These two types of thresholds can be used independently of one another or in conjunction with one another.
Static Thresholds
A static threshold is a manually assigned expression or value that, when exceeded in some way, triggers an alert. To configure one or more static thresholds for a datapoint, click the Wizard button located to the right of the Alert Threshold field. For detailed information on this wizard and the configurations it supports, see Tuning Static Thresholds for Datapoints.
Note: When setting static thresholds from the DataSource definition, you are setting them globally for all resources in your network infrastructure (i.e. every single instance to which the DataSource could possibly be applied). As discussed in Tuning Static Thresholds for Datapoints, it is possible to override these global thresholds on a per-resource or -instance level.
Dynamic Thresholds
Dynamic thresholds represent the bounds of an expected data range for a particular datapoint. Unlike static datapoint thresholds which are assigned manually, dynamic thresholds are calculated by anomaly detection algorithms and continuously trained by a datapoint’s recent historical values.
When dynamic thresholds are enabled for a datapoint, alerts are dynamically generated when these thresholds are exceeded. In other words, alerts are generated when anomalous values are detected.
To configure one or more dynamic thresholds for a datapoint, toggle the Dynamic Thresholds slider to the right. For detailed information on configuring dynamic threshold settings, see Enabling Dynamic Thresholds for Datapoints.
Note: When setting dynamic thresholds from the DataSource definition, you are setting them globally for all resources in your network infrastructure (i.e. every single instance to which the DataSource could possibly be applied). As discussed in Enabling Dynamic Thresholds for Datapoints, it is possible to override these global thresholds on a per-resource or -instance level.
No Data Alerting
By default, alerts will not be triggered if no data can be collected for a datapoint (or if a datapoint value falls outside of the range set in the Value Valid Range field). However, if you would like to receive alerts when no data is collected, called No Data alerts, you can override this default. To do so, select the severity of alert that should be triggered from the If there is no data for this datapoint field’s drop-down menu.
While it’s possible to configure No Data alerts for datapoints that have thresholds assigned (static or dynamic), it is not necessarily best practice. For example, it’s likely you will want different alert messages for these scenarios, as well as different trigger and clear intervals. For these reasons, consider setting the No Data alert on a datapoint that has no thresholds in place so that you can customize the alert’s message, as well as its trigger and clear intervals as appropriate for a no data condition.
In most cases, you can choose to set a No Data alert on any datapoint on the DataSource as it is usually not just one specific datapoint that will reflect a no data condition. Rather, all datapoints will reflect this condition as it is typically the result of the entire protocol (e.g. WMI, SNMP, JDBC, etc.) not responding.
Alert Trigger Interval
The Alert trigger interval (consecutive polls) field defines the number of consecutive collection intervals for which an alert condition must exist before an alert is triggered. The length of one collection interval is determined by the DataSource’s Collect every field, as discussed in Creating a DataSource.
The field’s default value of “Trigger alert immediately” will trigger an alert as soon as the datapoint value (or lack of value if No Data alerting is enabled) satisfies an alert condition.
Setting the alert trigger interval to a higher value helps ensure that a datapoint’s alert condition is persistent for at least two data polls before an alert is triggered. The options available from the Alert trigger interval (consecutive polls) field’s dropdown are based on 0 as a starting point, with “Trigger alert immediately” essentially representing “0”. A value of “1” then, for example, would trigger an alert upon the first consecutive poll (or second poll) that returns a valid value outside of the thresholds. By using the schedule that defines how frequently the DataSource collects data in combination with the alert trigger interval, you can balance alerting on a per-datapoint basis between immediate notification of a critical alert state or quieting of alerting on known transitory conditions.
Each time a datapoint value doesn’t exceed the threshold, the consecutive polling count is reset. But it’s important to note that the consecutive polling count is also reset if the returned value transitions into the territory of a higher severity level threshold. For example, consider a datapoint with thresholds set for warning and critical conditions with an alert trigger interval of three consecutive polls. If the datapoint returns values above the warning threshold for two consecutive polls, but the third poll returns a value above the critical threshold, the count is reset. If the critical condition is sustained for the next two polls (for a total of three polls) a critical alert is what is ultimately generated.
Note: If “No Data” is returned, the alert trigger interval count is reset.
Note: The alert trigger interval set in the Alert trigger interval (consecutive polls) field only applies to alerts triggered by static thresholds. Alerts triggered by dynamic thresholds use a dedicated interval that is set as part of the dynamic threshold’s advanced configurations. See Enabling Dynamic Thresholds for Datapoints for more information.
Alert Clear Interval
The Alert clear interval (consecutive polls) field defines the number of consecutive collection intervals for which an alert condition must not be present before the alert is automatically cleared. The length of one collection interval is determined by the DataSource’s Collect every field, as discussed in Creating a DataSource.
The field’s default value of “Clear alert immediately” will automatically clear as soon as the datapoint value no longer satisfies the alert criteria.
As with the alert trigger interval, the options available from the Alert clear interval (consecutive polls) field’s dropdown are based on 0 as a starting point, with “Clear alert immediately” essentially representing “0”. Setting the alert clear interval to a higher value helps ensure that a datapoint’s value is persistent (i.e. has stabilized) before an alert is automatically cleared. This can prevent the triggering of new alerts for the same condition.
Note: If “No Data” is returned, the alert clear interval count is reset.
Note: The alert clear interval established here is used to clear alerts triggered by both static and dynamic thresholds.
Alert Message
If the “Use default templates” option is selected from the Alert message field’s dropdown menu, alert notifications for the datapoint will use the global DataSource alert message template that is defined in your settings. For more information on global alert message templates, see Alert Messages.
However, as best practice, it is recommended that any datapoint with thresholds defined have a custom alert message that formats the relevant information in the alert, and provides context and recommended actions. LogicMonitor’s out-of-the-box DataSources will typically already feature custom alert messages for datapoints with thresholds defined.
To add a custom alert message, select “Customized” from the Alert message field’s dropdown and enter notification text for the Subject and Description fields that dynamically appear. As discussed in Tokens Available in LogicModule Alert Messages, you can use any available DataSource tokens in your alert message.
The HostStatus DataSource is a critical component for effectively monitoring your infrastructure. It associates with all devices added to your portal and is used to determine whether the device is responsive. Specifically, the idleInterval datapoint within the HostStatus DataSource measures the amount of time in seconds since the LogicMonitor Collector was able to collect data from your host via built-in collection methods (SNMP, Ping, WMI, and so on).
The absence of all data is important in order to formally declare a host as down. For example, data collection failures for individual protocols can result from credential errors such as an updated SNMP community string or a new WMI username/password. But the device may still be pingable, and thus not actually be down. Note that data collected by script DataSources does not affect the value of the idleInterval datapoint.
A sample configuration for the idleInterval datapoint can be seen in the following screenshot.
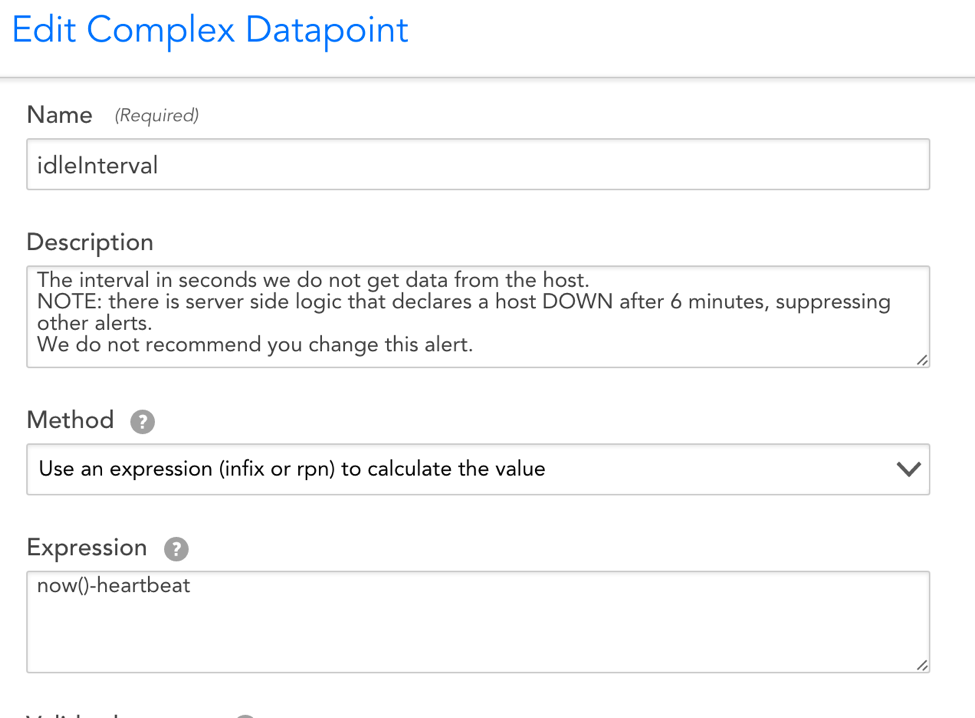
How the HostStatus DataSource Functions
When the associated Collector is unable to contact your host for a period of six minutes or more, all alert notifications emanating from that host will be suppressed (the six minute period of time is not configurable). This alert notification suppression will not auto-trigger an alert indicating that the host has been declared down. That is the job of the HostStatus DataSource. The HostStatus DataSource will trigger a critical alert declaring the host down following the period of time designated in the idleInterval datapoint’s alert threshold.
Note: If a newly-added device has resided in the portal for less than 30 minutes and fails host status checks, it will not be declared down after six minutes. Instead, it will require at least 30 minutes of inaccessibility before being declared down.
Note: Users should not customize the HostStatus DataSource. Changes such as increasing the idleInterval datapoint’s alert threshold or renaming the datasource can result in cascading alert suppression without notification.
Monitoring Impacts of a Host Down Alert
When a host goes down, no new alert will get generated (except HostStatus) and all other existing alert notifications emanating from the host will be suppressed. This means they will not trigger notifications to their respective escalation chains. This will reduce the noise caused by the cascading effects of your host being down.
Troubleshooting
If you receive a host down alert, but the host is not down, access the Collector Debug Facility and try one of the following primary courses of action:
- Check the network connectivity from the Collector to the host by running the
!pingcommand from the Collector debug interface. If the ping reports 0 packets returned, get the IP address of the Collector by running the!ipaddresscommand. If you can manually ping from the command line using the same IP address or domain names, then this indicates a bug. - Rare problems with the communication between the application and Collector can cause tasks not to schedule properly. If ping works, then it is possible that there is a problem with task scheduling or execution. To check task scheduling or execution, use the
!tlistand!tdetailcommands.!tlistreturns a list of all the Collector’s collection tasks and some status for each task!tdetailreturns a more detailed view of a single collection task
Introduction
Generally, the pre-defined collection methods such as SNMP, WMI, WEBPAGE, etc. are sufficient for extending LogicMonitor with your own custom DataSources. However, in some cases you may need to use the SCRIPT mechanism to retrieve performance metrics from hard-to-reach places. A few common use cases for the SCRIPT collection method include:
- Executing an arbitrary program and capturing its output
- Using an HTTP API that requires session-based authentication prior to polling
- Aggregating data from multiple SNMP nodes or WMI classes into a single DataSource
- Measuring the execution time or exit code of a process
Script Collection Approach
Creating custom monitoring via a script is straightforward. Here’s a high-level overview of how it works:
- Write code that retrieves the numeric metrics you’re interested in. If you have text-based monitoring data you might consider a Scripted EventSource.
- Print the metrics to standard output, typically as key-value pairs (e.g. name = value) with one per line.
- Create a datapoint corresponding to each metric, and use a datapoint post-processor to capture the value for each key.
- Set alert thresholds and/or generate graphs based on the datapoints.
Script Collection Modes
Script-based data collection can operate in either an “atomic” or “aggregate” mode. We refer to these modes as the collection types SCRIPT and BATCHSCRIPT respectively.
In standard SCRIPT mode, the collection script is run for each of the DataSource instances at each collection interval. Meaning: for a multi-instance DataSource that has discovered five instances, the collection script will be run five times at every collection interval. Each of these data collection “tasks” is independent from one another. So the collection script would provide output along the lines of:
key1: value1
key2: value2
key3: value3
And then three datapoints would need be created: one for each key-value pair.
With BATCHSCRIPT mode, the collection script is run only once per collection interval, regardless of how many instances have been discovered. This is more efficient, especially when you have many instances from which you need to collect data. In this case, the collection script needs to provide output that looks like:
instance1.key1: value1
instance1.key2: value2
instance1.key3: value3
instance2.key1: value1
instance2.key2: value2
instance2.key3: value3
As with SCRIPT collection, three datapoints would need be created to collect the output values.
Script Collection Types
LogicMonitor offers support for three types of script-based DataSources: embedded Groovy, embedded PowerShell, and external. Each type has advantages and disadvantages depending on your environment:
- Embedded Groovy scripting: cross-platform compatibility across all Collectors, with access to a broad number of external classes for extended functionality
- Embedded PowerShell scripting: available only on Windows Collectors, but allows for collection from systems that expose data via PowerShell cmdlets
- External Scripting: typically limited to a particular Collector OS, but the external script can be written in whichever language you prefer or you can run a binary directly
Disclaimer: This content is no longer being maintained or updated. This content will be removed by 2025.
Setting up a PowerShell datasource in LogicMonitor is a similar process to other script datasources.
Active Discovery
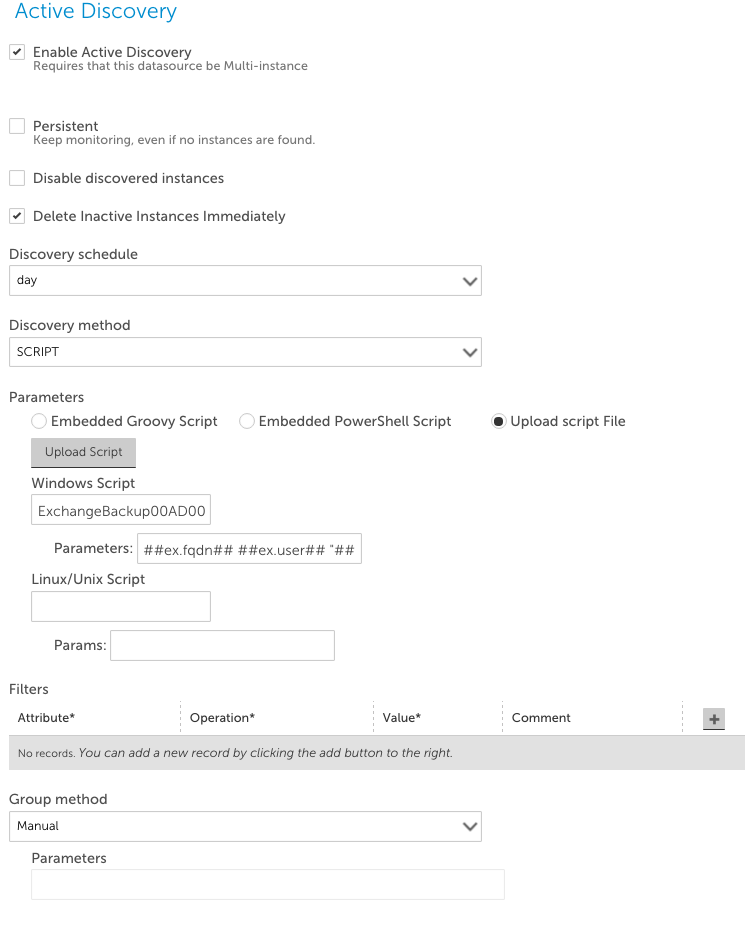
If the PowerShell datasource is going to be multi-instance, active discovery can be used to automate the task. This can be done with a PowerShell script which returns outputs in the format mentioned above. Arguments can be used to pass host properties into scripts to pass credentials or specific host information into the script.
When you specify your PowerShell script for use with LogicMonitor, you should upload it to your account using the “Upload Script” button that will display when the script collector is selected, to ensure that the script is available on all collectors. Another thing to keep in mind when uploading, there is no version control, so new versions of scripts should be named differently. For example, PS-AD-00.ps1, PS-AD-01.ps1. Below is an example of the active discovery setup for a PowerShell script.
Note: When passing arguments, spaces are not supported in an argument. Arguments with a \, such as domain\user should have the \ escaped. e.g domain\\user. This may require a different property for the Active Discovery and Collection. These are due to be resolved in a future release.
Collection
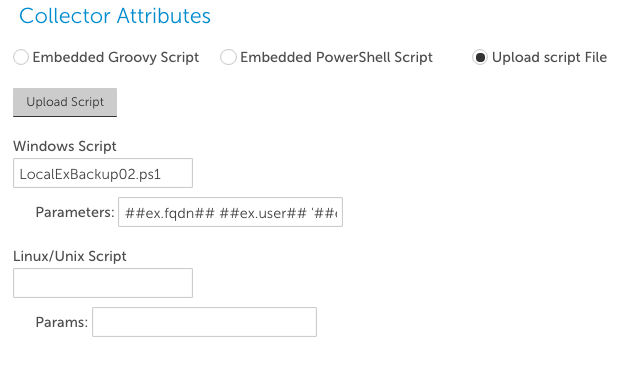
Collection is the same procedure as the Active Discovery setup. See a screenshot below for an example.
Note: Spaces are supported in arguments here. To allow for this put the argument in quotes. \ also do not need to be escaped like in Active Discovery
Datapoint Creation
If the script returns multiple values, I recommend outputting them in the format used in the example in the previous section. We can then use regex to pluck the values out.
If we used the output below as an example we can use the following regex to return the data
match=(\d+)
updateSuccessfull=(\d+)
etc..
WMI is the standard protocol for data and operations management on most Windows operating systems. The following article will guide you through properly configuring Active Discovery using the WMI collection method.
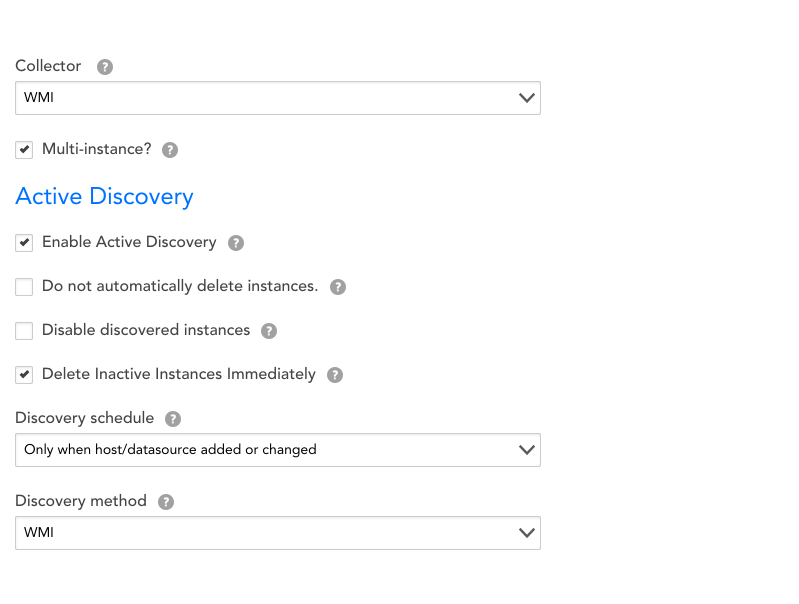
In the Create a Datasource window, you will need to select “WMI” under the Collector field. This will update the Active Discovery section for WMI configuration.
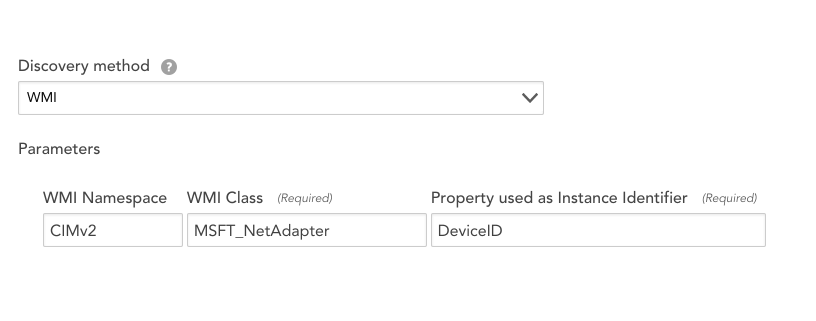
Once you have selected WMI as your Collector protocol/Discovery method, you will be asked to configure the following spaces: WMI Namespace, WMI Class, and Property used as instance identifier. Collectively, these three fields compose the basic WMI filesystem hierarchy in which all Window’s objects reside. As such, they define the parameters as to where our Collector should retrieve information from your devices.
In this hierarchy, WMI Namespace designates the root, top-level. For monitoring purposes, the vast majority of relevant data can be found in the CIMv2 namespace, hence why this field comes auto-populated with CIMv2. Should you be looking for information in another namespace or working with an operating system that does not use CIMv2 (ie. Kernel 5.x, which uses Default\CIMv2), you can simply designate the desired namespace.
Nestled within WMI namespaces are WMI Classes. These classes contain information that manage both hardware and system features. For instance, MSFT_NetAdapter class would contain the full list of properties relevant to a particular network adapter.
The lowest tier in WMI’s file system hierarchy, nestled within WMI classes, are the WMI properties. These properties‘ values are the basic information which LogicMonitor will collect and on which LogicMonitor will alert (ie. the WMI property is equivalent to this Datasource’s instance). Examples of properties residing within the aforementioned MSFT_NetAdapter class include Name, DeviceID, MaxSpeed, PortNumber, etc.
Filtering in WMI Active Discovery
WMI Active Discovery supports flexible instance filtering. Multiple filters can be added to include or exclude different objects.
The examples below show two filters:
- A filter has been added to exclude all “name” instances that do not RegexMatch “exchange.” This ensures that only Exchange process are discovered.
- A filter was added to exclude all instances that are in an “ok” status. In the Win32_Service Class, this will return status properties with a value of Error, Degraded, Unknown, Pred Fail, Starting, Stopping, Service, Stressed, NonRecover, No Contact, or Lost Comm.
WMI Instance Level Properties
LogicMonitor WMI Active Discovery automatically discovers instances of a datasource on a particular Windows system based on specified WMI Class, Property and Namespace information. Your LogicMonitor collector will discover all instances of the WMI Class and return each instance with the WMI Property as the instance identifier. You can add one or more Active Discovery filters based on WMI Properties, so that only discovered instances that meet the filter criteria will be returned.
For example, to get the names of all network adapter instances in a Windows system, you could specify the following WMI Class and Property information:
WMI Class: Win32_NetworkAdapter
WMI Property: Name
The network adapter instances would be returned with their names as instance identifiers as follows:
Intel® PRO/1000 MT Network Connection
Citric Virtual Adapter
Microsoft ISATAP Adapter
With WMI Active Discovery you can choose to extract ILP information about each instance discovered in a WMI Class. This extracted information is stored as one or more system properties for the device, and can aid in the understanding and troubleshooting of the device.
Consider the following table showing instances discovered by WMI Active Discovery with and without ILP, and the information gathered for each:
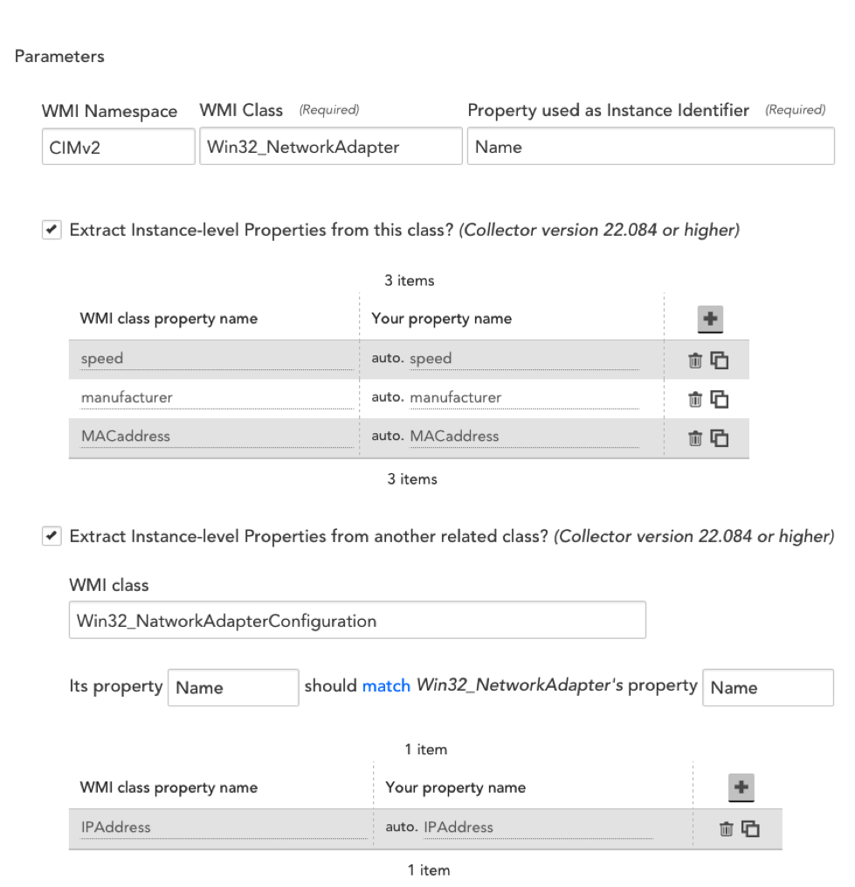
When you check the ‘Extract instance-level properties from this class’ checkbox, you can enter the WMI Class Properties you wish to obtain for each instance of the specified WMI Class:
You will be prompted for information about how the two WMI Classes you are extracting ILPs from should be linked. Specifically, you will need to specify a WMI Property that is shared between the two WMI Classes. LogicMonitor will only discover instances from the second WMI Class if the WMI Property specified matches between these two classes.
For the network adapter example above, every network adapter name record in the Win32_NetworkAdapter will have a corresponding network adapter name record in the Win32_NetworkAdapterConfiguration class. The WMI “name” property is a common property between the Win32_NetworkAdapter and Win32_NetworkAdapterConfiguration classes, and can therefore be used to link these two classes.
Add a Filter (with ILPs)
If any Active Discovery filters are specified, only discovered instances that meet the filter criteria will be returned.
Without ILP enabled you can only add filters based on the instance identifiers (i.e. SNMP property values) for the discovered SNMP instances. If you choose to extract ILPs, you may add filters based on the ILPs discovered. For example, with ILPs you can easily create an Active Discovery filter that filters out only disabled network adapters, or processes running on specific versions of Windows.
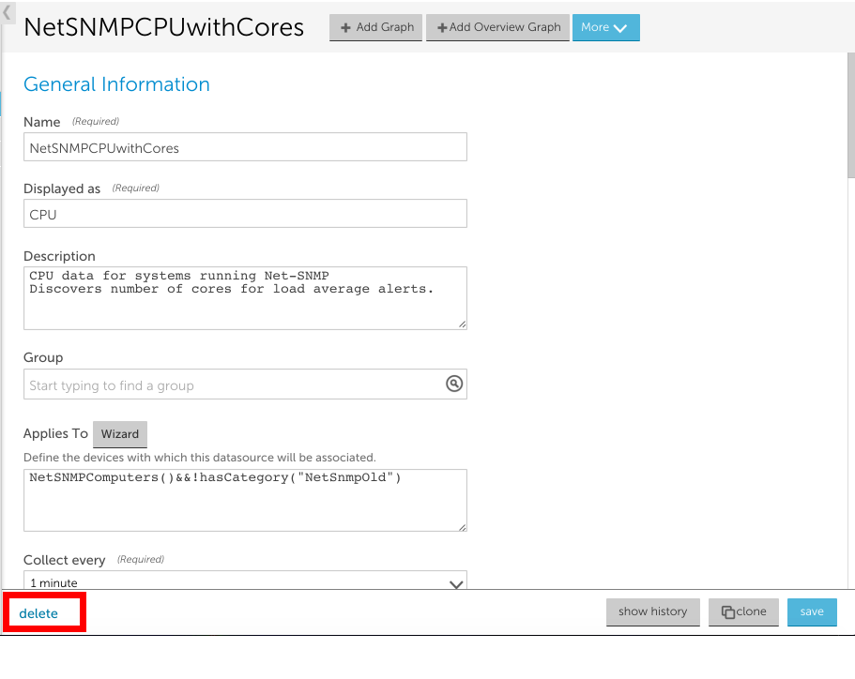
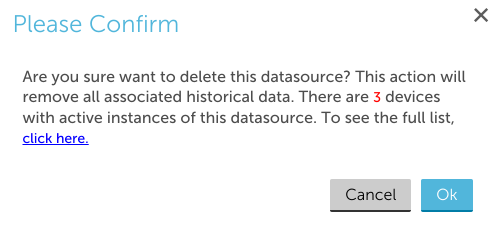
You can delete a datasource from the datasource definition, using the ‘delete’ option in the bottom left hand corner:
Overview
Our team of monitoring engineers have come up with a number of best practices and other recommendations for the effective creation of DataSources. When creating or modifying DataSources we strongly recommend you follow these guidelines.
Naming
- The DataSource Name serves as the unique “key” by which a datasource is identified within your account. As such, we recommend a naming standard along the lines of: Vendor_Product_Monitor. For example: PaloAlto_FW_Sessions, EMC_VNX_LUNs, Cisco_Nexus_Temperature, etc.
- Because the Name serves as a “key” we recommend that it not include spaces.
- Some legacy datasources included a trailing dash in their name to differentiate multi-instance vs single instance, but this is no longer necessary nor recommended.
- The Display Name is used solely for display purposes of the DataSource within the device tree. As such, it needs to contain only enough detail to identify the Datasource within the device itself. For instance, a datasource named EMC_VNX_LUNs could have a display name of LUNs.
Description & Technical Notes
- The Description field is used to briefly describe what is monitored by this DataSource. This information is included in the device tree, so should be sufficiently succinct to describe only what the DataSource does.
- DataSource Technical Notes should contain any implementation details required to use this module. For example, if specific device properties are required to be set on the parent device, or if this datasource is relevant only to specific OS or firmware versions, these details should be noted here.
DataSource Groups
- Because DataSource groups provide an additional tier within the a device’s DataSource tree, grouping is only useful when you’d like “hide” ancillary datasources for a particular device. For instance, the default DataSources of DNS, Host Status, and Uptime are grouped because they aren’t the primary instrumentation for a device. Grouping should not be used for a group of datasources that provide primary instrumentation for a system. For instance, a suite of DataSources for monitoring various NetApp metrics should not be grouped, because you want the NetApp-specific monitoring to have primary visibility in the device tree.
AppliesTo & Collection Schedule
- Construction of the Applies To field should be carefully considered so that it’s neither overly broad (e.g. using the isLinux() method) nor overly narrow (e.g. to a single host). Typically it’s best that — where possible — a DataSource is applied to a system.category (via the hasCategory() method), and that a corresponding PropertySource or SNMP SysOID Map build to automatically set the system.category. For detailed information on using the Applies To field, along with an overview of the AppliesTo scripting syntax, see AppliesTo Scripting Overview.
- The Collection Schedule should be set to an interval appropriate to the data being checked. Instrumentation that changes quickly (CPU) or are important to alert on quickly (ping loss) should have a very short polling cycle such as 1 minute. Items that can tolerate a longer period between alerts, or change less frequently (drive loss in a RAID system, disk utilization ) should have a longer poll cycle — maybe 5 minutes. Longer poll cycles impose less load on the server being monitored, the Collector, and the LogicMonitor platform.
Active Discovery Considerations
- Active Discovery should be employed only when the datasource is designed to monitor one or more instances of a given type, or for a single instance that may frequently disappear and reappear. If the system being monitored has only a single static instance, better to use a PropertySource to discover the instance and set the device property accordingly.
- Care should be taken with the “Do not automatically delete instances” setting. This flag should be set only if a failure in the system being monitored would result in Active Discovery no longer being able to detect the instance. In these cases you want the “Do not automatically delete instances” to be set. Otherwise, if Active Discovery runs shortly after a failure, the failing instance would be removed from monitoring and the alerts cleared. For example, if an application instance is detected simply by ActiveDiscovery monitoring TCP response on port 8888, then if the application fails, so that port 8888 was not responding, you would not want Active Discovery to remove the instance.
- Ensure any Active Discovery filters have an appropriate description in the comment field — this is imminently helpful for diagnosing problems.
- When defining any parameters, attempt to use device property substitution (e.g. ##jmx.port##) rather than hard coding values.
Datapoint Construction
- The Datapoint Name field should — where possible — reflect the name used by the entity that defined the object to be collected. For instance, an SNMP datapoint should be named using the object name corresponding to the SNMP OID. Or for a WMI datapoint you’d want to use the WMI corresponding WMI property name.
- Every datapoint should include a human-readable description. In addition to describing the specific metric, the description field should contain the units used in the measurement.
- A Valid Value range should be set to normalize incoming data, as this will prevent spurious data from triggering alerts.
- The Alert Transition Interval for each datapoint with an alert threshold should be considered carefully. The transition interval should maintain a balance of immediate notification of an alert state (a value of 0 or 1) vs quelling potential alerts on transitory conditions (a value of 5 or more).
- Any datapoint with an alert threshold defined should have an custom alert message. The customer alert should format the relevant information in the message text, as well as provide context and recommended remediations where possible.
- Ensure that every datapoint you create is used either in a graph, a complex datapoint, or to trigger an alert. Otherwise it’s not being used.
- Create Complex Datapoints only when you need to calculate a value for use in an alert or a report. If you need to transform a datapoint only for display purposes, better to use a virtual datapoint to perform such calculations on-the-fly.
Graph Styling
- Graphs Names should use a Proper Name that explains what the graph displays. Overview Graphs names should include a title keyword to indicate that it’s an overview (e.g. Top Interfaces by Throughput or LUN Throughput Overview).
- The vertical label on a graph should include either a unit name (°C, %), a description (bps, connections/sec, count), or a status code (0=ok, 1=transitioning, 2=failed). When displaying throughput or other scaled units, it’s best to convert from kilobytes/megabytes/gigabytes to bytes and let graph scaling handle the unit multiplier.
- Ensure you’ve set minimum and maximum values as appropriate for the graph to ensure it’s scaled properly. In most cases, you’ll want to specify at 0 minimum value.
- Display Priority should be used to sort graphs based on order of relevance, so that the most important visualizations are presented first.
- Line legends should use Proper Names with correct capitalization and spaces.
- When selecting graph colors, use red for negative/bad conditions and green for postiive/good conditions. For example, use a green “area” to represent total disk space and a “red” area in front to represent used disk space.
Overview
The BatchScript Data Collection method is ideal for DataSources that:
- Will be collecting data from a large number of instances via a script, or
- Will be collecting data from a device that doesn’t support requests for data from a single instance.
The Script Data Collection method can also be used to collect data via script, however data is polled for each discovered instance. For DataSources that collect across a large number of instances, this can be inefficient and create too much load on the device data is being collected from. For devices that don’t support requests for data from a single instance, unnecessary complication must be introduced to return data per instance. The BatchScript Data Collection method solves these issues by collecting data for multiple instances at once (instead of per instance).
Note:
- Datapoint interpretation methods are limited to multi-line key-value pairs and JSON for this collection method. For more information on datapoint interpretation methods, see Normal Datapoints.
- The instances’ WILDVALUE cannot contain the following characters:
:
#
\
space
These characters should be replaced with an underscore or dash in WILDVALUE in both Active Discovery and collection.
How the BatchScript Collector Works
Similar to when collecting data for a DataSource that uses the script collector, the batchscript collector will execute the designated script (embedded or uploaded) and capture its output from the program’s stdout. If the program finishes correctly (determined by checking if the exit status code is 0), the post-processing methods will be applied to the output to extract value for datapoints of this DataSource (the same as other collectors).
Output Format
The output of the script should be either JSON or line-based.
Line-based output needs to be in the following format:
JSON output needs to be in the following format:
{
  data: {
    instance1: {
      values: {
        "key1": value11,
        "key2": value12
      }
    },
    instance2: {
      values: {
        "key1": value21,
        "key2": value22
      }
    }
  }
}Since the BatchScript Data Collection method is collecting datapoint information for multiple instances at once, the ##WILDVALUE## token needs to be used in each datapoint definition to pass instance name. “NoData” will be returned if your WILDVALUE contains the invalid characters named earlier in this support article.
Using the line-based output above, the datapoint definitions should use the multi-line-key-value pairs post processing method, with the following Keys:
- ##WILDVALUE##.key1
- ##WILDVALUE##.key2
Using the JSON output above, the datapoint definitions should use the JSON/BSON object post processing method, with the following JSON paths:
- data.##WILDVALUE##.values.key1
- data.##WILDVALUE##.values.key2
BatchScript Data Collection Example
If a script generates the following output:
Then the IOPS datapoint definition may use the key-value pair post processing method like this:
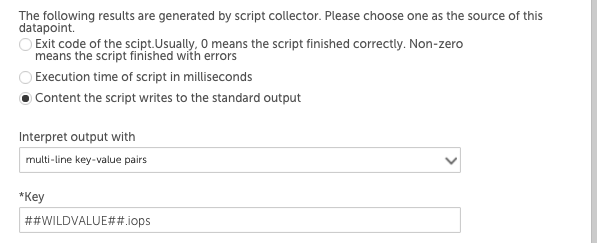
The ##WILDVALUE## token would be replaced with disk1 and then disk2, so this datapoint would return the IOPS values for each instance. The throughput datapoint definition would have ‘##WILDVALUE##.throughput’ in the Key field.
BatchScript Retrieve Wild Values Example
Wild values can be retrieved in the collection script:
def listOfWildValues = datasourceinstanceProps.values().collect { it.wildvalue }datasourceinstanceProps.each { instance, instanceProperties ->
instanceProperties.each
{ it -> def wildValue = it.wildvalue // Do something with wild value }
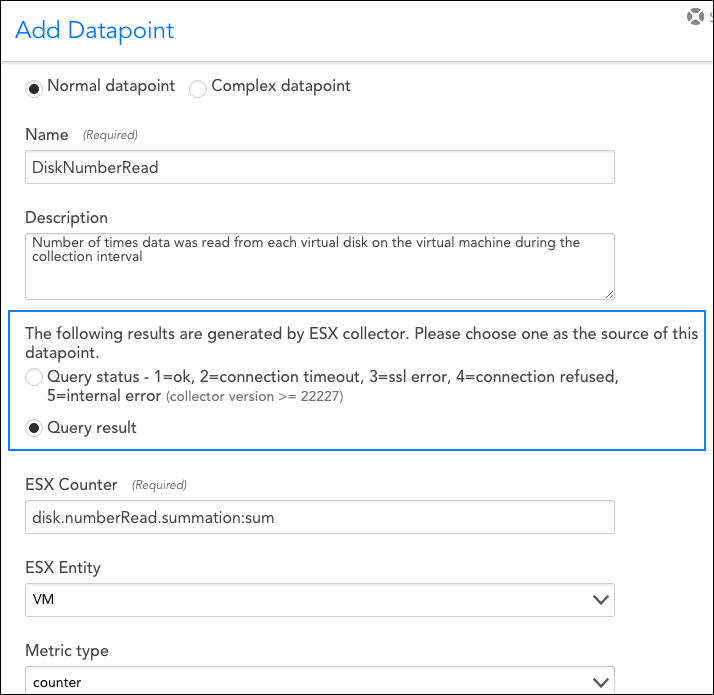
}The ESX collector allows you query data via the VMWare API. When adding or editing a datapoint using the ESX collector, you will see a dialog window similar to the one shown next.
As highlighted in the above screenshot and discussed next, the ESX collector generates two types of results. You’ll need to choose one of these as the source for your datapoint.
Query Status
When selected, the Query status option returns vCenter status. This allows the DataSource to identify the source of an inaccessible VM, whether the issue stems from the VM itself or vCenter.
The following response statuses may be returned:
- 1=ok
- 2=connection timeout (or failed login due to incorrect user name or password (Collector versions 26.300 or earlier))
- 3=ssl error
- 4=connection refused
- 5=internal error
- 6=failed login due to incorrect user name or password (Collection versions 26.400 or later)
Note: You must have Collector version 22.227 or later to use the Query status option.
Query Result
When selected, the Query result option returns the raw response of the ESX counter you designate in the following ESX Counter field. The counter to be queried must be one of the valid ESX counters supported by the API. (See vSphere documentation for more information on supported ESX counters.)
As shown in the previous screenshot, a LogicMonitor specific aggregation method can be appended to the counter API object name in the Counter field. Two aggregation methods are supported:
- :sum
Normally, the ESX API will return the average of summation counters for multiple objects when queried against a virtual machine. When “:sum” is appended, LogicMonitor will alternately collect the sum. For example, using the counter shown in the above screenshot, a virtual machine with two disks, reporting 20 and 40 reads per second respectively, would return 60 reads per second for the virtual machine, rather than 30 reads per second. - :average
Because the summation of counters is not always the average of counters, LogicMonitor also supports “:average” as an aggregation method. For example, the cpu.usagemhz.average counter would normally return the sum of the averages for multiple objects for the collection interval. When “:average” is appended, LogicMonitor will divide this sum by the number of instances in order to return an average.
For more general information on datapoints, see Datapoint Overview.
Note: There is a known bug in VMware’s vSphere 4. Once there has been a change in freespace of datastores, it may take up to 5 minutes for this change to be reflected in your display. Read more about this bug and potential work-arounds here.


