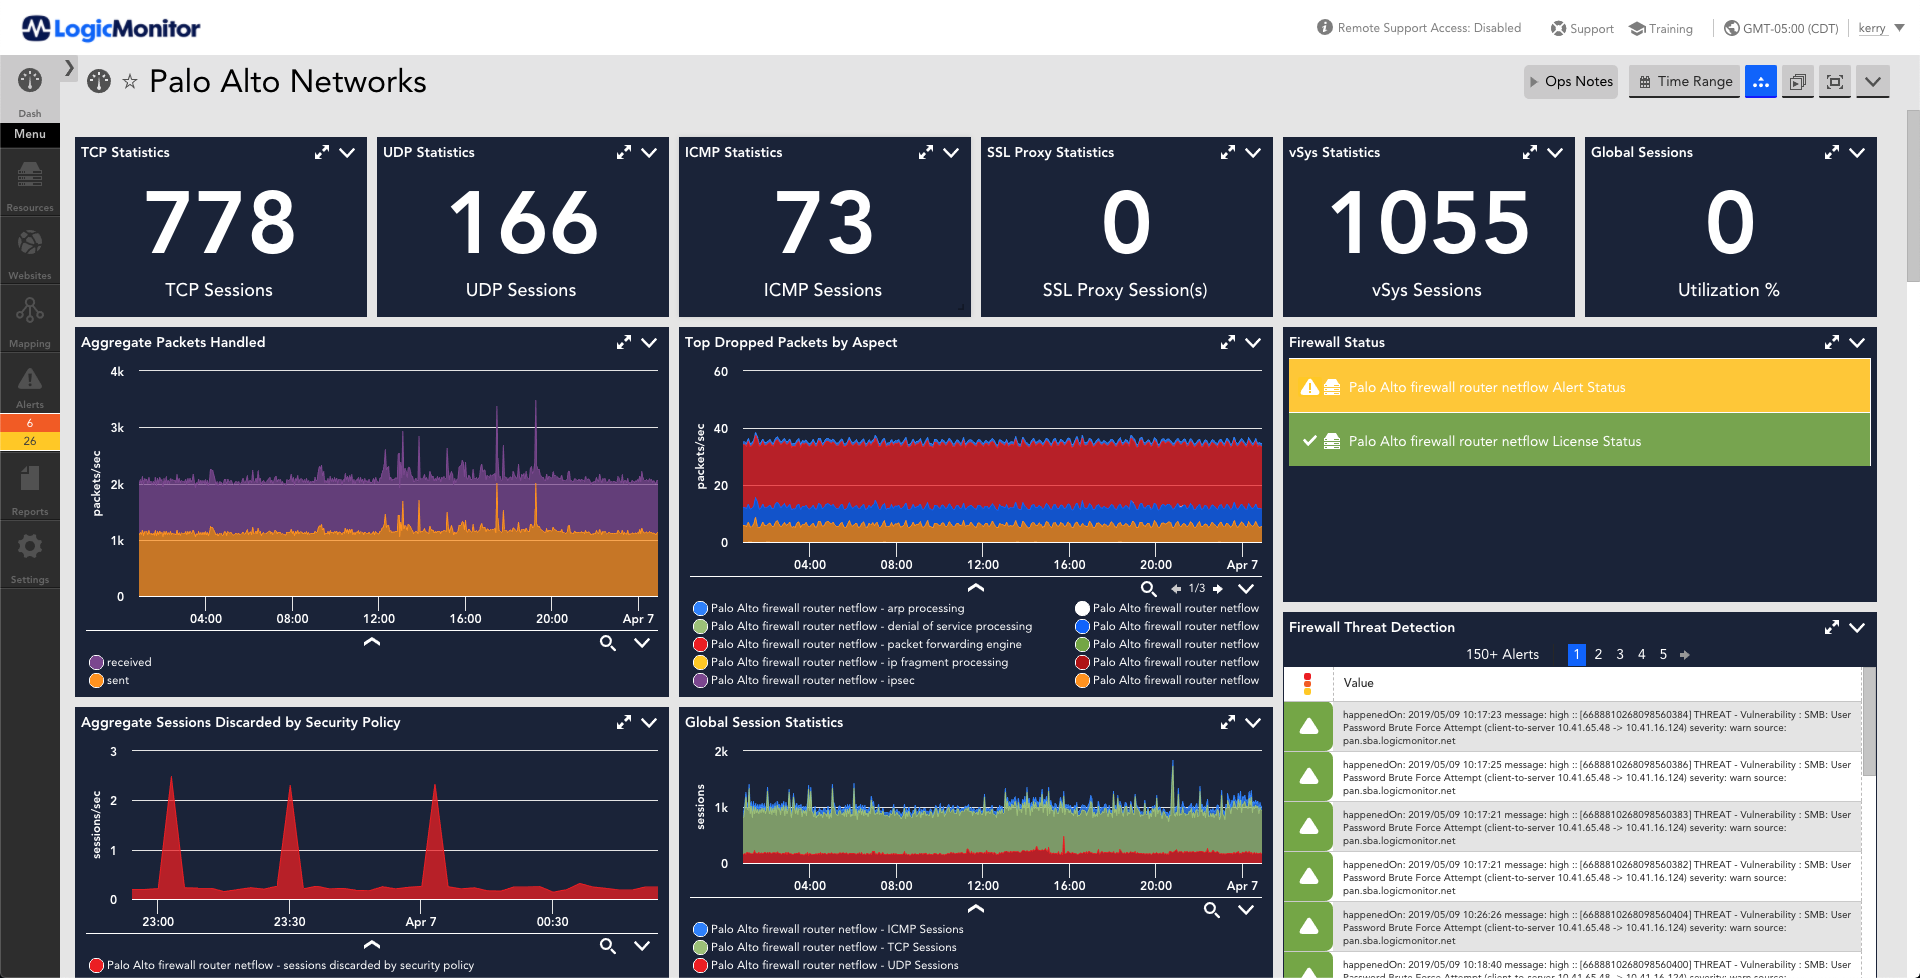
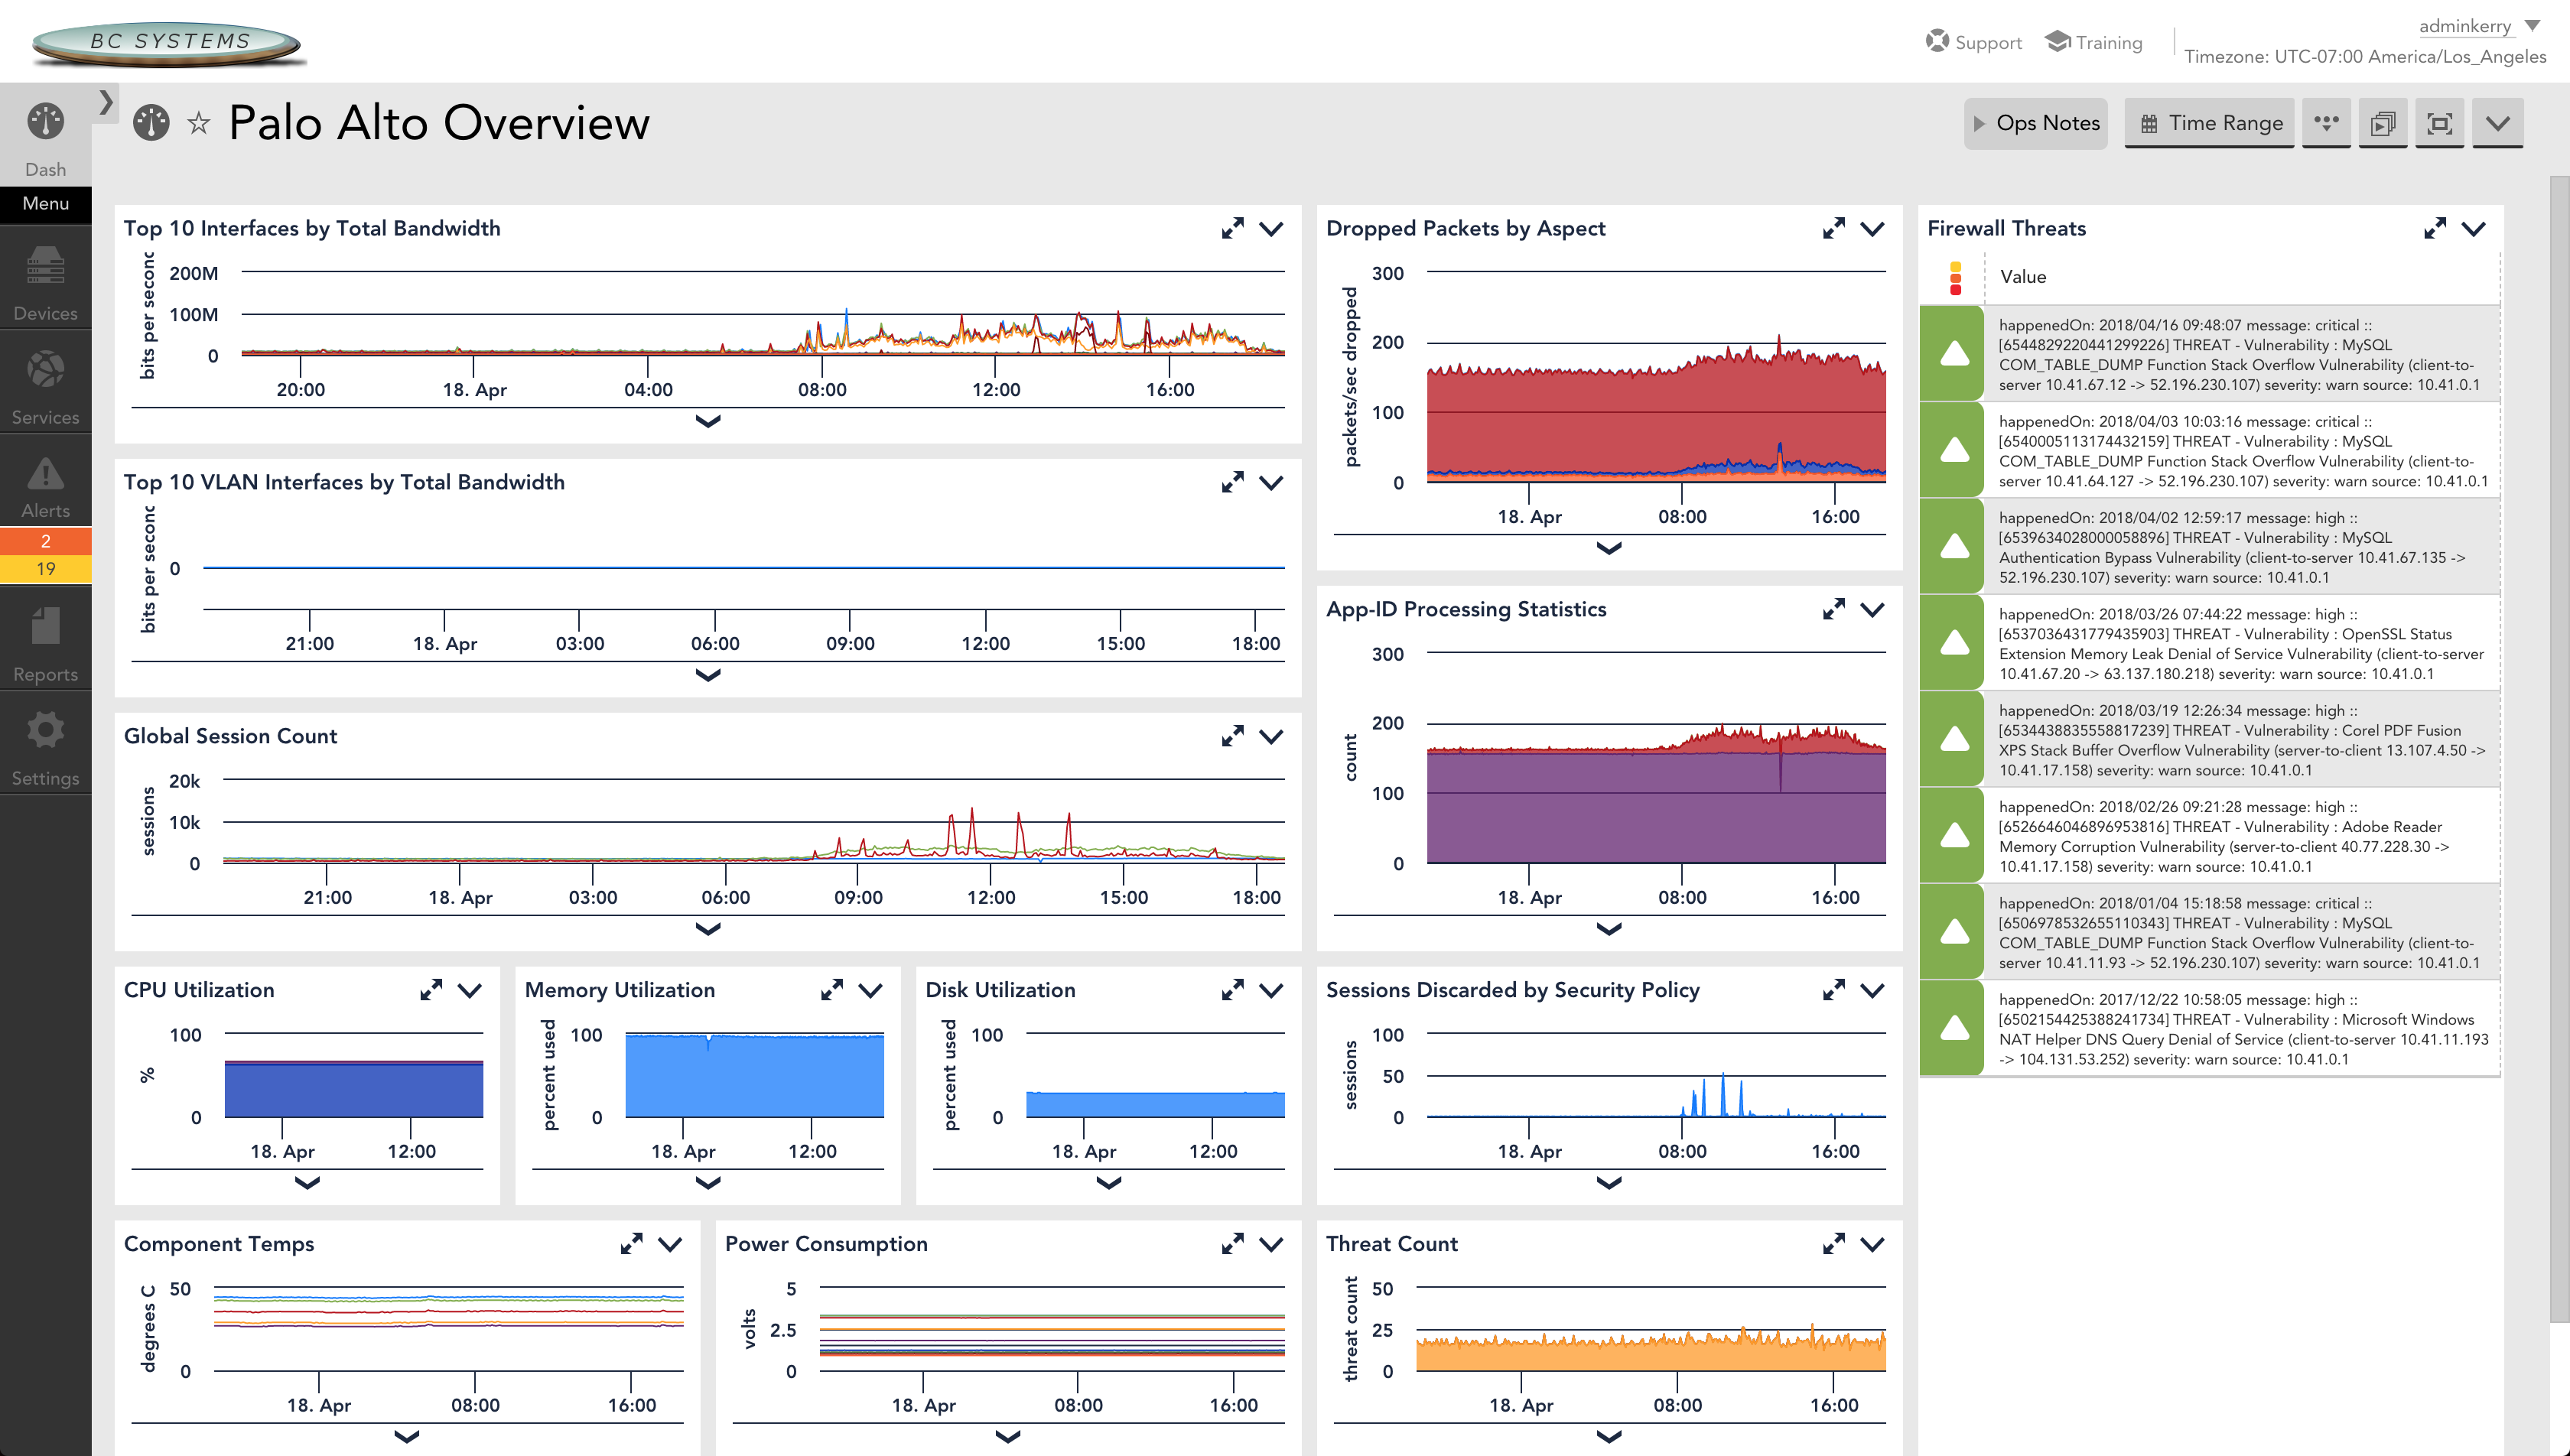
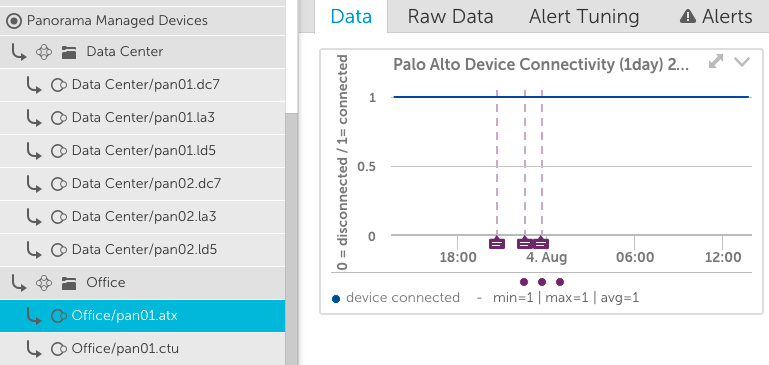
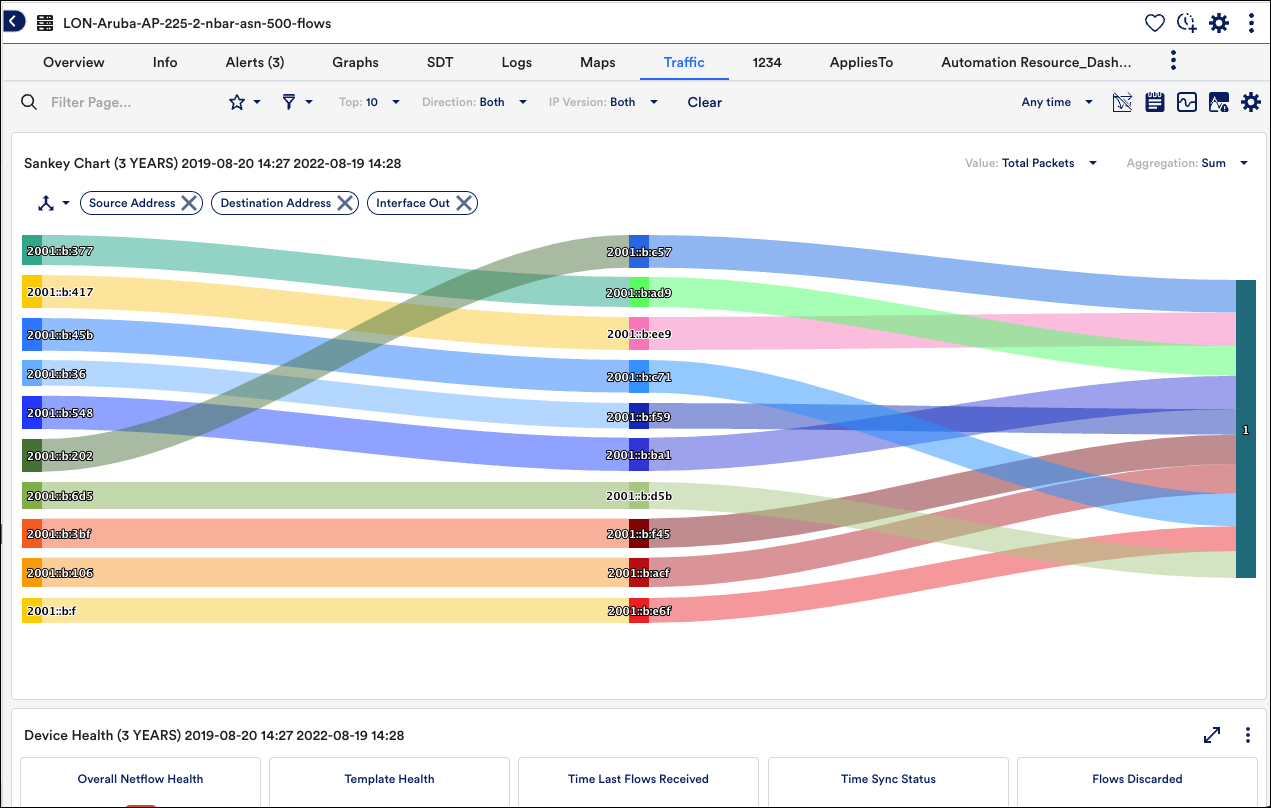
Palo Alto Networks Firewall Sessions Monitoring

Use LogicMonitor’s out of the box firewall monitoring to monitor your Firewall sessions and more, including:

  • Session statistics
  • Percentage of total sessions actively used
  • Session Utilization
  • SSL Sessions and Capacity
This dashboard provides an a listing of various metrics that are monitored for Palo Alto firewalls. The metrics displayed are counts of: TCP sessions, UDP sessions, ICMP sessions, SSL proxy sessions, vSyssessions, utilizations, packets handled over time, pack dropped over time, sessions discarded over time, session statistics over time, status, and Firewall events

Hardware firewall monitoring

LogicMonitor will automatically discover, monitor, graph and alert on Palo Alto Networks Firewall hardware elements, including:

  • CPU and Dataplane Core utilization
  • Component temperatures
  • Fan Speed and Performance
  • Power Supply levels on different sensors through the chassis

Threat Analysis

LogicMonitor will take advantage of the intelligent threat analysis of Palo Alto Networks, and report on the number of threats discovered, classified by severity, and alert you through escalating notifications.

Panorama Management

Discover devices managed by the Panorama system. Report and alert on connectivity, policy synchronization, and more.

Netflow data

Send the Netflow data from your Palo Alto Networks firewalls to a LogicMonitor collector, and get easy and powerful visualizations of your traffic, allowing you to drill in to any time period, and view top talkers, protocols, servers and clients.

End to End Real-time Visibility and Proactive Monitoring

Logs and metrics
Operate Efficiently
Real-time Visibility
Proactive Monitoring

Unified Logs and Metrics

Out-of-the-box integrations provide customization to send network log data type into LogicMonitor for monitoring and analysis alongside health and performance metrics

What Is Database Monitoring, and Why Is It Still Important?

Operate Efficiently

Free up time and resources that would otherwise be spent in configuration, so teams can focus on more important tasks and initiatives.

7 Steps to Transform Your Service Provider Business

Real-time Visibility

LogicMonitor provides real-time visibility into the performance of Palo Alto Networks devices, allowing organizations to quickly identify and resolve any issues that may arise

Why SREs need better visibility, not more tools

Proactive Monitoring

LogicMonitor’s AIOps and automation capabilities reduce the need for manual checks and allow organizations to identify potential problems before they become critical issues

More Palo Alto Resources

Palo Alto Prisma SD-WAN monitoring

Monitor Prisma SD-WAN sites, tunnels, and path quality with auto discovery, real-time alerts, and clear dashboards.

Documentation
Palo Alto Firewalls

Track health and security of PA-Series and VM-Series firewalls, from interface throughput to threats and configuration changes.

Documentation
Palo Alto Performance Monitoring

Learn how to trend Palo Alto performance, set practical thresholds, and troubleshoot slowdowns before users feel them.

Blog
Palo Alto Networks

Explore Palo Alto Networks integrations and resources for bringing security telemetry into your monitoring platform.

Resource
What is Palo Alto Panorama?

Understand Panorama centralized management and how to monitor device groups, pushes, and configuration at scale.

Blog