
API monitoring tools: must-have features for the modern API landscape
The right API monitoring tool changes what your team can see and how fast they can act. Here is how to evaluate what actually fits your stack.


Denton Chikura
The quick download:
The quick download: Modern API monitoring demands full-stack observability, not endpoint checks.
-
Traces, metrics, and logs must connect across microservices, serverless, and third-party dependencies to reveal real bottlenecks.
-
Synthetic and real user monitoring expose gaps between system health and actual user experience.
-
OpenTelemetry ensures data ownership, portability, and consistent instrumentation across your stack.
-
Recommendation: Treat monitoring as code inside your CI/CD pipeline—if it isn’t deployed with the API, it isn’t ready for production.
Today, most forward-looking organizations operate in an API-first environment, where applications aren’t standalone entities but interconnected webs of microservices. With this change, API health checks have evolved from basic endpoint pings to multi-faceted observability. Organizations can adopt a reactive monitoring approach and fix issues as they surface or invest in a proactive strategy supported by advanced observability signals and OpenTelemetry support.
The reactive route often stands as a baseline. Yet, out-of-the-box solutions powered by advanced monitoring platforms offer a more holistic preventative strategy. However, using these tools optimally involves considering multiple factors.
In this article, we delve into the key features of API monitoring tools, why they matter, and how they can support your overall monitoring strategy.
The eight must-have features of modern API monitoring tools
The table below summarizes the top eight must-have features DevOps engineers expect from modern API monitoring tools. Note that basic features expected from any monitoring tool, such as dashboards, reports, and alerts, are not included in this list because we assume them as standard.
| Desired API monitoring tooling features | Explanation |
|---|---|
| API observability signals | Use metrics, traces, and logs. |
| Capable of monitoring the entire transaction path | Include DNS, CDN, and internet transit points to have full visibility into third-party dependencies that can impact user experience. |
| Support for the OpenTelemetry open-source framework | Avoid vendor lock-in with the Cloud Native Computing Foundation (CNCF) toolkit supported by modern vendors. |
| Support for service catalogs and API documentation | Tools like OpenAPI help with API documentation and service catalogs. |
| Integrated with CI/CD pipelines | Integrate with continuous delivery to shift left and include monitoring before code release. |
| Support for all types of API | Monitor SOAP, HTTP, REST, and GraphQL APIs implemented in multiple programming languages. |
| Support for microservices and serverless computing | Consolidate monitoring of services such as AWS API Gateway (that supports serverless), gRPC, and service mesh such as Istio, Consul by Hashicorp, and Linkerd. |
| Multi-level infrastructure monitoring | Monitor all levels of infrastructure (e.g., Kubernetes pods, load balancers, and containers), not only the hosts. |
API observability signals
API observability equips teams to maximize the performance of all API types—private, partner, or public. Essential for this are observability signals—metrics, events, logs, and traces—that collectively provide a nuanced understanding of API behavior.
Each of the four telemetry types holds value in isolation; however, their collective analysis furnishes a holistic view of API health and performance.
Traces
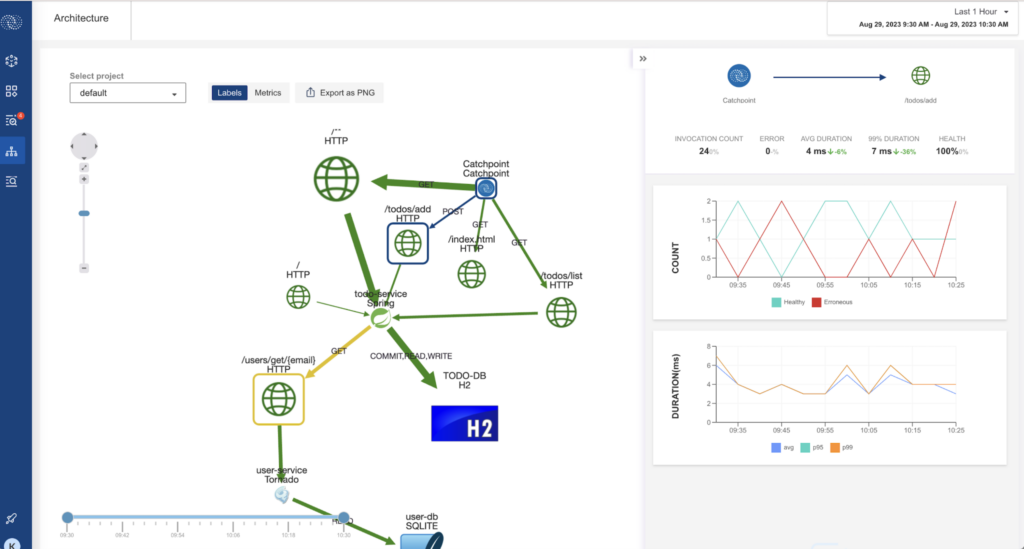
Traces map your system’s transaction journey and offer deep insights into the behavior of your API endpoints by linking individual API calls to specific actions. Imagine a surge in user traffic triggering automatic pod scaling in Kubernetes. Tracing reveals how the request moves through the Load Balancer, API Server, and then to the newly created pod instances, eventually helping identify any latency or error in autoscaling.
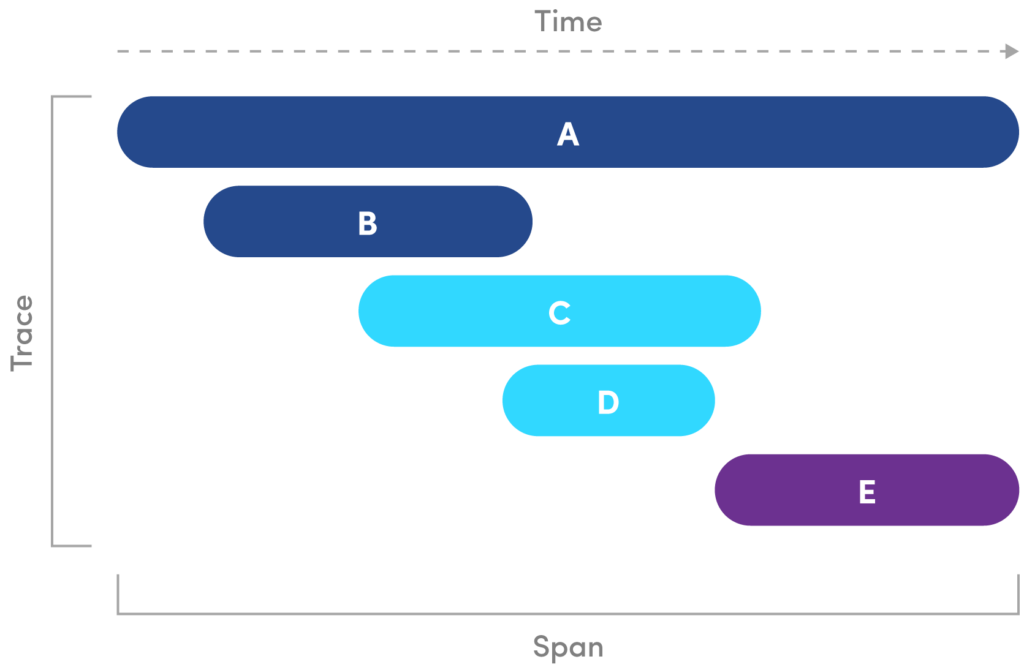
A single trace consists of multiple spans – each spanning different microservices or system components. To understand this better, consider each operation as a span and a collection of spans as a trace.
When evaluating API monitoring solutions, consider the sophistication and flexibility of their tracing features. With advanced tracing, each span can also embed context, such as the invoked SQL queries or the state of the CPU cache. These spans link to metrics and logs, creating a comprehensive trace graph. Verify that the tool’s visualization features use this data to accurately map service interactions to highlight potential bottlenecks and service inefficiencies. Ensure the tracing solution supports all the programming languages and database technologies used in your application stack to avoid blind spots and deliver a high-fidelity trace. A more elaborate explanation of spans and traces is covered in the next section.
Metrics
Metrics are measured or collected at distinct intervals—ranging from milliseconds to hours—to capture the API’s state. They can also be the real-time telemetry of each request, such as the connect time to a particular API endpoint. This dual approach allows for both a snapshot and a continuous view, offering the most comprehensive representation of your API’s performance. They are often segregated into categories for nuanced analysis to help you assess both the what and the why.
Aggregating is always an option, but de-aggregating from an average will only yield approximations. The more raw metrics that are collected, the higher the resolution of your analysis. While sampling gives you an approximate population, capturing each request’s performance metrics allows for an accurate, moment-to-moment assessment.
For representation, some metrics listed in the table below can directly/indirectly affect the performance of an API.
| Metric name | Category | Description | Relevance |
|---|---|---|---|
| Error rates | Operational | Number of failed requests per second. | Measures API reliability. |
| Request count/sec | Operational | API requests received per second. | Indicates load and demand. |
| CPU load | Infrastructure | Percentage of CPU usage. | Highlights resource utilization. |
| Disk I/O | Infrastructure | Input/output operations on disk per second. | Detects bottlenecks in data flow. |
| API token usage | Custom | Frequency of specific API token usage. | Monitors security and usage patterns. |
| Query efficiency | Custom | Time taken for a database query to run. | Evaluates back-end database performance. |
Once you have the metrics in hand, the next logical step is to consolidate these disparate metrics into more manageable and insightful forms. Employing aggregation methods refines raw data points to answer specific performance questions. A few standard aggregation methods include:
- Sum: Adds all values. Helpful in counting total API calls.
- Average: The mean of all metric values. Provides a balanced view but is sensitive to outliers.
- Median: The middle value (same as 50th percentile). Gives a more stable central tendency than averages.
- Percentiles: Shows a range where a particular percentage of the observed values fall. Helps in understanding outliers and system behavior under different loads.
Using histograms alongside aggregation methods can add another layer of granularity to your API monitoring. A histogram groups data points into ranges or ‘bins,’ offering a frequency distribution view. For instance, if you’re looking at latency, a percentile might reveal that most of your requests are fast, but a histogram will show a small but significant number of very slow requests that need investigation.
The sophistication of the tool in managing metrics, applying various aggregation methods, and utilizing histograms should be a critical factor in your selection.
Logs
Logs offer granular details that are exhaustive. A standard API log entry might include, for instance, the Request ID, the invoked serverless compute function (such as AWS Lambda), the cache hit/miss rate, and even relevant database queries. Such granularity aids in event-log correlation and precise security assessment.
When evaluating an API monitoring tool, check if it offers centralized log aggregation. The feature unifies logs across your API gateways, endpoints, and service layers. It empowers you to trace a single API call’s journey across multiple services, simplifying debugging and accelerating incident resolution. Centralizing contextualized data also helps distinguish between API-specific issues and broader systemic problems.
For instance, consider the following log entries:
Service dependency error
2023-09-22T12:35:50Z [API-Service] DependencyError GET /service-b/resourceThe above highlights an error that occurred in a dependent service when processing a GET request. Centralized logs can quickly offer insight into cascading failures and their impact on your API.
Rate-limit exceeded
2023-09-22T12:35:01Z [API-Gateway] RateLimitExceeded /api/v1/trekkersA request to /api/v1/trekkers exceeded the rate limit. With centralized logs, you can swiftly determine who is responsible for the excessive calls and take corrective action.
It’s worth noting that storing logs comes at a high cost due to their sheer storage requirements. A common mistake is collecting all types of logs from all devices at all times, whereas a more strategic approach is to select logs based on their troubleshooting value and relevance to production environments.
Multi-step tests
Conventional tests mostly check endpoints in isolation. When choosing an API monitoring tool, consider its capacity to implement multi-step load tests that simulate real-world interactions, not just isolated calls, to ensure an API is functional.
A comprehensive API test strategy would include most (if not all) of the following use cases:
Secure and diverse authentication methods
Ensure the efficiency of your API within different security contexts. Look for the support of virtual users and various authentication methods, like OAuth or JWT, to replicate complex system demands. The multi-step test must support these varying authentication mechanisms to emulate real user experiences closely.
Consistency across geographic locations
To ensure an API’s global reliability, multi-step tests should be run from different geographic locations. This makes sure every user gets the same level of service, no matter where they’re connecting from.
Catering to diverse user platforms
APIs are accessed through a variety of clients, from mobile apps to desktop browsers. Multi-step tests should allow for this diversity, offering the ability to emulate interactions across these different platforms and capture a more comprehensive picture of the API’s overall performance.
Capable of monitoring the entire transaction path
One significant oversight in API monitoring is the narrow focus on components that lie within the boundary of an organization’s network. Remember that APIs commonly rely on several external touchpoints, including third-party services and various elements on the public internet, to complete a transaction.
Consider monitoring tools that can help you analyze the entire transaction path and the influence of the public internet and various third-party components on your API response times.
Synthetic and Real User Monitoring (RUM): Simulating and verifying reality
We’ve discussed monitoring techniques like tracing that help isolate problems along the transaction path; in this section, we will discuss synthetic and real-user monitoring (RUM) that pertains to what the end-users actually experience in contrast to how the application environment is performing. Measuring the end-user experience helps avoid scenarios where the known API end-points are functioning as expected, but the end-users still experience a slow user interface response time due to unforeseen issues along the transaction path.
Synthetic monitoring also serves as a control experiment in your API landscape, allowing you to run ‘what if’ scenarios with changing user traffic. During low or no workload periods, this approach simulates API calls to generate performance data. As a result, you obtain a consistent baseline to measure when the system is under stress or even when the user traffic is minimal or temporarily non-existent. Synthetic monitoring offers a reliable and repeatable transaction emulation that eliminates the possibility of misbehaving end-user client devices (such as a desktop computer being slow) confusing the readings.
More importantly, when applications are accessed from diverse networks, synthetic monitoring can emulate calls from various geographic locations and provider networks and help you test the API’s performance across these multiple pathways. While synthetic tests provide scripted insights, utilizing real user monitoring (RUM) helps capture unscripted, real-world interactions. For instance, synthetic tests could reveal that an API performs optimally in North America but shows latency in Asia; RUM could validate this by showing user complaints or slower transaction times in the latter region. This blend gives you an all-encompassing internal and external view of your API’s performance, ensuring all your users experience consistent and optimal API performance regardless of where they connect globally.
User-centric monitoring: Beyond platform and browser variability
It is common to notice an API working seamlessly on a modern web browser but struggle on an older version or a less-common browser. As with modern versions, different platforms and browsers interpret and execute code differently. Some may have faster JavaScript engines, better caching mechanisms, or more efficient rendering pipelines.
Choose a tool that employs user-agent parsing to segregate metrics by browser and OS, which ultimately helps enrich your data pool. Look for features that allow you to segment metrics across varying dimensions for targeted optimization. Can you filter performance data by the amount of available memory on a user’s device? Can you distinguish between urban and rural user experiences? Such multi-dimensional analysis turns data into a more navigable structure, making it easier to locate that one performance issue that might be affecting a specific user segment. The chosen tool should also facilitate client-side real user monitoring (RUM) to capture metrics derived from actual end-user usage, like load time and transaction success rate by platform and browser type.
Navigating unseen delays: DNS, ISPs, and CDNs
Slow DNS lookups, delayed routes through ISPs, or unresponsive Content Delivery Networks (CDNs) introduce unexpected latency in your API responses. Consider tools that offer intelligent alerting to flag issues like DNS propagation delays or CDN cache misses. This should also include traceroute diagnostics that help visualize network bottlenecks at each hop.
Support for the OpenTelemetry open-source framework
While observability signals are foundational, instrumentation lays the groundwork to expose the system’s internal state through traces, metrics, and logs as telemetry data.
Incubated by the Cloud Native Computing Foundation (CNCF) in 2019 and graduated to full project status in 2021, OpenTelemetry is a unified observability framework to collect, generate, export, and store telemetry data. This data is then sent to an observability backend for further analysis. The OpenTelemetry toolkit serves two essential utilities in this regard:
- Data ownership: Liberates you from proprietary data formats or tools, giving you complete control over the generated telemetry data. This also eliminates the risk of vendor lock-ins or paying a premium for a proprietary observability solution, ultimately giving you the flexibility to choose and port to the best API monitoring tool suitable for your use case.
- Standardization & extensibility: Promotes a single set of APIs and conventions, simplifying the learning curve for teams. Whether you’re looking at traces, metrics, or logs, adhering to OpenTelemetry formats streamlines data ingestion into different observability tools without changing the underlying architecture.
In a typical OpenTelemetry setup, the instrumented application code generates spans and metrics via OpenTelemetry’s API. While spans are used to track the flow of requests through a distributed system, metrics are used to measure the performance of a system. Generated spans and metrics offer raw data that can be incredibly useful for measuring API performance, tracking requests, and understanding latency. But the power of the framework is not just in data generation.
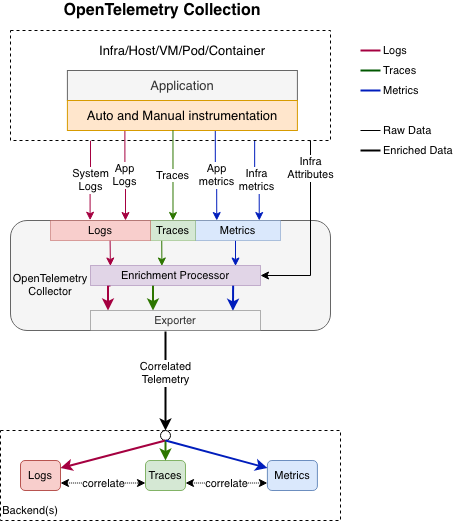
The OpenTelemetry SDK also applies sampling guidelines and routes the data through various processors. Sampling rules reduce the amount of data that is collected while processors transform and enrich the data before it is exported.
Once this data is exported to an observability backend, you can analyze it to monitor API health, track performance metrics, and set alerts for anomalies. The advantage is the possibility of a unified observability platform, where you can view, analyze, and correlate traces and metrics from various parts of a system, including APIs.
Support for service catalogs and API documentation
A service catalog typically offers a broader view that describes different services (including APIs) available, who can access them, and how they interact with other services. As you evaluate API monitoring tools, consider the compatibility and integration between your service catalog and the OpenAPI Specification (OAS). Assess how well they support API creation, management, and real-time modifications.
OpenAPI Specification (OAS) facilitates a dual-purpose blueprint for HTTP-based APIs that serve both developers and machines. This dual functionality extends beyond API documentation to actualize implementation logic, SDK creation, and testing through mock servers—all orchestrated from a single OpenAPI file. Adopting OpenAPI in your monitoring strategy offers the potential for auto-generating monitoring checks and explicit versioning from the OAS description file. This ensures even dark APIs – deprecated or older API versions – don’t go unmonitored.
Given that the OpenAPI file contains all the details about API endpoints and request/response structures, it essentially provides all the information a monitoring tool needs to verify API behavior. The tool auto-configures these checks based on your OpenAPI specifications, ensuring your APIs are always operating optimally within acceptable timeframes.
It’s important to select an API monitoring tool that can integrate with OpenAPI to avoid creating separate islands of catalog information that can diverge over time when missing a single source of truth.
Integrated with CI/CD pipelines
If your organization practices continuous delivery for releasing code to production, your API monitoring tool should be integrated with a continuous delivery platform such as Jenkins. A shift-left for monitoring approach enables the concurrent rollout of monitoring configurations during sprint planning. Shift-left ensures that the endpoints from new or updated APIs are immediately under surveillance, reducing the time window where issues could go unnoticed. Look out for the following features in your API monitoring tools.
Spot new APIs instantly
As soon as a new API is committed into the code repository and deployed via the CI/CD pipeline, the monitoring tool should be able to detect this change. If the API is designed using OpenAPI Specification (OAS), the tool can auto-configure its checks based on the provided OAS file.
Refresh on API changes
An application code is ever-evolving. Changes to API versions, the introduction of new endpoints, or alterations to existing ones should be relayed immediately to the monitoring tool via the CI/CD pipeline. This early visibility is crucial for immediate and accurate adjustments to monitoring configurations.
Auto-add new endpoints
Every time new endpoints are introduced or discovered through the CI/CD pipeline, they are automatically added to the monitoring tool for observability. This ensures all endpoints are inspected before going live, and you reduce any blind spots in your monitoring strategy.
Dashboard & alerts
Early integration also means early warnings. As part of the CI/CD integration, dashboards can be auto-updated to reflect the newly deployed or modified APIs. You should be able to automatically set up alerting rules based on predefined conditions, ensuring real-time notifications through webhooks for any anomalies.
The integration ethos essentially champions the concept of ‘monitoring as code’—a practice of concurrently establishing a robust, proactive API monitoring strategy as you write, test, and deploy your code.
Support for all types of API
In a microservices framework, your application will likely employ different API types—SOAP for legacy services, REST for web services, HTTP for foundational calls, and GraphQL for more tailored data needs. For each of such instances, manual instrumentation typically involves embedding monitoring logic for every API endpoint. This approach offers granular control, albeit at the cost of time and potential human inaccuracies.
An API monitoring service bundled as Software Development Kits (SDK) provides a more efficient path. When integrated with your tech stack, these pre-compiled libraries automatically inject the necessary monitoring logic into your codebase. Most SDKs today also come with out-of-the-box support for different API types and can auto-configure based on OAS. This automation reduces human errors and setup time and ensures consistency in monitoring configurations.
Tools supporting OpenTelemetry benefit from both manual and automatic instrumentation for various programming languages. The blended approach streamlines telemetry collection by offering APIs and SDKs for custom instrumenting applications. A typical configuration could range from defining environmental variables to language-specific system properties. These options collectively offer the flexibility to configure data sources, exporters, and resource utilization to enrich the telemetry data. Natively instrumented libraries can auto-invoke OpenTelemetry APIs, eliminating the need for custom coding.
For those that are not, OpenTelemetry provides language-specific Instrumentation Libraries to make telemetry integration universally accessible.
Support for microservices and serverless computing
In a modern API-first landscape, APIs no longer work in isolation. Instead, they’re part of a larger ecosystem of interdependent services, each with its own set of APIs. Enterprises should now focus on system-wide observability that matches this complexity.
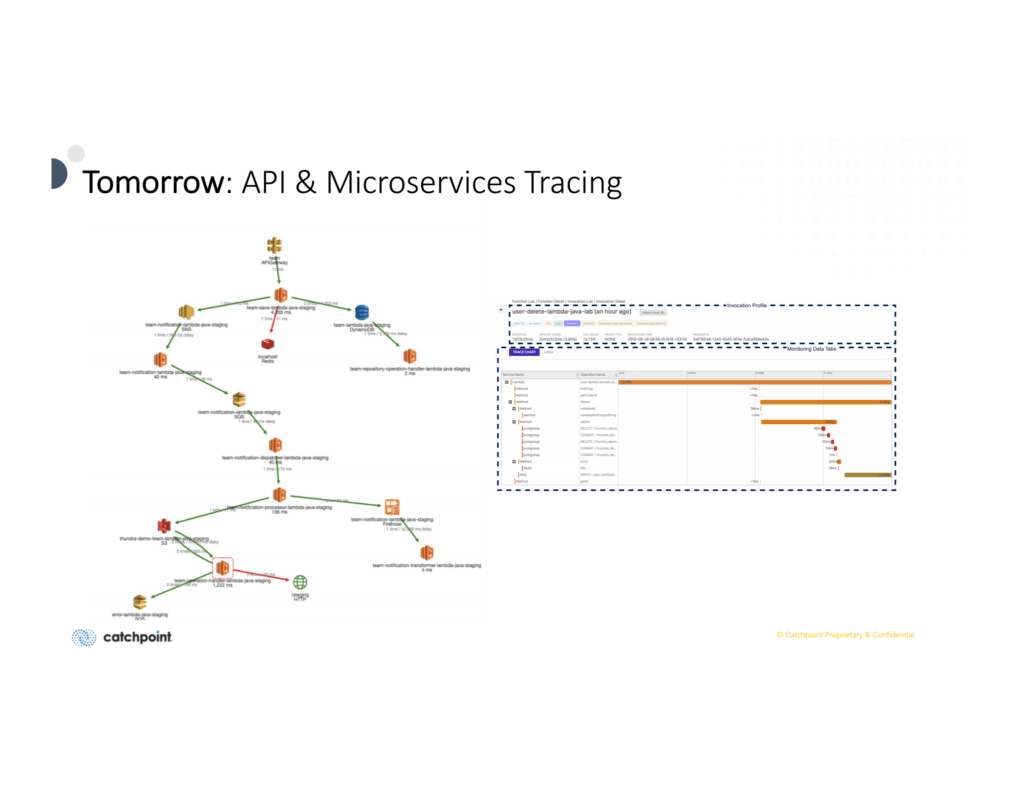
Take microservices, for example. These modular services communicate through REST APIs, each serving a discrete function but collectively contributing to a transaction. A single transaction could course through multiple such services, each with its own API. Additionally, microservices often interact through gRPC, a high-performance, open-source framework that allows for multiple types of communication. If your monitoring tool isn’t capable of tracing each call in such a framework, resolving issues becomes a monumental challenge.
Service meshes like Istio, Consul by Hashicorp, and Linkerd offer another layer of complexity. They control how different parts of an application share data and services, adding an abstraction layer for secure, reliable, and rapid communication between services. Not being able to monitor this layer adds another blind spot to your observability landscape.
And if you are leveraging a serverless architecture, note that the reliance on APIs to activate functions is foundational. For instance, AWS API Gateway serves as the channel between serverless functions like AWS Lambda and the broader system. This service goes beyond simple request routing, offering capabilities like traffic management and API composition.
Multi-level infrastructure monitoring
Some organizations may miscalculate the correlation between infrastructure observability and API monitoring. Focusing squarely on API endpoints, they often overlook the underlying layers of infrastructure that impact API performance.
As each abstraction layer comes with its own set of complexities and metrics, the challenge is to cross-reference data across these disparate layers for an integrated view. Using specialized tools capable of diagnosing issues spanning multiple levels of your infrastructure stack is crucial.
Consider a tool that provides an integrated view across various technology stack layers. Specialized tools capable of multi-level monitoring are essential for two reasons: they help diagnose issues across abstracted layers and offer a comprehensive snapshot of your API’s health.
Start with the servers hosting your API. Key metrics to focus on typically include CPU usage, JVM heap size, thread counts, and network latency. Any spikes here can directly affect your API’s responsiveness, leading to increased latency and reduced throughput.
The next layer involves databases and third-party services that your API interacts with. Query execution time, API response times, error rates, connection pooling, and caching mechanisms are critical metrics that can flag early warning signs of sluggish end-user experience.
Contrary to traditional monitoring approaches at the hypervisor and VM layer, containerized environments bring additional layers to the ecosystem. Ensure your selected tool monitors orchestration systems like Kubernetes. Metrics like pod statuses, resource quotas, and container health checks offer different layers of insight into API performance.
Conclusion
The true worth of an API monitoring tool goes beyond mere data gathering and offering insights you can act on. It should be flexible enough to adapt to varying API behaviors, capable of interpreting complex metrics, and integrate seamlessly with your DevOps pipelines.
Although advanced capabilities like multi-step tests, histograms, and centralized log aggregation add depth to your API monitoring, they aren’t guaranteed against every anomaly. This doesn’t undermine the importance of adopting those strategies, though.
When looking for for an observability solution, look for a framework that goes beyond basic metrics to run API transactions that test functionality, execute payloads, and parse for expected responses. Choose a platform that also monitors your mesh of API endpoints and integrates the API metrics with end-user experience metrics measured by synthetic and real-user monitoring (RUM) and correlates them with DNS and CDN performance metrics impacting the end-to-end transaction path. This adds another dimension to your API monitoring, shortening troubleshooting and offering proactive issue resolution.To know more about how LogicMonitor offers a holistic approach to API observability that goes beyond mere monitoring, explore LogicMonitor.
CHAPTERS
NEWSLETTER
Subscribe to our newsletter
Get the latest blogs, whitepapers, eGuides, and more straight into your inbox.
SHARE
Make API performance a competitive advantage.
See how full-stack observability connects API health to real user experience and eliminates blind spots across your stack.
FAQs
What features should I look for in an API monitoring tool?
Prioritize full-stack observability over basic uptime checks. Look for distributed tracing, synthetic and real-user monitoring, OpenTelemetry support, and CI/CD integration. The tool should monitor the full transaction path, including DNS, CDN, and third-party services — and integrate cleanly with your incident workflow. Depth of visibility matters more than long feature lists.
Is there a difference between API monitoring tools and APM tools?
Yes. APM tools focus on internal application behavior such as code-level tracing, database queries, and service-to-service calls. API monitoring focuses on the external contract — whether endpoints respond correctly, within expected latency, and with valid payloads. Modern observability platforms often combine both, but they address different layers of visibility.
How do I evaluate API monitoring tools for enterprise use?
Test each tool against your real worst-case scenario, not a demo environment. Validate how it handles your authentication methods (OAuth, API keys, mTLS), whether it supports your deployment model (Kubernetes, serverless, hybrid cloud), and how alerts integrate with your incident management workflow. Measure performance at your actual request volume, not marketing benchmarks.
Can open-source tools handle API monitoring effectively?
They can cover parts of the stack. Prometheus and Grafana handle metrics; Selenium or k6 can run synthetic tests. However, stitching these together requires operational overhead and ongoing maintenance. For teams without dedicated observability engineers, a unified platform typically delivers faster time-to-value and more reliable cross-layer correlation.

By Denton Chikura
Technical Writer

Denton Chikura is a technical writer and longtime observability advocate focused on helping site reliability engineers and engineering teams discover the tools and capabilities that strengthen internet resilience. He works at the intersection of monitoring, performance, and infrastructure to make complex systems more understandable and usable, bridging the gap between deep technical detail and real‑world operations. His goal is to help teams build faster, detect issues earlier, and recover smarter, ultimately making the internet a better, more reliable place for everyone.
Disclaimer: The views expressed on this blog are those of the author and do not necessarily reflect the views of LogicMonitor or its affiliates.
© LogicMonitor 2026 | All rights reserved. | All trademarks, trade names, service marks, and logos referenced herein belong to their respective companies.
