Autonomous IT Needs Internet Performance Monitoring: Why Internal Visibility Alone Is No Longer Enough
Modern incidents don’t stop at the firewall. Learn how internet performance monitoring helps IT teams see external dependencies, troubleshoot faster, and support Autonomous IT with more complete visibility.
Internal visibility isn’t enough for modern incident response.
Internal dashboards can look healthy while users are still affected, because many performance issues happen in external dependencies like DNS, ISPs, CDNs, network paths, and third-party APIs.
Internet performance monitoring closes that visibility gap by showing what happens between your systems and your users, helping teams identify whether the problem is internal, external, regional, or provider-related.
That external context helps teams troubleshoot faster, reduce time spent ruling out the wrong layers, and make incident response more accurate.
Recommendation: Trace one customer-facing service end to end and identify where your visibility stops. Any dependency outside that line of sight is a blind spot worth closing.
Your app team has three dashboards open and everything looks fine. CPU is healthy, memory is stable, the application servers are responding normally. But users are still complaining. The checkout page is slow. Logins are timing out. Support tickets are piling up. And your monitoring tools have nothing useful to say about why.
This is a frustrating situation in IT operations, and it’s more common than most teams want to admit. The problem isn’t with the servers you’re watching. It’s somewhere between the user and the application—in a DNS resolution that’s taking too long, an ISP route that’s degraded, a CDN edge node that’s struggling, or a third-party payment API that’s responding more slowly than it should. None of that shows up on the infrastructure dashboard, because none of it lives inside your firewall.
Internet performance monitoring extends visibility into the external delivery environment: the DNS providers, ISPs, CDN nodes, APIs, and network paths that sit between your systems and your users.
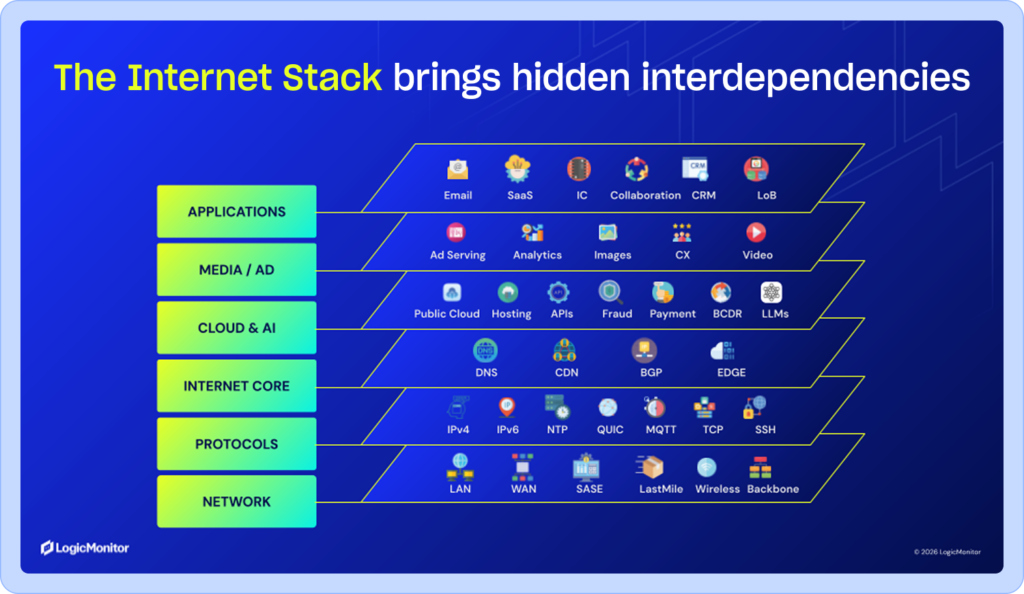
Modern digital services don’t run on internal infrastructure alone. A single user action can travel through a browser, a local network, an ISP, a DNS provider, a CDN, cloud edge services, the application itself, and one or more external APIs before anything comes back. Each of those layers is part of the real service delivery chain. Some of them you own. Most of them you don’t. But all of them affect what users actually experience.
This matters even more as organizations move toward Autonomous IT, the operating model where IT can detect issues, decide what to do next, take governed action, and verify results without humans manually driving every step. That kind of operating model depends on complete visibility. If the signals feeding it stop at the edge of owned infrastructure, the blind spots don’t disappear. They just don’t show up until users start noticing.
Internal monitoring shows one part of the service. Users experience the whole delivery chain.
As NIST SP 800-207 on Zero Trust Architecture notes, a significant portion of enterprise network traffic may be opaque to layer 3 network analysis tools, including traffic from non-enterprise-owned assets and services that resist passive monitoring. It’s a structural problem.
What is Internet Performance Monitoring, and why does it matter for Autonomous IT?
Internet performance monitoring is the practice of monitoring the internet-facing delivery ecosystem an application depends on—DNS, ISPs, CDN and cloud edge services, network paths, third-party APIs, and other external dependencies that shape what users actually experience. The scope is broader than most teams assume. The question is whether the full chain between a user and a working service is intact, including the parts you don’t own or control.
Autonomous IT is the operating model where IT can detect issues, decide what to do next, take governed action, and verify results without humans doing every step manually. Gartner describes autonomous systems as those that “sense what’s happening and independently make decisions without waiting for human instructions,” which is useful framing because it highlights how much signal quality matters.
Autonomous IT is a closed loop with guardrails. The goal is intelligent, governed action grounded in complete visibility and real-world context. NIST SP 800-137 on Information Security Continuous Monitoring is explicit that automated processes should operate within defined control and audit requirements, not without oversight.
The link between these two concepts is straightforward. Autonomous IT starts with complete visibility, because a system can’t respond intelligently to what it can’t see. Signals need to span infrastructure, cloud, network, edge, application, digital experience, and internet performance, not just the layers inside the firewall. If any part of that picture is missing, the system is making decisions with incomplete information.
It’s also worth being clear about what internet performance monitoring is not. Traditional network monitoring helps teams understand what’s connected and how it performs inside the environment. Application performance monitoring focuses on the application itself. Internet performance monitoring extends visibility into the external delivery path and the third-party dependencies users rely on to reach the service. These disciplines are complementary, not interchangeable. Each covers a different segment of the service-delivery chain, and the gaps between them are where real user experience problems tend to hide.
Why internal-only monitoring misses problems that affect real user experience
Internal dashboards can show healthy systems while users are still running into problems. Infrastructure looks stable. Application response times are within range. Support tickets say something else.
That disconnect happens because service delivery doesn’t stop at your environment. Users reach applications through DNS providers, ISPs, CDNs, cloud edge services, and third-party APIs. Those dependencies shape performance just as much as the systems you manage directly. Gartner’s definition of digital experience monitoring reflects that broader view, describing it as measuring the availability, performance, and quality of application experience for users, not just the condition of internal systems.
When one of those external dependencies slows down or fails, internal telemetry often won’t show the cause clearly. That makes incident response harder than it needs to be. Teams start where they have data: application servers, databases, load balancers, and backend services. Sometimes that leads to the answer. Sometimes the issue sits with a provider, a regional network path, or another dependency outside their line of sight.
That gap matters because incident response depends on understanding what happened, where it happened, and whether the fix actually worked. NIST’s incident handling guidance includes post-incident review as a core part of the process, with questions such as exactly what happened, what was done to intervene, and how well the intervention worked. If teams can’t see the external delivery path, those answers take longer to find.
Internet performance monitoring fills in that missing context. It extends visibility across the path between users and services, including DNS behavior, network latency, packet loss, regional reachability, and third-party dependency performance from the user side of the connection. That added context helps teams narrow the problem faster, route incidents to the right owners sooner, and verify recovery based on actual user experience, not just internal system health. Gartner’s DEM category criteria also emphasize external, front-end measurement and end-to-end visibility into requests and journeys.
That broader visibility also reflects how much risk now lives outside the systems teams manage directly. In Uptime Institute’s 2023 outages analysis, only 11% of respondents said public cloud services were resilient enough to run all mission-critical workloads, while 18% said public cloud was not resilient enough to run any of them. External dependencies are part of the service-delivery chain and need to be included in the monitoring strategy, too.
Use Case: Protecting Customer Login Flows in Financial Services
A financial services team saw a wave of login timeout complaints even though server, database, and application metrics were healthy. Delivery-path monitoring revealed DNS resolution spikes affecting users in two geographies, pointing to a provider-side issue instead of an application failure. That gave the team faster root-cause clarity for a customer-facing service where delays quickly erode trust.
Why Autonomous IT needs internet performance monitoring
Autonomous IT is a closed-loop operating model. The system detects signals, understands what’s affected, reasons through what to do next, takes governed action, and then verifies that the action actually worked. Each stage depends on the one before it, which means the quality of the data feeding into that loop determines how well the whole thing functions.
Internet performance monitoring matters here because it adds a category of evidence that internal telemetry alone can’t provide: what’s happening between the user and the service, across delivery paths and dependencies that sit outside the firewall.
At each stage, that visibility changes how the system operates.
Detection improves when the system can see internet-aware signals alongside infrastructure metrics, because some issues in external paths appear there earlier or more clearly than they do in internal telemetry alone.
Diagnosis gets sharper when delivery-path context is available, because teams can determine whether a problem is rooted in the application, a third-party dependency, a provider route, or a specific geography, rather than spending time ruling out layers they can’t see.
Decision-making gets more grounded when it’s informed by what users are actually experiencing, not just what internal systems report.
Verification becomes more credible when the system can confirm that performance improved for real users after an action was taken, not just that internal metric returned to baseline.
Research from the Institute for Defense Analyses (IDA) on autonomous decision-making quality makes this point in precise terms: assessing the quality of decisions made by autonomous systems requires visibility into the inner workings of the decision engines themselves, beyond black-box mission-level testing. It’s a practical constraint on how much trust organizations can reasonably place in automated workflows that operate on partial information.
Autonomous IT isn’t a synonym for unchecked automation. The point is to stop requiring humans to manually drive every step of a loop that’s grown too complex and too fast to manage that way. Organizations that equate autonomy with “let the system do whatever it wants” tend to hit a trust wall quickly. The ones that build autonomy incrementally, with clear policies and controls, tend to expand it more confidently over time.
For teams thinking about this journey, cleaner, more connected signals are where it starts. Before an organization can automate responses with confidence, it needs to link symptoms to service impact across both internal systems and the external dependencies users rely on. A gap in that picture means the system is reasoning from incomplete information, which makes governed action harder to trust and harder to validate. Extending visibility to include internet performance and delivery-path signals is a foundational step in building the kind of signal quality that makes autonomous operations credible rather than risky.
When digital experience depends on infrastructure and the internet together, the monitoring that supports Autonomous IT needs to reflect both.
Wrapping up
If user experience depends on DNS, APIs, SaaS platforms, providers, and network paths you don’t control, then monitoring only what sits inside your environment leaves gaps that matter. Not gaps in a theoretical sense—gaps that show up during real incidents, when your dashboards look fine, and users are still complaining.
A useful starting point is to pick one customer-facing service and trace it honestly. Map where the request goes from the moment a user initiates it to the moment they get a response. Which parts of that path does your monitoring actually cover? Where does your visibility stop? For most teams, the answer reveals dependencies on external DNS, third-party APIs, CDN layers, or ISP routes that sit completely outside what current tools can see. That exercise alone tends to clarify where the blind spots are.
Teams that have done this exercise consistently report the same thing: the map they draw looks different from what their monitoring actually covers. A SaaS company that went through this process found that four of the seven hops between a user initiating a login and the application responding involved dependencies:
a DNS provider
a CDN
an identity provider
a third-party fraud-detection API
All those dependencies sat entirely outside their existing visibility. None of those had ever appeared on an incident timeline because there had been no way to see them. Once those layers were in scope, two previously unexplained incidents from the prior quarter were retroactively traced to external causes.
Extending visibility beyond the firewall is a foundational requirement for making that model work reliably. When digital experience depends on infrastructure and the internet together, the monitoring that supports Autonomous IT needs to reflect both.
See where your monitoring stops and what users still experience.
Talk with our team about the blind spots in your current monitoring strategy and how to extend visibility across the external dependencies that shape real user experience.