When things break, your logs should help you fix issues, not pile on a compliance headache. But if there’s user-specific data in the mix, especially in industries like healthcare or finance, things get complicated fast.
The good news is that you can still get the visibility you need without compromising privacy. Let’s walk through how to handle Personally Identifiable Information (PII) and Protected Health Information (PHI) in LM Logs so your team can troubleshoot smarter and safely.
You don’t need to choose between visibility and compliance.
TL;DR

What Kind of Logs Are We Talking About?
Not all logs are equal when it comes to compliance risk.
LM Logs is built to help you troubleshoot metric-based alerts. It automatically aligns relevant logs with alert timelines so you can get to the root cause faster. That’s why the most valuable logs for LM Logs are:
- System logs
- OS logs
- Device and application logs
- Syslog data
These logs are typically used for performance monitoring and system diagnostics. For example, a system log might capture a configuration change right before an alert fired, giving you a clear trail to investigate. We’ve seen teams identify a misapplied patch or a service that restarted unexpectedly without needing to dig through unrelated user data. They rarely contain Personally Identifiable Information or Protected Health Information.
Where things get tricky is with custom application logs. These can contain user-specific data (like login info, transaction IDs, or even health or financial information) depending on what your dev teams choose to log.
How to Identify Personally Identifiable Information and Protected Health Information in Logs
These fall into a few categories:
| Direct Identifiers | Indirect Identifiers | Sensitive Personal Information |
| – Full name – Social Security number – Passport or driver’s license number – Email address (if tied to a specific individual) – Phone number | – Date of birth – Gender – Usernames or account IDs – IP addresses (in some contexts) – Biometric data | – Financial data (e.g., credit card or bank account numbers) – Health records or insurance data – Racial, ethnic, or sexual orientation data |
The compliance risk increases when logs contain more than one of these fields in a way that makes an individual identifiable (this is called “linkability”). A single username might not be a problem. A username + email + credit card? That’s a risk.
Best Practices for Managing PII and PHI in LM Logs
1. Avoid logging sensitive data in the first place
If it’s not in the logs, it can’t be exposed. Train dev teams to:
- Use unique, non-identifying codes like session or transaction IDs
- Avoid logging names, emails, or account numbers unless absolutely necessary
- Challenge the need for user-specific data in any log stream
2. Sanitize data before ingestion
Use Fluentd, Fluent Bit, or Logstash with LogicMonitor-supported plugins. These tools let you:
- Drop sensitive log lines.
- Fluentd: Use fluent-plugin-grep to filter out entries with sensitive keywords.
- Fluent Bit: Use the built-in Grep Filter to include or exclude records based on pattern matching.
For example, a log line contains a keyword like “password” that should never be ingested.
Before (raw log):
2024-05-10 12:03:45 Login failed for user admin. Reason: Incorrect passwordAfter (dropped): Log line is not ingested or forwarded due to matching a sensitive keyword filter.
- Mask or hash sensitive fields.
- Fluentd: Use fluent-plugin-record-reformer to hash or redact sensitive values like email addresses or credit card numbers.
- Fluent Bit: Use the Modify Filter with the REPLACE or REMOVE_KEY operations, or the Lua Filter to script custom redaction or transformation logic.
An example of this is an email and credit card number that needs to be redacted or partially masked.
Before (raw log):
{

  "user": "[email protected]",

  "credit_card": "4111111111111111",

  "action": "purchase"

}
After (masked/redacted):
{

  "user": "jane.doe@####",

  "credit_card": "************1111",

  "action": "purchase"

}- Anonymize IPs and user IDs:
- Fluentd: Use fluent-plugin-anonymizer to transform identifiable fields with safe placeholders.
- Fluent Bit: Use the Lua Filter to write a function that anonymizes fields such as IP addresses or user IDs before forwarding.
For example, an IP address and user ID should be anonymized for privacy compliance.
Before (raw log):
{

  "ip": "192.168.1.102",

  "user_id": "user-123456",

  "status": "success"

}
After (anonymized):
{

  "ip": "192.168.1.xxx",

  "user_id": "user-xxxxxx",

  "status": "success"

}
And if you don’t already have log processing capabilities in place, we recommend starting with Fluent Bit. It’s powerful, flexible, and LM-supported.
3. Segment logs by sensitivity
If sensitive data must be logged:
- Use a dedicated log level (e.g., debug_secure) or separate log files
- Limit ingestion of those logs into LM Logs
- Tag and document them clearly for downstream filtering
4. Apply role-based access control (RBAC)
LogicMonitor lets you restrict log visibility:
- Use RBAC to limit access to sensitive logs
- Only grant permissions to those who truly need it
- Align access rules with your internal data-handling policies
5. Set log retention policies
Sensitive logs should have shorter lifespans:
- Follow the principle of least privilege and least retention
- Retain logs with sensitive data only as long as needed to resolve issues
- LM Logs supports retention tiers of 7 days, 1 month, 90 days, and 1 year
- Pro tip: Most teams retain sensitive application logs for 7 days or less
When a log is ingested into LM Logs, three important things happen:
- It’s tagged with its retention length. This depends on your subscription tier and helps control how long the data stays in the platform.
- It’s stored securely. Logs live in encrypted S3 buckets with at-rest encryption to protect your data.
- It’s automatically deleted. Once the log hits its expiration timestamp, it’s wiped, and no manual cleanup is needed.
This process helps ensure your log data is managed responsibly from the moment it enters the system.
Secure your log ingestion pipeline
Make sure your ingestion process is locked down:
- Use in-transit TLS encryption
- Ingest logs via LM’s secure API with a unique API key, Fluent-Bit
- Configure Fluentd or Logstash to transmit sanitized logs only
7. Track user actions with audit logs
LM Logs integrates with LogicMonitor Audit Logs, which:
- Tracks log configuration changes
- Records who accessed what and when
- Provides visibility into alert updates, login attempts, and more
These logs are tamper-proof and system-level only, so individual entries can’t be altered post-creation.
LM Logs: Designed for Visibility, Built for Trust
LM Logs isn’t a SIEM, and that’s by design. It’s not built for threat detection or forensic analysis. Instead, LM Logs focuses on helping your IT team find and fix problems faster by aligning logs with alerts in a way that saves time, reduces MTTR, and eliminates finger-pointing.
By following these best practices, you can get the full value of LM Logs without putting your organization’s data or compliance posture at risk.
Need help setting this up? Reach out to your LogicMonitor customer success team. We’re here to help you design a logging strategy that’s powerful, practical, and privacy-aware.
AIOps is overdue for reinvention. The last decade promised faster resolution and smarter alerts—but most tools are still built on outdated assumptions: linear workflows and deterministic rules.
Now, a new model is emerging. Not reactive. Not rule-based. Agentic.
Agentic AIOps is about taking action. Products like LogicMonitor’s Edwin AI go beyond recommendations—they correlate, decide, and remediate in real time.
Yet major voices reflect the industry’s lag, still framing AIOps maturity around deterministic automation and tool consolidation. These voices treat checklist functionality as innovation, and overlook what actually matters: whether a system can reason, act, and evolve. That’s a view rooted in outdated assumptions and legacy thinking.
Where others measure breadth, Agentic AIOps is defined by architecture. It moves beyond consolidation to enable real-time coordination, using modular, task-specific agents that adapt and learn from every outcome.
Here are five shifts that define Agentic AIOps and explain why legacy systems can’t fake it:
- Embedded Intelligence: Autonomy is built into the system’s core architecture.
- Modular Agents: Lightweight, task-specific agents replace heavyweight, monolithic AIOps platforms.
- Workflow-Level Integration: Insights trigger actions directly inside existing products.
- Operational Autonomy: These systems remediate, escalate, and learn from every outcome to improve next time.
- Natural Interaction: Users interact conversationally and start with context, not a blank slate.
Let’s look at why agentic AIOps is the architecture that finally delivers on the promises AIOps has made for years.
1. Designed to alert → Built for autonomy
Point: Faster, more accurate decisions without human lag.
Legacy AIOps platforms were never designed to act. Most of these older AIOps tools still assume a human will read the alert, interpret the context, and decide what to do next. They weren’t built for autonomy; they were built to send notification, after notification, after notification.
Even when these platforms integrate machine learning, it’s often layered onto a foundation of static workflows and deterministic logic. Models may detect issues faster, but resolution still relies on people interpreting and responding.
That’s the core of the issue. The industry definition of AIOps still revolves around reactive processes—spotting patterns, surfacing trends, consolidating dashboards. Useful, yes. But fundamentally passive.
Agentic AIOps changes the operating model. Instead of systems that point at problems, we now have products that solve them. These systems are architected from the ground up to reason, decide, and act autonomously through purpose-built AI agents. The intelligence is embedded in the data model, the processing pipeline, and the action layer.
LogicMonitor’s Edwin AI reflects this model. It handles the tedious, repetitive tasks, like sorting noise from real issues, so teams can focus on work that actually requires human judgment.
2. Monolithic, Legacy AIOps Platforms → Modular Agents
Point: Adaptability across environments and rapid deployment of new use cases.
Legacy AIOps tend to scale by stacking on more features, more integrations, and more complexity—resulting in solutions that are harder to use, slower to adapt, and costly to manage. The bigger they get, the harder they are to change.
Agentic AIOps takes a different approach. It’s modular by design: a network of specialized AI agents that collaborate, adapt, and evolve independently.
Need root cause analysis? There’s an agent for that. Need to correlate alerts across hybrid environments? Another agent takes the lead. Each one is optimized for its task, and all are designed to work together—without requiring a full platform overhaul just to add new capabilities.
Edwin AI applies this principle with a modular, agentic architecture—where task-specific agents like correlation, summarization, and RCA work in tandem, orchestrated dynamically to deliver fast, scalable, and autonomous outcomes across complex environments.
3. Basic Tool Consolidation → Complete Workflow Integration
Point: Less friction, fewer errors, more time spent resolving not routing.
Too many AIOps tools still rely on manual workflows: surface an alert, escalate to a ticket, and wait for someone to interpret what’s going on. And while these same tools also promise consolidation in form of fewer dashboards, tighter integrations, a single pane of glass—merging tools isn’t the same as making them work in sync.
Without coordination, you still get a fragmented experience: alerts surface in one place, tickets open in another, and humans are stuck translating insights into action.
A solution that generates insights but can’t act on them forces humans to play middleman. This increases delay and error, especially when teams are already stretched thin.
Agentic AIOps products don’t need translation layers. They operate within the same systems used to manage incidents, tickets, and services. Intelligent coordination shows up inside the workflow itself.
Edwin AI can integrate seamlessly with your stack so that resolution begins where your teams already work. Edwin drives intent across systems. Its agents operate directly within the workflows teams already use, triggering the right action, in the right place, at the right time. It populates incidents with context, kicks off triage, and gets resolution underway.
4. Alerting → Action
Point: Lower MTTR, reduced burnout, measurable ROI.
AIOps has traditionally been focused on identifying problems, after significant training in an organization’s environment. But, even leaving aside the slow time-to-value, knowing something’s wrong isn’t enough; it’s what happens next that matters.
Agentic AIOps takes the next step. They are pre-trained with contextual understanding and then further enrich and contextualize data, prioritize what matters, and take informed action—whether that’s triggering a workflow, escalating a ticket, or resolving an issue outright. And they don’t just act once. They learn from every incident to improve the next response.
Edwin AI is leading the way in agentic AIOps. Its agents handle triage, root cause analysis, and workflow automation in real time—compressing MTTR, reducing operational overhead, and accelerating time-to-resolution. The result is fewer escalations, tighter SLAs, and measurable ROI. Not in theory; in production at customers like The Capital Group and Devoteam.
5. Manual Effort → Natural Interaction
Point: Higher adoption, less training, better experience.
When AI is truly embedded, you don’t have to think about it—it just works. It’s not a separate feature or a flashy add-on. It’s part of the system’s fabric, enhancing decisions, accelerating workflows, and quietly driving better outcomes.
Agentic AIOps enables natural interaction: users ask questions or take action in plain language. They don’t start from scratch; they start with context, correlations, and recommended next steps already surfaced. That means faster investigation, less guesswork, and a shorter path to resolution.
With Edwin AI, every user operates with the advantage of a senior engineer. It supports upskilling, accelerates onboarding, and frees teams to focus on strategy. No dashboards to babysit. No training cycles to maintain. Just faster resolution, cleaner insights, and lower cognitive load.
Don’t Buy the Past. Build for What’s Next with Agentic AIOps.
Today’s AIOps market is saturated with platforms that check the right boxes—alerting, automation, orchestration—but miss the point. Most were architected for an era when AI’s role was to assist, not act alongside. They still rely on deterministic logic, static workflows, and manual interpretation. Adding smarter algorithms on top doesn’t change the underlying constraints.
What IT leaders need now isn’t more alerts or broader consolidation. They need intelligent coordination. They need systems that take action. Systems that adapt, reason, and improve. And that’s what Agentic AIOps delivers.
Edwin AI wasn’t built to modernize legacy workflows. It was built to move beyond them. Its modular, agentic architecture embeds decision-making at the core—so your operations don’t just scale, they evolve. Intelligent agents collaborate across systems, apply context in real time, and resolve issues without human bottlenecks.
This is to say that AIOps is changing form. And the architectural choices you make today will either lock you into yesterday’s limitations or position you to lead tomorrow’s operations.
If you’re investing in AIOps, don’t settle for platforms designed to keep up. Choose one built to move ahead.
For large-scale IT organizations, SNMP traps and log alerts are critical, but they can also be a hidden source of technical debt. Over time, alerting systems balloon with noise like redundant conditions, alerts from decommissioned tools, and logic that no longer maps to today’s hybrid infrastructure.
One LogicMonitor customer, a global enterprise managing over 5,000 devices, found themselves here: more than 1,600 SNMP trap and log alert conditions in their production environment, many of which had long outlived their purpose.
Instead of dragging that noise into a new platform, they used the migration to LogicMonitor Envision as a moment to reset, simplify, and modernize.
Don’t bring the noise. Bring the signal.
TL;DR
The Problem: Decades of Alert Bloat
This enterprise relied on an SNMP trap and log monitoring setup, which quietly accumulated a massive number of alert conditions over time. The signs of trouble were familiar:
- Rules tied to legacy systems that had been sunset years ago
- Conditions that had never once triggered due to misconfigured thresholds
- Alerts that lacked context or actionable insights
- A growing burden on engineers to maintain and sort through the noise
Each of these 1,600+ alert rules would require manual onboarding into LM Envision—taking 1 to 2 minutes per rule. That’s up to 53 hours of migration time to replicate outdated logic that no longer served their business.
They made a strategic decision: optimize first, then migrate.
he Strategy: Clean House Before You Move
We encourage teams to use migration as a clean-slate opportunity. So, guided by our alerting cleanup best practices, the IT team began a rule-by-rule audit using four key criteria:
- How often does this rule trigger?
- Is it tied to a decommissioned tool or system?
- Is the condition still relevant to today’s environment?
- Can it be merged, simplified, or deprecated?
Armed with these questions, they built a comprehensive inventory of all trap and log alert rules. This effort uncovered dozens of legacy configurations, including traps linked to tools that had been retired and thresholds set for infrastructure that no longer existed.
They also identified opportunities to consolidate similar alerting rules and fine-tune log thresholds based on real-time system behavior, ensuring that only the most relevant conditions were carried forward.
The Technology: LogicMonitor Logs + Traps for Real-Time Correlation
By using LM Logs for syslog and its capability to convert SNMP traps into log data, the IT team gained unified visibility into system behavior across the environment. This enabled them to:
- Correlate traps as logs along with traditional log data and infrastructure metrics/alerts for faster root cause identification
- Eliminate low-value alerts and redundant conditions
- Fine-tune alert logic to reflect current infrastructure and system behavior
- Use AI/ML features like log anomaly detection, log patterns, and log analysis to troubleshoot alerts faster and reduce MTTR
Using LM Logs’ query language, log anomaly detection, and role-based access controls, they could refine and govern alert configurations in ways their previous platform didn’t support.
The outcome was a complete uplift of their monitoring posture, enabling true hybrid observability powered by AI.
The Results: Fewer Alerts, Faster Time to Value
After their cleanup and migration effort, the organization achieved:
- 80% reduction in SNMP trap and log alerting conditions
- Elimination of alerts tied to obsolete tools and retired infrastructure
- 26 hours saved in onboarding time by skipping unnecessary rule configuration
- Enhanced visibility with LM Logs for better signal detection and troubleshooting
- Improved downstream integrations, including ServiceNow, thanks to a cleaner, more focused alert set
Just as importantly, their alerting setup now aligns with current infrastructure and scales cleanly as their environment evolves.
Every Migration Is a Strategic Moment
Too often, IT teams approach migration with a “lift and shift” mindset, missing the opportunity to avoid alert fatigue by eliminating legacy rules and surfacing only actionable insights.
This success story shows what’s possible when migration becomes a moment of optimization, not duplication.
With LogicMonitor’s integrated approach to traps, logs, metrics, and automation, you don’t just reduce alert noise. You enable your team to act faster, reduce MTTR, and prevent issues before they escalate.
On February 7, 2025, SolarWinds announced that they will be acquired by Turn/River for $4.4 billion and go private as soon as Q2 2025. This development has left customers questioning what’s next. Acquisitions often promise innovation, but Turn/River’s track record with similar purchases, like Paessler PRTG, has raised concerns. Following that acquisition, customers experienced significant price increases, with some reporting jumps from $4,800 to $14,000 annually, or increases of 330% after discounts.
The acquisition raises several critical concerns, including:
- Potential price hikes: Turn/River has previously implemented aggressive pricing increases on acquired companies, as mentioned above
- Product stability and innovation risks: Uncertainties about whether SolarWinds will continue evolving its products or if budget cuts will slow development
- Reduced transparency: Going private may limit visibility into the company’s roadmap and strategy
- Customer support challenges: Customer support may decline post-acquisition, with longer response times, reduced service quality, and unclear issue resolution
- Security and compliance concerns: SolarWinds’ history of vulnerabilities has prompted many customers to reassess their trust in the platform
As a result, businesses that require a more proactive and tailored approach to IT monitoring are re-evaluating their tools and looking for alternatives. Enter LogicMonitor, a cloud-native monitoring platform designed to scale with today’s IT infrastructure needs.
If you’re exploring alternatives to SolarWinds or considering a change, here’s why many former SolarWinds customers are happy with their decision to switch to LogicMonitor.
Why IT Teams Are Evaluating SolarWinds Alternatives
Diving deeper into SolarWinds’ history, there have been several challenges over the years that have made IT professionals reconsider their options.
Security Concerns
The 2020 SolarWinds breach exposed vulnerabilities that still make customers uneasy. The LogicMonitor Envision platform provides enterprise-grade security with the latest security certifications, robust role-based access controls (RBAC), encryption, and multi-factor authentication.
Additionally, security best practices are built into every layer of the LogicMonitor experience, from our technical architecture to our everyday business operations. We have undergone multiple third-party audits of its information security program to meet the exceptionally high standards defined by the International Standards Organization (ISO) and are ISO 27001:2013 certified, ISO-27017:2015 certified, and ISO/IEC 27018:2019 certified for the protection of Personally Identifiable Information (PII). LogicMonitor processes around service infrastructure, software, people, procedures, and data handling are compliant with SSAE 18 criteria, and the company maintains a SOC 2 Type 2 report as certification.
Get more information on our security protocols.
Complex Deployment and Maintenance
SolarWinds requires significant setup time and dedicated resources, with customers reporting months-long configuration processes. Many customers share that they need to hire contractors just to maintain their SolarWinds portal, resulting in inefficient and costly operations. The platform’s modular approach makes upgrades particularly challenging, requiring extensive manual discovery and configuration, and specialized SWQL knowledge. In contrast, LM Envision offers fast deployment and minimal maintenance with lightweight collectors that automatically discover, map, and set baselines for your infrastructure in minutes, no matter how complex.
Fragmented Monitoring Experiences
SolarWinds lacks a single unified view as it’s composed of multiple products, often acquired rather than developed internally. This disjointed approach forces customers to switch between products and contexts, with no single pane of glass for comprehensive visibility. Many organizations end up purchasing additional tools to fill the gaps, leading to tool sprawl and the absence of a single source of truth. LogicMonitor’s platform-based approach provides an integrated, contextual, full-stack monitoring experience through one interface for your entire IT ecosystem.
Limited AI Capabilities and High False Positives
According to a current SolarWinds customer, SolarWinds’ Machine Learning model requires extensive training, taking six to nine months to learn what is an anomaly or a deviation and what is normal, while producing high false positives during that time period. This delay in value realization contrasts with LogicMonitor’s Edwin AI, which comes pre-trained and delivers value from day one. Event Intelligence and GenAI Agent reduce alert noise by 90%, reduce MTTR by 60%, and save companies two hours per incident with AI-powered summaries, root cause analysis, actionable recommendations, predictive insights, and conversational step-by-step guidance from an AI assistant.
See how Edwin AI delivers value
Scalability Issues
Many IT teams find that SolarWinds struggles with large-scale monitoring needs, especially beyond 20,000 devices/nodes and faces challenges with log handling and event downloading. LogicMonitor’s cloud-native architecture seamlessly monitors tens of thousands of devices using lightweight collectors and automated discovery, providing fast implementation and easy access to data and remote devices.
Limited Modern Technology Support
SolarWinds has fallen behind in supporting today’s hybrid cloud environments, with minimal support for AI workload monitoring, NVIDIA GPUs, and limited capabilities for cloud, log, and container monitoring. LogicMonitor offers powerful integrations with the latest hybrid cloud offerings, comprehensive support for AI workloads, NVIDIA GPUs, logs, and container monitoring without Prometheus dependence.
Hidden Costs and Pricing Issues
Some SolarWinds customers have experienced unexpected pricing changes, particularly when adding integrations or upgrading features. LogicMonitor provides transparent, predictable pricing and is TermScout certified for contract transparency and trustworthiness.
These challenges have pushed organizations to reassess their IT monitoring solutions, turning to LogicMonitor for a more modern, scalable alternative that keeps them ahead of the curve.
How LogicMonitor Compares to SolarWinds
To empower IT leaders with the insights they need, here’s how LogicMonitor stacks up against SolarWinds:
| LogicMonitor | SolarWinds |
|---|---|
| Fast, easy deployment, and simple setup in as little as one week with LogicMonitor’s SaaS-based platform, lightweight collectors, and autodiscovery. | Different code bases for Self-Hosted and SaaS solutions with no formal migration path between them. |
| No advanced training is required. Pre-built dashboards, pre-configured thresholds and automatic discovery to onboard new devices. | Requires extensive manual configuration and specialized SWQL knowledge for effective use. |
| MSP-friendly with unified visibility across multiple accounts, customizable dashboards for customers, and user-friendly reporting. Cost Optimization lets MSPs control resource consumption and Service Level Insights help MSPs deliver value-added services. One MSP reports 25% faster customer onboarding compared to SolarWinds. | Limited MSP capabilities without unified multi-account visibility. MSPs spend significant time building custom templates for technology that cannot be monitored out-of-the-box. |
| Platform-based with integrated, contextual, full-stack monitoring through a single pane of glass and consistent GUI. Powerful analytics including advanced reporting and visualization for rapid issue identification. | Multiple disconnected products without a cohesive unified experience, requiring users to switch contexts frequently. |
| Robust cloud and database cost optimization with AI recommendations, multi-cloud billing view, and deeper insights. Features include customizable dashboard widgets, enhanced AWS EC2 memory recommendations, and the ability to review and execute changes directly in cloud portals. | Basic cost reporting without AI recommendations or multi-cloud billing view. More clicks and manual effort required to compare costs and optimize compute. |
| Modern container monitoring with intuitive UX: easy deployment & remote monitoring without Prometheus dependence. Agentless discovery for Amazon EKS and Azure AKS. | Depends heavily on Prometheus-style endpoints for metric collection, creating high overhead and TCO. No Amazon EKS & Azure AKS support. |
| Edwin AI delivers value immediately with pre-trained models, providing insights within hours of deployment. | AI/ML models require up to 9 months of training before reliable operation. |
| Comprehensive AI capabilities throughout the platform: Event Intelligence & GenAI Agent, Anomaly detection, Cost Optimization, Dynamic thresholds, Forecasting, AI-powered Log analysis, Log Metricization, and Resource Explorer. | Limited legacy ML features, mostly available only in SolarWinds SaaS, not Self-Hosted. |
| AI-powered Log Anomaly detection and Log Analysis with logs metricization & SNMP traps as logs for comprehensive insights. | Metric-based Anomaly detection only. |
| Responsive, knowledgeable technical support with high customer satisfaction. | Support is often described as slow or unresponsive with limited technical platform understanding. |
| TermScout certified for contract transparency and trustworthiness. | No third-party contract certification. |
When IT teams need a future-ready monitoring solution, LogicMonitor offers a complete platform with all of the features and capabilities they need.
Real-World Success: Why Companies Are Making the Switch
Many IT teams have already transitioned from SolarWinds to LogicMonitor. Here’s what they’re saying:
- Hilltop Holdings: “LogicMonitor’s interface is FAST. Coming from SolarWinds, it was shocking how fast LM could fetch and present data even when compared to an on prem alternative.” – Cody Clements, Manager of Operational Services
- MoneyGram International, Inc: “To be clear – we were a SolarWinds Shop prior – which did work very well until they had their vulnerabilities. But LogicMonitor is bringing more visibility to my Network and Telecom inventory, and making it easier to monitor and take action on alerts as well as trending metrics.” – Dan Olson, Network Manager
- Prairie View A&M University: “I can finally get a good night’s rest. LogicMonitor has been my replacement for Solarwinds. It’s more advanced than my previous solution.” -Jay Ellis, Director, Infrastructure Services, Prairie View A&M University
For the full story, check out these case studies:
- Henrico County, Virginia’s IT department reduced alert noise by 90% with LogicMonitor after switching from SolarWinds
- “For me, it’s no extraneous alerts. That’s the biggest thing, getting the alerts down to only stuff that’s actionable is fantastic. You can’t ask for anything better than that. In addition […], the various DataSources like the EIGRP neighbors? You know that’s just something SolarWinds didn’t do.” – Robert Aungst, Network Infrastructure Manager
- Coca Cola Bottling Consolidated saved 30 min per incident after switching from SolarWinds
- Coca-Cola Bottling Consolidated boosted efficiency and customer satisfaction with LogicMonitor. After adopting LogicMonitor, Coca Cola Bottling IT team streamlined operations, reduced downtime and enhanced network visibility, ensuring smooth delivery of products to millions of customers across 14 states.
- Ohio Public Employees Retirement System (OPERS) moved to LogicMonitor and gained much-needed visibility compared to their old solution, SolarWinds:
- After migrating from SolarWinds to LogicMonitor, the OPERS IT team gained increased visibility and deeper insights into their infrastructure health. LogicMonitor’s custom dashboards and graphs helped the team draft a SDT policy and schedule that no longer causes lags across the business. The success of the cross collaboration between the teams has also benefited the internal customer groups, as the Data Engineering team can now provide solid data justifying their decision-making, allowing their strategy and success to be viewed across the entire organization.
The Migration Process: How Easy Is It To Switch?
IT leaders often worry about the challenges of switching platforms, but LogicMonitor provides a smooth transition with easy integration into existing IT infrastructure without downtime. Customers benefit from dedicated onboarding and hands-on support to ensure a hassle-free migration. With transparent pricing, no unexpected fees, and a lower total cost of ownership, LogicMonitor also delivers cost savings.
For many IT teams, switching from SolarWinds to LogicMonitor is about taking a proactive approach to IT operations. Rather than wait for potential price hikes, product slowdowns, or reduced support, teams are choosing a platform that decreases manual workloads, improves system reliability, and future-proofs their infrastructure.
Is It Time To Move On?
With SolarWinds entering a new phase, IT teams are evaluating their options and looking for a more secure, scalable, and cost-effective monitoring solution.
If your organization is concerned about the SolarWinds acquisition, now is the perfect time to explore LogicMonitor as a modern alternative.
IT Operations are more complex than ever, with modern data centers spanning on-premises, containers, multi-cloud environments, and AI-powered infrastructure. The rapid expansion of data sources has created an overwhelming volume of information, making manual monitoring across multiple tools impractical. Visibility gaps slow down troubleshooting and delay critical decisions, impacting business performance.
LogicMonitor’s latest innovations give IT teams the solutions they need to modernize their data center observability strategies and meet their business goals in the AI Era with expanded hybrid resource visibility, embedded troubleshooting workflows, and AI-driven insights. With reduced MTTR, cost savings, and greater efficiency, IT can enhance customer satisfaction, accelerate transformation, and rapidly implement AI initiatives.
Expanding Best-in-Class Hybrid Observability
LogicMonitor delivers comprehensive visibility across on-premises infrastructure and multi-cloud environments, providing IT teams with a unified approach to monitoring modern data centers.
Our latest hybrid visibility enhancements—rolling out in the coming months—enable deeper insight into how AI services, cloud costs, container visibility, and network monitoring interact. With this expanded coverage, IT teams can pinpoint inefficiencies, optimize system performance, and eliminate operational blind spots before they create problems.
Expanded Monitoring for AI Services
As AI adoption accelerates, IT teams require observability that can keep pace. LogicMonitor has expanded AI monitoring coverage to include Amazon Q Business and NVIDIA GPUs, complementing existing monitoring for Amazon Bedrock, Amazon SageMaker, and Microsoft Cognitive Services.
Monitoring Amazon Q Business provides IT and CloudOps teams with real-time visibility into AI-driven internal processes. By integrating directly with enterprise data sources, Amazon Q Business enables fast, secure information retrieval via a natural language chatbot. Ensuring these AI tools remain available and performant supports efficiency across business operations.
NVIDIA GPU monitoring extends visibility into AI infrastructure, tracking real-time performance, utilization, and hardware health. IT teams can proactively detect issues before they affect AI workloads, reducing downtime and improving model performance.
Enhanced Cost Optimization for AI-Driven Workloads
Since launching Cost Optimization in May 2024, LogicMonitor has helped IT teams integrate FinOps best practices, balancing cloud performance with operational costs. AI workloads demand significant computing power, making cost control even more essential.
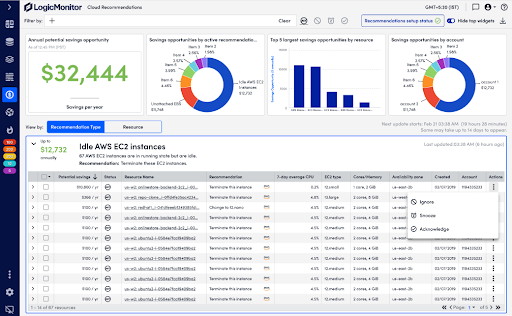
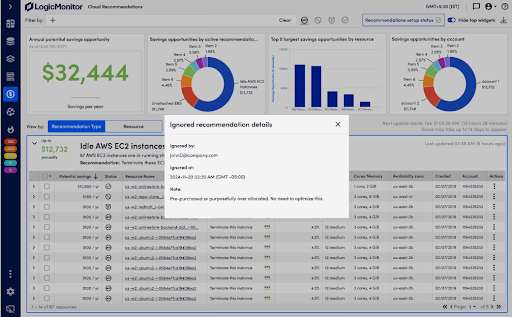
With new enhancements, teams gain deeper visibility into multi-cloud expenditures and can now view performance and cost data alongside AI-generated cost recommendations in a single view, so they can make informed decisions quickly, while AWS EC2 memory insights provide precise instance-sizing guidance for compute-intensive tasks. New tracking options allow users to manage cost recommendations more effectively by acknowledging, snoozing, or dismissing them based on relevance. Teams can also add notes to recommendations, improving collaboration and tracking decision rationale.
Optimize costs without compromising performance
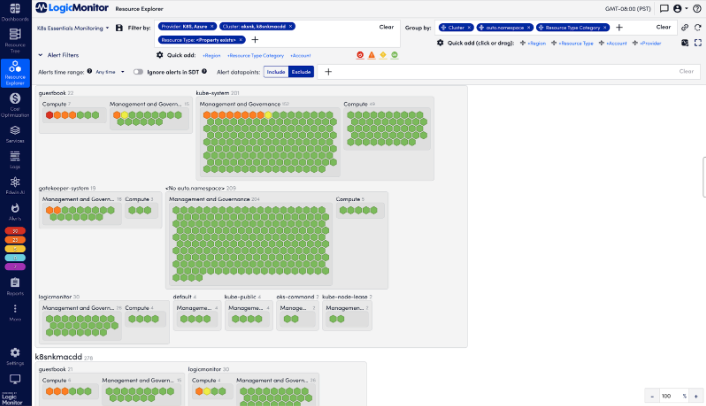
Simplifying Kubernetes Observability
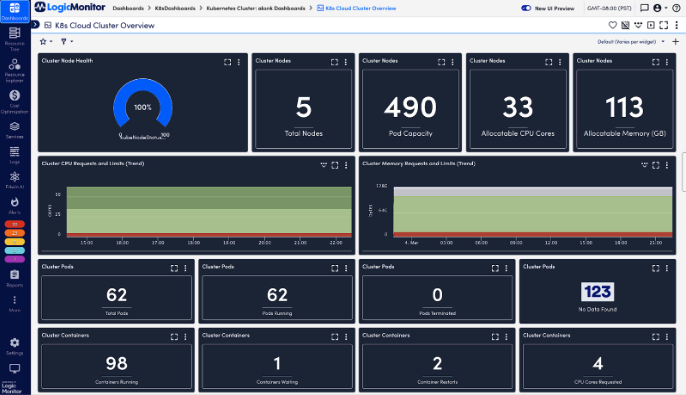
Kubernetes environments are dynamic, spanning hybrid cloud architectures and scaling rapidly. Maintaining real-time visibility into cluster health, resource usage, and performance anomalies has been a persistent challenge for IT teams.
LogicMonitor now includes automated discovery and monitoring for Amazon EKS and Azure AKS clusters, simplifying Kubernetes observability. These enhancements allow IT teams to track real-time changes, detect anomalies, and resolve issues before they disrupt performance. Logs and alerts are embedded within the monitoring environment, streamlining troubleshooting and reducing time spent diagnosing problems.
Monitor containers with confidence and scale
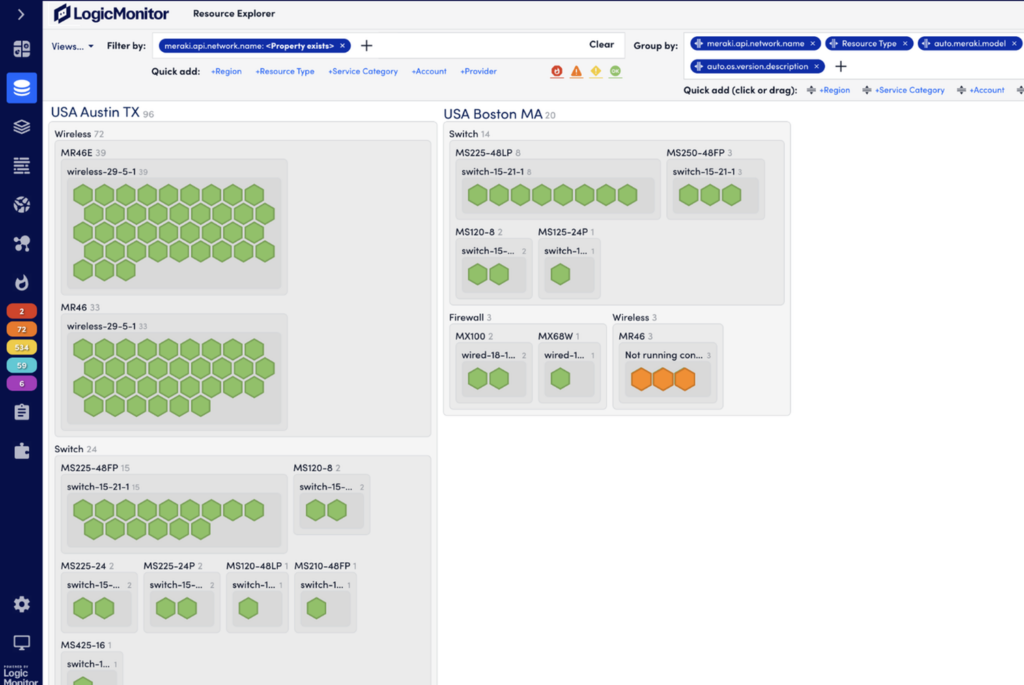
Advancing Network Monitoring for Cloud-Managed Devices
As network device manufacturers move management to the cloud, IT teams need observability solutions that support hybrid network environments. LogicMonitor has expanded monitoring capabilities to include Cisco Meraki and HPE Aruba Networking, ensuring IT teams can track performance across multi-vendor network environments.
This update provides a unified monitoring experience, allowing teams to oversee wired and wireless network infrastructure from a single platform. IT teams can quickly detect connectivity issues and optimize network performance across distributed environments, even as device management shifts to the cloud.
Gain full control of your network performance
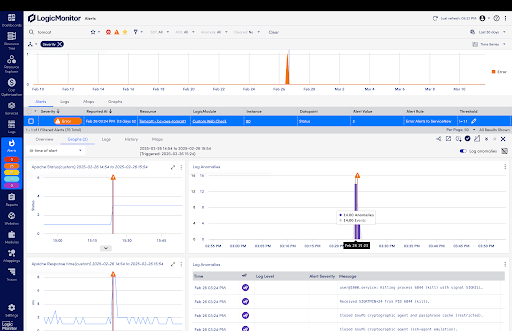
Accelerating Troubleshooting with Logs
When troubleshooting IT incidents, teams lose time manually correlating logs, alerts, and performance metrics across multiple tools. LogicMonitor now embeds logs within the monitoring workflow, automatically associating them with relevant alerts and metrics for faster root cause analysis.
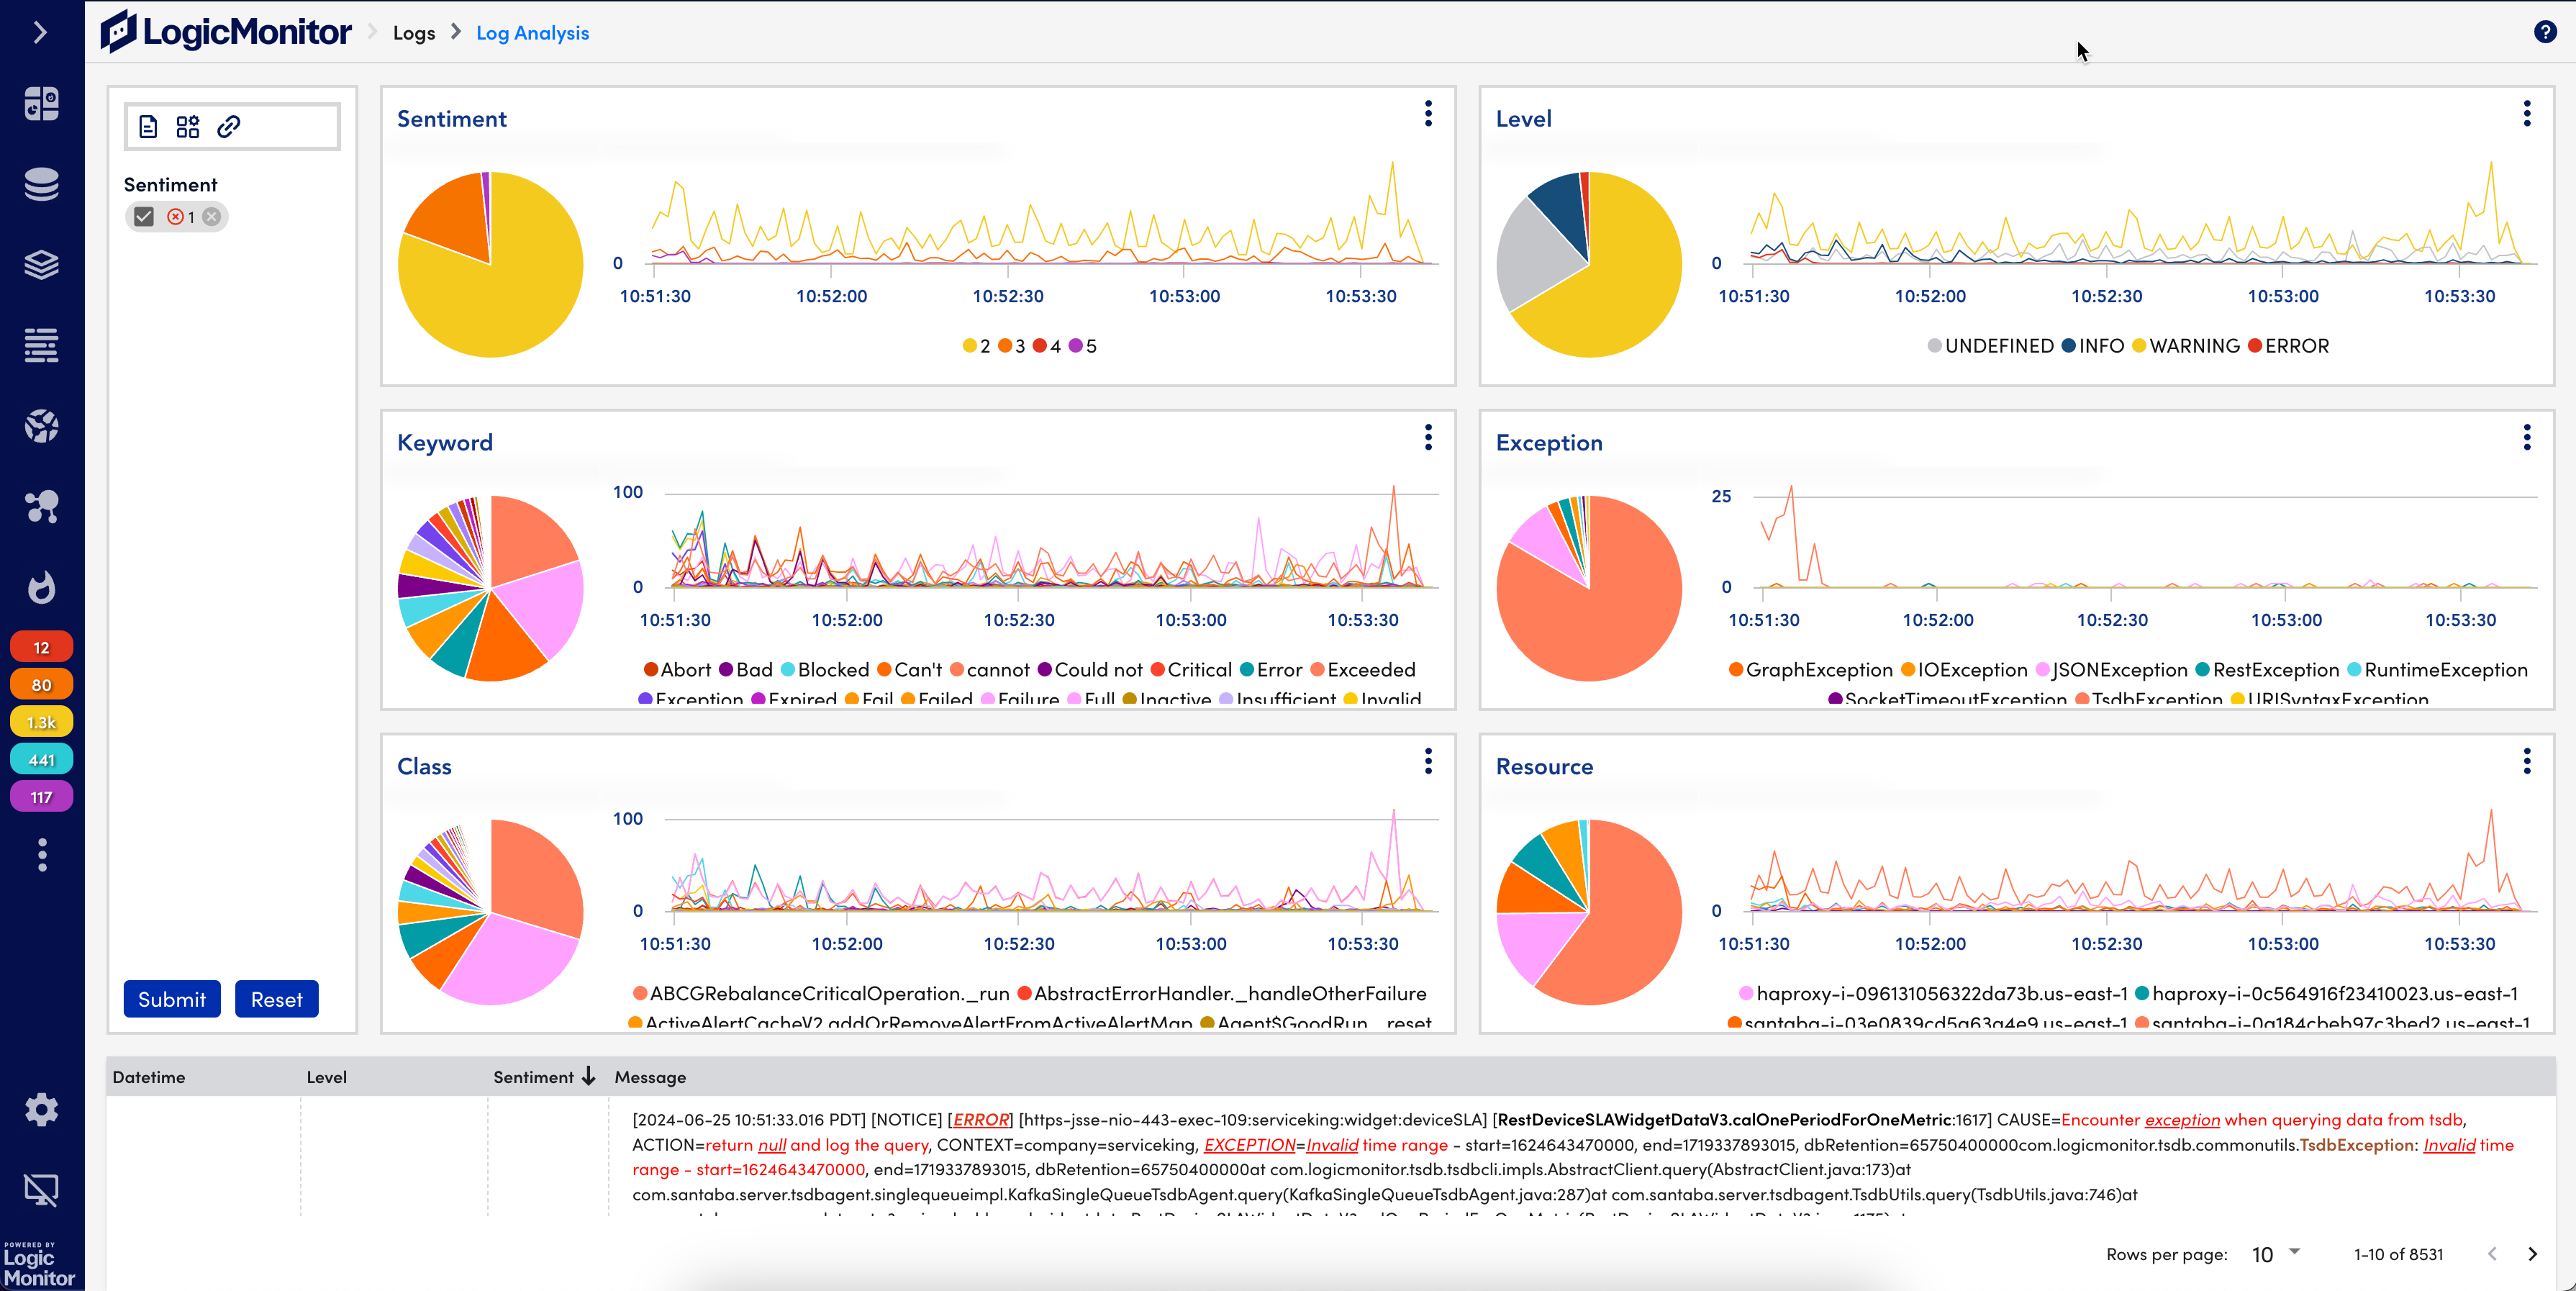
Recent and upcoming enhancements include:
- Query Sharing Library: Teams can save and share log queries, reducing redundant work and improving efficiency
- Enhanced Log Visualizations: New interactive charts and dashboards provide at-a-glance insights
- Log Metricization: Log data can now be converted into actionable metrics, making tracking trends and setting alerts easier
- Automated Windows Log Ingestion: Upcoming releases will enable seamless collection of Windows event logs
- Custom Log Partitions: IT teams can define retention policies based on compliance and operational requirements
no queries or training needed. Prioritize and
resolve critical issues faster.
Stay ahead with smarter log management
Optimizing Insights and Resolution with AI Agent
Incident response often stalls when data is fragmented across multiple tools. Every minute between detection and resolution is critical. Edwin AI, LogicMonitor’s AI-powered agent, eliminates these inefficiencies by automating troubleshooting and prioritizing critical alerts.
New integrations expand Edwin AI’s capabilities:
- Observability Integrations: Connects with Dynatrace, SolarWinds, and AppDynamics for a comprehensive view of incidents
- ITSM Integrations: Streamlines incident management with Jira ITSM, PagerDuty, and Microsoft Dynamics
Enhanced event intelligence helps IT teams move beyond basic alerting by recognizing patterns across historical incidents. The redesigned interface includes computational widgets, saved filters, and structured event details, making issue identification and resolution faster. AI-driven recommendations provide context-aware remediation steps based on past incidents, giving IT teams the confidence to act quickly.
See how data transforms into action
Evolving IT Operations with Hybrid Observability Powered by AI
From AI-powered monitoring and cost optimization to AI-driven event intelligence, LogicMonitor equips IT teams with the capabilities to operate efficiently and proactively. These innovations reduce complexity, improve decision-making, and help IT teams deliver measurable business impact.
Connect with your Customer Success Representative or visit the LM Community to see our platform in action.
Start off by telling us about Empowered Networks and how you were founded.
For over 20 years we’ve been focused on network monitoring and configuration management. By way of history, Empowered Networks’ roots are in the performance monitoring space, dating back to the late 1990s with the explosive growth of layer 3 routing. It was at this time we began to strategically partner with our customers, supporting their evolving performance and capacity requirements. Many members of our team have extensive operational experience, have led and run operations centers, and have lived the challenges of network monitoring and configuration management in their careers.
While we maintained a monitoring practice, the limited innovation in the field drove us to focus more heavily on network change and config management where we could provide the most value to our customers. This has resulted in an extensive Empowered network change and config management practice through our partnership with Infoblox.
We re-evaluated our practices after looking at LogicMonitor, realizing it addressed the issues that had challenged monitoring as a practice. The innovative LogicMonitor approach provides comprehensive and scalable monitoring while eliminating the usability and maintainability problems of the past.
Empowered Networks is proud to now be part of the Fulcrum IT Partners group of companies, affording us the added resources of a global team with a focus on the challenges around security and observability that all our enterprise customers face. We have been solving challenges like this for over two decades and we are excited about the continued evolution of our partnership with LogicMonitor.
What makes Empowered Networks unique compared to other Value-Added Resellers/Channel Partners?
We are quite unique in the partner community, in three areas all related to the high level of value-add we provide for our customers.
- We have a very strong pedigree in monitoring and management. Being in the space for a couple of decades and implementing or integrating with nearly every tool out there, we understand the challenges and we also know first-hand the best practices that work.
- We like to work with our customers all the way through their observability journey. We assess current environments and business challenges, our team demonstrates best-in-class solutions like LogicMonitor, and we run in-depth POV’s so customers can see the capabilities first-hand. Finally, our growing services organization is trained to implement everything we sell, and importantly integrate it with other processes and tools that are important to success.
- We’re also very unique in that we have developed a growing suite of our own SaaS-based solutions that really complement products like LogicMonitor.
- Empowered Bridge simplifies complex integrations with other business systems our customers rely on.
- Empowered Advisor can decorate the discovered data from LogicMonitor with up-to-date information on Security vulnerabilities and Lifecycle updates.
What trends are you seeing in your industry, and how is Empowered Networks staying up to date?
Two items we hear from our customers reflect the challenges the business is bringing back to the IT organization. One goal we hear from nearly every customer is the need for a single, collaborative environment that contains all the observability data for the enterprise, regardless of where the data comes from. Customers need to see on-prem, cloud, and partner SaaS data in one place so they can understand how to best deploy their resources when problems arise. When we show customers how they can do this out-of-the-box with LogicMonitor, they immediately see the business value and impact they can make for their business.
Second, customers are often surprised when we dive into the actual operating costs of their current, legacy monitoring tools. Generally, they only consider the ongoing maintenance costs, but when we unearth the compute, storage, hosting, productivity, impact to innovation, and so on, customers can see a bill they’re paying every year that’s up to five times more than just the OPEX they program for maintenance. When we then compare those costs to LogicMonitor and show them how offloading the tasks and responsibilities of running the platform to the LogicMonitor team, customers immediately intuit how much more productive and innovative their team can be, while at the same time how much better their overall monitoring platform will be.
Chris Hindy
SVP, Product Strategy & Innovation, Empowered Networks