Key Metrics for Monitoring Google Cloud App Engine
Google Cloud App Engine is a serverless platform that enables users to develop and deploy applications. Learn how LogicMonitor can help ensure that you have enough visibility into App Engine health and performance to proactively prevent downtime in our latest blog post.
3 min read
January 11, 2019
In this article
NEWSLETTER
Subscribe to our newsletter
Get the latest blogs, whitepapers, eGuides, and more straight into your inbox.
Thank you!
Your video will begin shortly
SHARE
In this article
Google Cloud App Engine is a serverless platform that enables users to develop and deploy applications. App Engine allows developers to focus more on building applications and less on managing infrastructure. Even though you don’t have to worry about maintaining any underlying infrastructure, you do have to ensure that you have enough visibility into App Engine health and performance to proactively prevent downtime. With LogicMonitor, you can monitor GCP App Engine alongside the rest of your hybrid infrastructure in one single pane of glass.
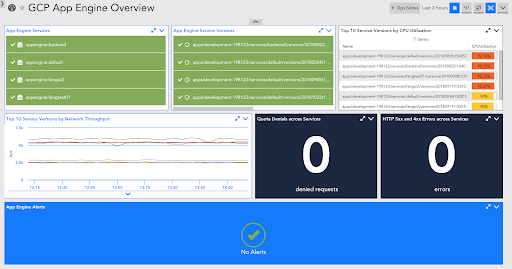
A LogicMonitor dashboard displaying performance data for App Engine Services
Within a GCP App Engine application you create one or more services, which are essentially microservices, and you can have multiple versions within each service (e.g. to accommodate blue-green deployments), where each version has one or more underlying compute instances. Comprehensive monitoring for GCP App Engine should enable you to see how specific service versions are performing. Specifically, we recommend paying close attention to the following key metrics for each version:
HTTP 5xx responses 5xx responses represent server side errors. An increase in such responses can indicate a problem with your App Engine service. You should not only monitor the number of these responses, but you should have alert thresholds configured such that you get alerted and can take action to correct the issue. LogicMonitor has pre-configured thresholds that will trigger an alert when your App Engine services start returning 5xx errors.
DoS Intercepts The DoS intercepts count the number of interceptions that happen per second to prevent denial of service (DoS) attacks. An increase in this count can indicate a security issue or misconfiguration that has the potential to impact the availability of your application. Similar to HTTP 5xx response counts, you should have alert thresholds configured to notify you when the DoS Intercepts count is non-zero. With LogicMonitor, this alert threshold is built in.
Quota Denials Quota denials count requests that fail because your App Engine has exceeded one of it’s per-minute quotas. Among these quotas are limits on the amount of data that can be received by your application per minute, and the amount of data that can be sent by your application per minute. In some cases, you can increase these quotas by paying for excess usage. Regardless, you should monitor quota denials to identify when requests are failing due to excessive quota usage, and how you can optimize your service to avoid such events moving forwards.
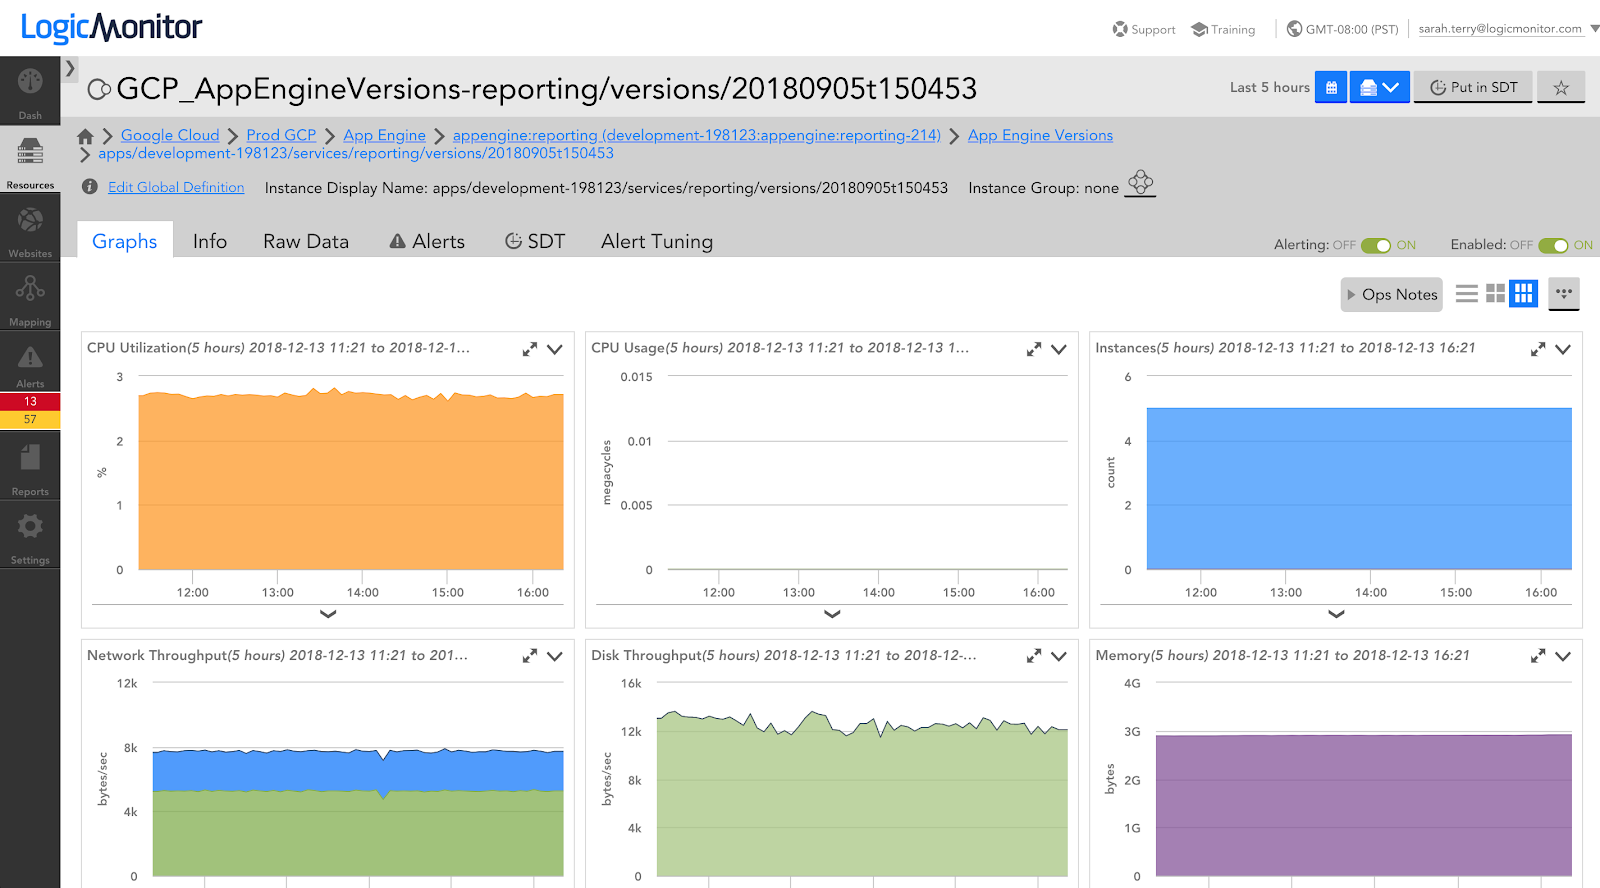
CPU & Memory Utilization Monitoring and alerting on high CPU and memory utilization can help you identify when something is out of the norm, and your application needs to be optimized to avoid performance impacts. LogicMonitor has out of the box thresholds configured such that you will receive warning and error alerts in these scenarios.
In addition to the key metrics listed above, LogicMonitor monitors many more metrics that provide visibility into the health and performance of App Engine services:
To get started monitoring GCP App Engine with LogicMonitor, simply provide us with a service account that has a viewer role for your project(s). We’ll use GCP APIs to automatically discover your App Engine services, including each version, and start monitoring right away! Out of the box alert thresholds and dashboards ensure immediate insight based on best practices and can be easily customized to fit your environment. Best of all, LogicMonitor will provide this visibility into GCP App Engine alongside any other GCP, AWS, Azure, or on-prem monitored resources you have in your distributed IT environment.
Sign up for a free LogicMonitor trial today!
Disclaimer: The views expressed on this blog are those of the author and do not necessarily reflect the views of LogicMonitor or its affiliates.