
Introduction from Taggart Matthiesen, Chief Product Officer
LogicMonitor’s latest product innovations deliver on our commitment to creating a unified experience, supported by a strong foundation in layered intelligence and hybrid observability.
What’s new?
- Continuing our investment in the new unified experience enabling more cohesive and intuitive experiences
- More intelligence and automation so your teams can spend less time on inefficient troubleshooting, and more time innovating
- Expanding our monitoring scope to eliminate more blind spots and downtime with the extensibility you expect from LogicMonitor
Unified Experience
LogicMonitor empowers ITOps and CloudOps teams to optimize and scale their IT environments, deliver high service availability, and control costs with LM Envision’s hybrid multi-cloud observability platform.
As previewed in the summer release blog, LM Envision’s new UIv4 (now in GA) offers a modern and intelligent new platform design built to maximize user productivity, offer intuitive platform administration, and provide a smarter, cohesive, and accessible experience. With LM Envision’s new UI, LogicMonitor customers can visualize their entire environment to improve uptime and drive business-critical initiatives at speed and scale. Please note that you must toggle on the new UI to take advantage of many of the new features in our Fall release, including Resource Explorer, Dashboard Filters and Datapoint Analysis.
Resource Explorer
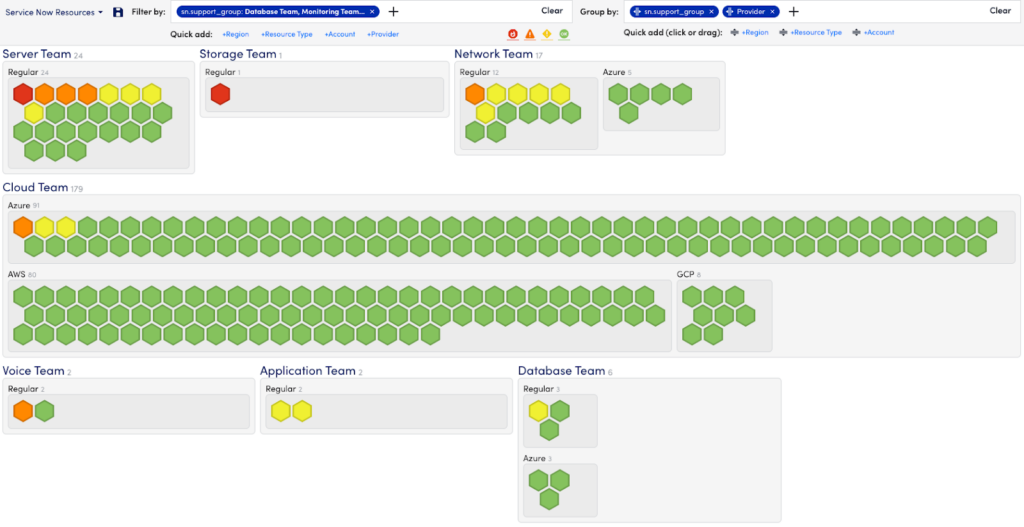
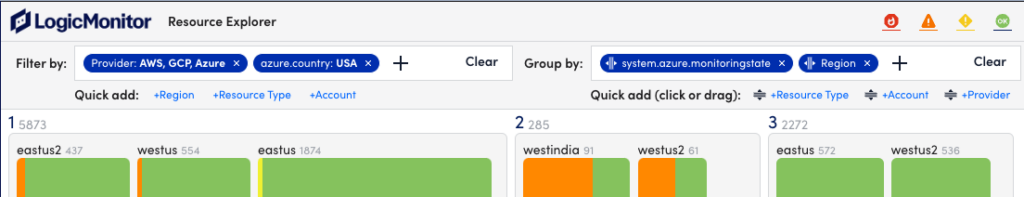
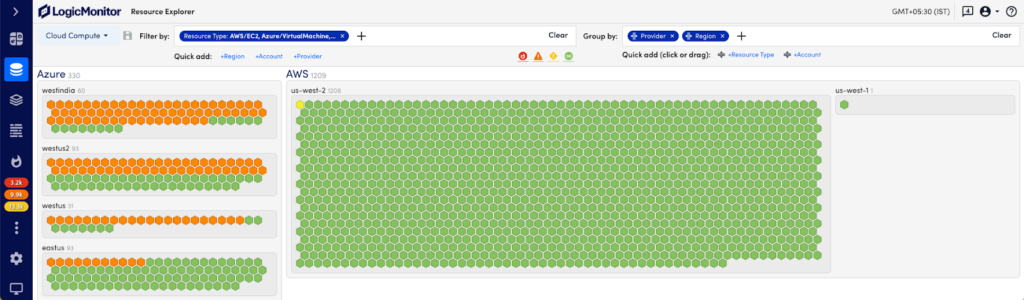
As cloud environments explode in complexity, size, and costs, our customers will benefit from a single unified view that streamlines visibility across on-prem infrastructure, multiple cloud resources, and cloud service providers. LogicMonitor’s Resource Explorer helps teams quickly organize and visualize their entire hybrid multi-cloud deployments to clearly see overall resource and application health. Teams gain comprehensive visibility across thousands of resources, and can easily isolate high priority issues in order to accelerate resolutions.
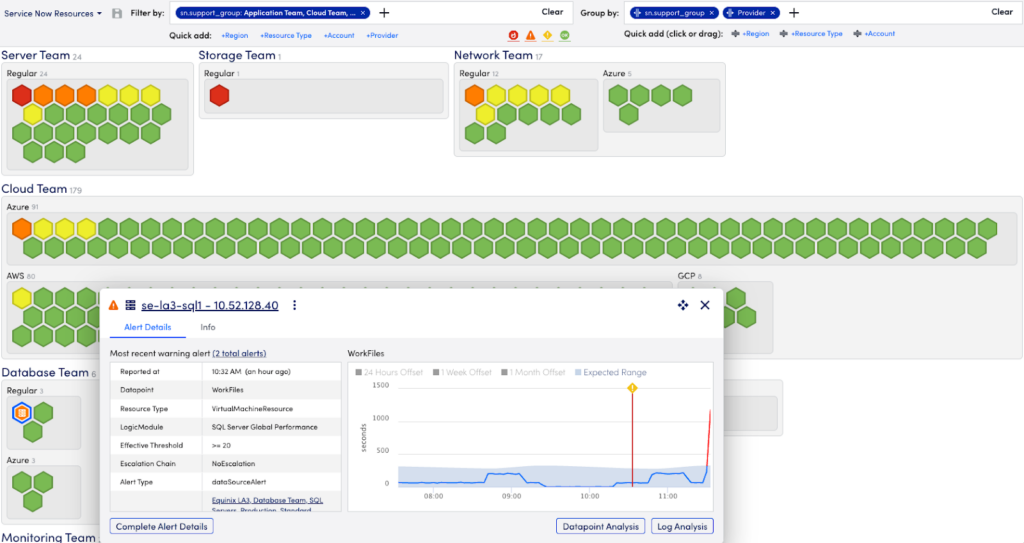
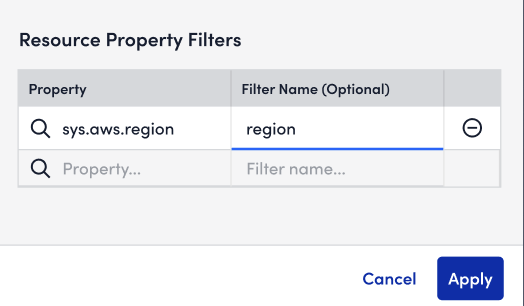
Resource Explorer provides customers with normalized views and properties across any hybrid environment. Easily filter and group views based on tags such as location, cloud provider, alerts, and more to spot problems, reduce unplanned downtime, and maintain your service levels. Problem areas are clearly identified at Resource Explorer’s top view and users can access the contextual details in just a few clicks. Drill down views allow users to locate virtual machines or resources that require attention, to quickly pinpoint the root cause and increase MTTR.
Please note, you must switch over to the New UI by clicking the toggle switch in the header to enable these features. For more information, visit https://logicmonitor.com/support/resources-new-ui-overview.
Dashboard Filters
With UIv4 now in GA, we continue to expand the platform experience with the latest UIv4 feature, Dashboard Filters. Dashboard Filters enables our dashboard creators and consumers to consolidate information into a single pane of glass. Through this new capability, users will be able to leverage filters to hone in on selected resource properties and see the results across widgets on their dashboards. No longer will dashboard creators need to clone and modify queries, nor will dashboard consumers need to spend time navigating the UI in between different dashboards. Remember, you must switch over to the New UI to enable this feature.
Layered Intelligence
Edwin AI
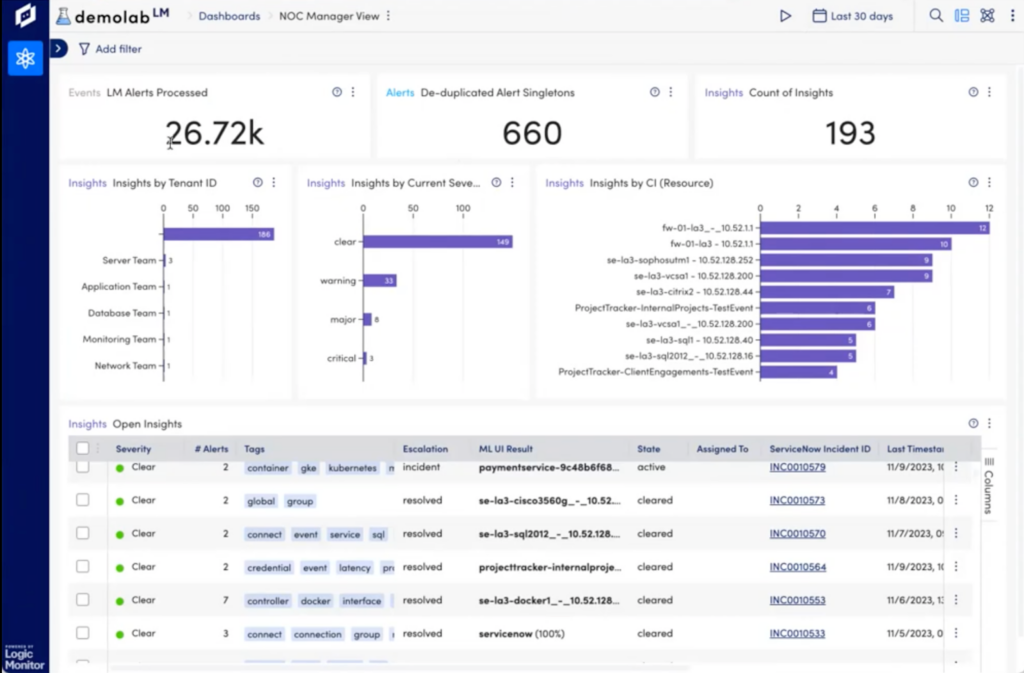
Edwin AI is a new AIOps offering that can reduce alert noise by up to 80%! It ingests events from LM Envision and adds context from ServiceNow CMDB to seamlessly transform millions of alerts into a handful of ServiceNow incidents. Advanced machine learning techniques automatically identify features in the alert data to deduplicate and correlate disparate alerts into connected “Insights” based on time, resources involved, environment, and other significant features of the enriched alert data. The Insights are then correlated so only a handful of Incidents are escalated into ServiceNow as tickets, with a plain English summary that immediately helps Level 1 incident response staff identify the root cause and escalate the ticket to the relevant experts.
Edwin AI comes with the following features:
- Pre-defined, open & customizable Machine Learning Models: With Edwin AI, there is no need to train the AI model, saving your team weeks of manual tagging. Out-of-the-box ML models and integrations with the LM Envision Platform and ServiceNow ensure that IT teams can experience an immediate time-to-value and ROI! In addition, unlike other AIOps vendors, Edwin AI is not a black box. Users can see at a glance WHY certain events are correlated, edit our pre-defined ML models or define their own correlation models to target the alert and enriched CMDB data that makes sense for their business.
- Incident Summary (NLP): Edwin AI generates a plain English textual summary of the Incident in the ServiceNow ticket. Automatically generated Tags to help with “what”, “why” and the “how” of an insight.
- Adaptive Correlation: Edwin AI automatically re-clusters alerts when it identifies a more optimal clustering option. This avoids any delay in escalating insights to ServiceNOW.
- Insight timeline: Pinpoint the causal alert and identify patterns in the alert sequence and instances on the insight timeline
- ServiceNow ready: Edwin AI includes a seamless bi-directional integration with ServiceNOW Incident module, that automatically enriches Edwin AI alerts with ServiceNOW CMDB data to drive additional context for ML correlations.
- MSP ready: Edwin AI supports multi-tenancy with correlations scoped to each tenant.
With Edwin AI, our customers have experienced improved MTTR, SLA’s and faster Root Cause Analysis. In addition, ITOps can finally be proactive instead of reactive. For more information about Edwin AI, please visit https://logicmonitor.com/edwin-ai
Log Alerting Enhancements
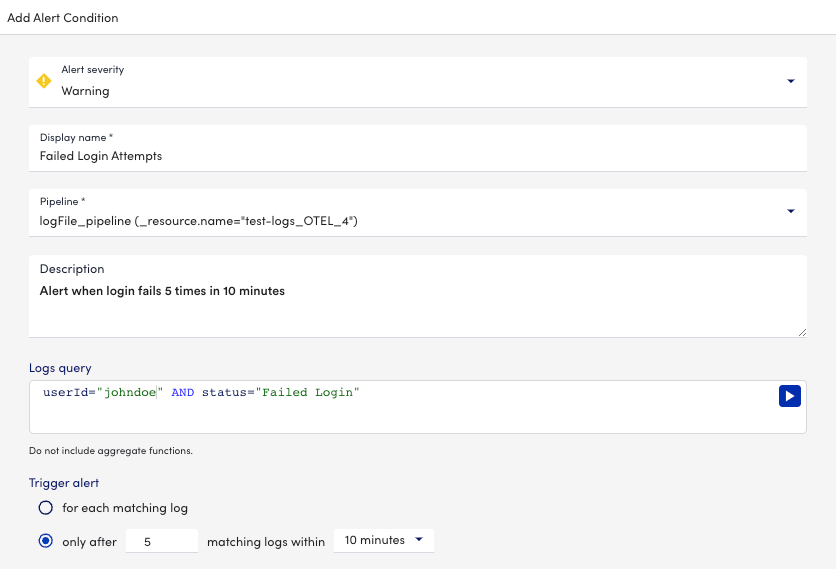
Alert fatigue and alert overload is a constant struggle in IT. Log messages in particular can be repetitive in nature, generating noisy alerts for each redundant match. Log Alerting Enhancements provides better granularity and flexibility for monitoring systems through logs, by allowing users to create or suppress alerts based on certain conditions. This can be used for example with audit logs for logging in – you expect both successful and failed login attempts at any given time, but one failed login does not need to generate an alert. With Log Alerting Enhancements, the failed login attempts can be suppressed until it occurs multiple times in a given time window, such as 5 failed logins in a span of 10 minutes, potentially indicating an issue.
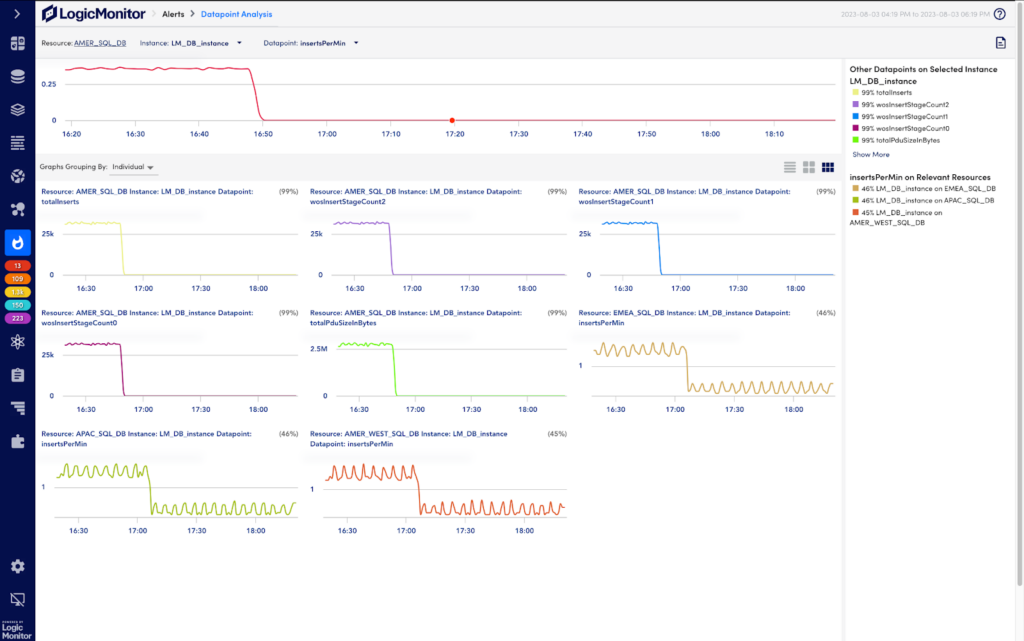
Datapoint Analysis
As previewed in our summer release blog, Datapoint Analysis correlates metrics across data sources to enable faster troubleshooting by creating a correlation score. The correlation score is calculated based on:
- Other datapoints from the same instance
- The same datapoint on other instances within the same resource
- The same datapoint on other resources that share the same collector ID
The higher the correlation score for a particular datapoint, the more correlated that datapoint is to the datapoint associated with the alert.
You can now access this new feature from either the Alerts page or the Alerts tab on the new Resources page by going to the Alert Overview tab and clicking on the new “Datapoint Analysis” button. Again, you must switch over to the New UI to take advantage of this new feature.
Hybrid Coverage
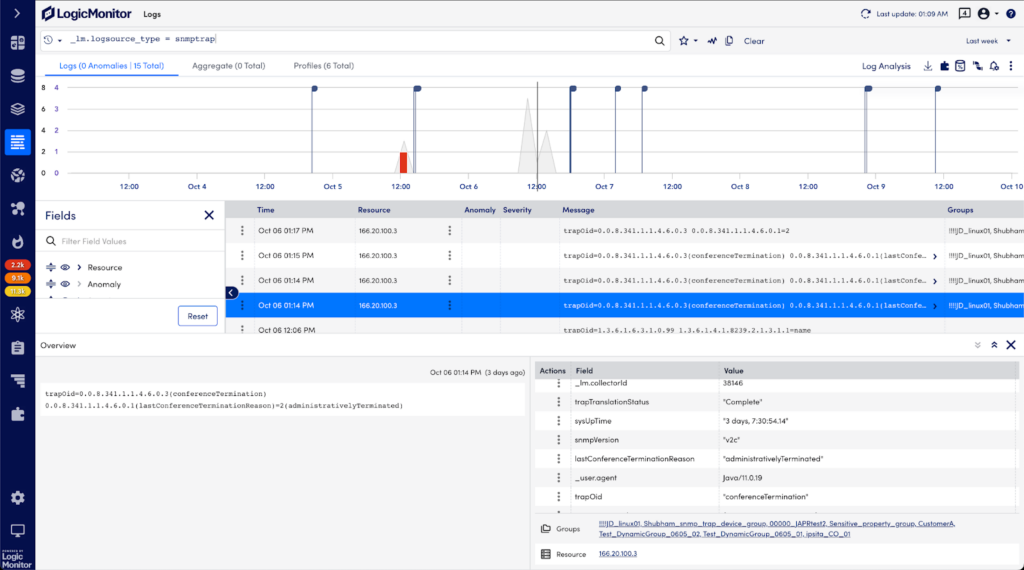
SNMP Traps as Logs
SNMP Traps as Logs, now in Beta, is an exciting improvement that will allow Network Managers to do more with their SNMP traps by processing them via logs instead of as individual alerts. This will help users take advantage of other logs features like more scalable search and filtering capabilities, query tracking, automated anomaly detection, and conditional alerting. SNMP variable binds and OID names are automatically translated by LogicMonitor for easier troubleshooting. In addition, this feature includes up to 1 year of SNMP trap data retention.
Previously, EventSources would only generate alerts from SNMP Traps without the ability to view and search raw Traps.
Please note, customers must subscribe to LM Logs to use this feature.
New Modules
LogicMonitor continues to expand coverage for market-leading SD-WAN solutions with brand new monitoring packages for Cisco Catalyst SD-WAN and HPE Aruba EdgeConnect SD-WAN.
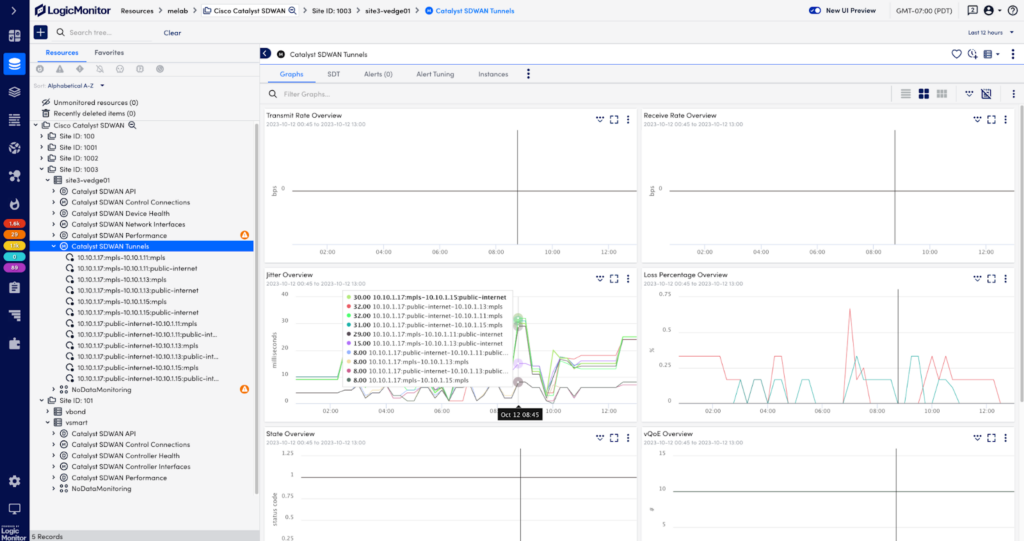
LogicMonitor designed these modules with a common look and feel, while following vendors’ best practices, to make it easier for customers to monitor enterprise scale and heterogeneous SD-WAN environments in the context of broader hybrid infrastructures. These modules enable customers to start monitoring entire SD-WAN infrastructures in minutes and dramatically reduce the effort to maintain synchronization with ServiceNow CMDB. Each package provides automatic mapping of SD-WAN topologies, allowing customers to visualize their connections and alert conditions with underlay and overlay networks and or connected devices. Finally, both support key LogicMonitor features like Network Traffic Analysis, Root Cause Analysis, Role Based Access Control, and Log Anomaly Detection.
Cisco Catalyst SD-WAN modules are available now in LM Exchange and Aruba EdgeConnect SD-WAN modules are scheduled for general availability in December.
We’ve also added official support for Oracle MySQL 8.x and with new monitoring capabilities common to our Microsoft SQL Server and Oracle Database modules, i.e. database size and database backup monitoring.
Finally, we’ve updated our Enterprise Backup and Recovery Software monitoring by introducing formal support for Veeam Backup & Replication v12.
More Information
Looking for more fall release details and demos? Don’t forget to register for our upcoming webinar on November 16th at 11am PST, with LogicMonitor’s product leaders for a conversation about how our recent innovations can help you simplify your complex hybrid multi cloud environment!
Got questions about these new features? Click here to join our fall release Community AMA (Ask Me Anything) Group where project managers will answer your burning questions! On December 5th we will have a live AMA, join the group for more details!


