Downtime is more than an inconvenience these days, nor is it solely a problem for the ITOps team. Since every organization is a digital business, downtime can cost millions of dollars per hour, stall innovation, and erode customer trust. Yet most IT teams are still trapped in reactive mode, scrambling across fragmented tools and drowning in alert fatigue.
That model no longer works. The future of IT is about foresight, not firefighting.
That is why we are proud to announce the next chapter of the LogicMonitor Envision platform. Starting today, we are expanding our agentic AI Ops product, Edwin AI, launching LM Uptime and Dynamic Service Insights, and introducing a simplified platform pricing model. And coming in October, we will extend our comprehensive coverage across the modern data center even further with native monitoring for Oracle Cloud Infrastructure (OCI). Together, these innovations redefine what observability means in the AI era, giving enterprises the confidence to anticipate issues, protect margins, and keep their businesses resilient.
What’s New
Expanded Edwin AI (Available Now)
Edwin AI is now more powerful than ever, delivering predictive resilience at scale. Customers are seeing more than 80% fewer false alerts and 67% fewer incidents. The product also automates the first steps of remediation, helping teams shift from reactive operations to proactive resilience and freeing valuable resources for innovation.
Go behind the upgrade and meet the new Edwin AI agents enabling agentic workflows to see how they’re cut false alerts by 80%
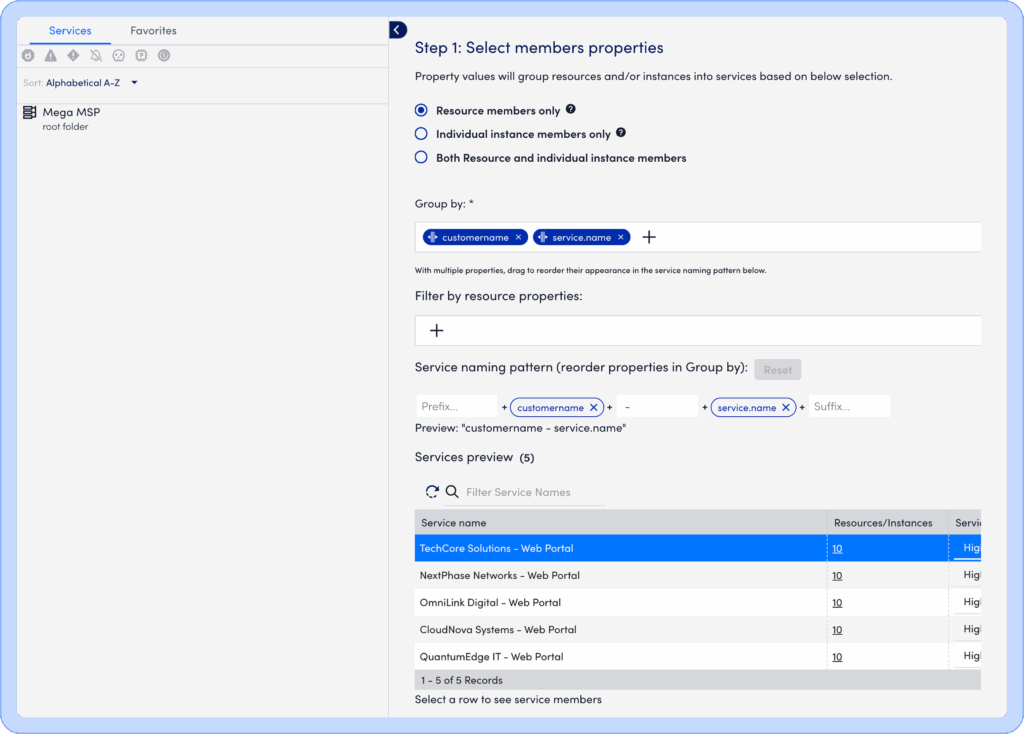
With LM Uptime and Dynamic Service Insights, observability goes beyond infrastructure metrics to map performance directly to business services. Whether it is a customer portal, payments flow, or core ERP system, you can now see how underlying infrastructure issues affect business outcomes. This service-level clarity helps maintain SLAs, prevent small anomalies from becoming outages, and protect the customer experience across on-premises, cloud, and edge.
Explore LM Uptime’s web and endpoint monitoring that integrates with services, dashboards, and alerts.
Our upcoming OCI monitoring release will extend LogicMonitor’s multi-cloud coverage to AWS, Azure, GCP, and now OCI. By bringing OCI telemetry into the same LogicMonitor Envision platform, you gain unified visibility across every major cloud provider. This reduces tool sprawl, simplifies multi-cloud operations, and ensures that every workload can be monitored in context.
Check out OCI monitoring: full visibility for AWS, Azure, GCP, and Oracle Cloud—together in one platform
We are introducing a new pricing model designed around flexibility and predictability. Hybrid Units adapt across devices, cloud instances, wireless access points, and PaaS resources. Whether you are shifting workloads to the cloud or expanding wireless infrastructure, you can scale without renegotiating contracts or adding complexity. Packages (Essentials, Advanced, Signature) make it easy to start where you are and grow when you need to.
Learn how Hybrid Units work through flexible, predictable pricing that scales with your hybrid estate.
Anticipate, don’t react → Spot emerging failures before they disrupt operations.
See one truth → Unify metrics across on-premises, cloud, and edge in a single view.
Move from insight to action → Automate the first steps of remediation to close the gap from anomaly to resolution.
Turn consumption into renewal → Optimize compute, cooling, and energy to build greener, more sustainable operations.
What’s Next
This announcement builds upon our platform vision and represents another step toward the future of resilient IT. With Edwin AI, LM Uptime, and Dynamic Service Insights available today, simplified pricing to make adoption easier, and OCI support arriving in October, LogicMonitor continues to help enterprises anticipate issues, protect margins, and step confidently into the AI era.
Your front-row seat to resilient IT.
Sign up for our September 24 webinar and get a live demo of what’s new from our experts.
LogicMonitor Sets a New Standard for AI-First Observability with Edwin AI and Expanded Service Intelligence
New capabilities help enterprises anticipate outages, safeguard margins, and scale resilient, autonomous operations.
Santa Barbara, California – Sept. 17, 2025 – LogicMonitor, the AI-first hybrid observability platform powering the next generation of digital infrastructure, today announced major enhancements to its LM Envision platform. These include continued innovation in AI agents with Edwin AI, the general availability of LM Uptime and Dynamic Service Insights, upcoming support for Oracle Cloud Infrastructure (OCI) and a new platform pricing model designed to simplify adoption and scale with customers as their needs grow. Together, these innovations give enterprises the foresight to prevent outages, ensure service-level health and accelerate resolution across complex hybrid environments.
Edwin AI now delivers predictive resilience at scale, with customers reporting results such as reducing noise by more than 80% and cutting incidents by up to 67%. Many organizations see measurable improvements within the first hour, as the platform begins automating the initial steps of remediation. With these advancements, IT teams can move beyond reactive operations to proactive resilience, safeguarding uptime and freeing resources for innovation.
“IT leaders are overwhelmed by alert fatigue, rising complexity and outdated, reactive operations,” said Christina Kosmowski, CEO of LogicMonitor. “That model no longer works. With Edwin AI and our new service-level intelligence, we are giving teams the foresight to anticipate issues, prevent disruptions and keep their businesses running predictably and resiliently. In a world where downtime can cost millions an hour, proactive IT is not just smart, it is a business imperative.”
“Edwin AI is a trusted member of our team, always on and relentlessly reliable,” said Saba Maroun, Chief Customer Services Officer at Nexon Asia Pacific. “Edwin AI has taken hours off our weekly workload and empowered us to make smarter, faster decisions with confidence.”
LM Uptime and Dynamic Service Insights (GA today) extend observability beyond infrastructure by mapping technology performance directly to business services. This service-level clarity enables IT leaders to pinpoint issues early, maintain SLAs and protect customer experience across on-premises, cloud, and edge systems. It also helps IT Operations teams and leaders articulate the business impact of the work they do and the technology they orchestrate.
Oracle Cloud Infrastructure (OCI) Monitoring (GA in October) will expand LogicMonitor’s multi-cloud coverage, providing unified visibility across AWS, Azure, GCP and now OCI. With OCI support, LogicMonitor strengthens its position as the broadest hybrid observability platform, helping enterprises eliminate tool sprawl and monitor every workload in one place.
To simplify adoption, LogicMonitor is introducing a new platform pricing model built around flexible Hybrid Units and three packages:Essentials, Advanced and Signature. This model provides customers with a predictable way to scale observability across devices, cloud instances, wireless and PaaS resources without adding complexity.
“Observability is no longer optional. It is the foundation of resilient, efficient and sustainable digital infrastructure,” said Garth Fort, Chief Product Officer at LogicMonitor. “With expanded service intelligence and predictable, simplified pricing, we are helping enterprises unify visibility, accelerate resolution and scale observability without unnecessary complexity. This positions our customers to thrive in the AI era.”
The new Edwin AI, Dynamic Service Insights, and LM Uptime products are available immediately, with OCI monitoring general availability in October. For more information, visit www.logicmonitor.com.
About LogicMonitor
LogicMonitor® is the AI-first hybrid observability platform powering the next generation of digital infrastructure. LogicMonitor delivers complete visibility and actionable intelligence across on-premises, cloud, and edge environments. By anticipating issues before they strike, optimizing resources in real time, and enabling faster, smarter decisions, LogicMonitor helps IT and business leaders protect margins, accelerate innovation, and deliver exceptional digital experiences without compromise. For more information, visit www.logicmonitor.com and our blog, or follow us on LinkedIn, X, Facebook, and Youtube.
The future of IT operations isn’t about reacting faster but anticipating what’s next. With complex, hybrid environments now the default, we believe our customers deserve clarity, flexibility, and the ability to scale without friction.
That’s why LogicMonitor is introducing new platform pricing. It’s built to simplify how you buy, deploy, and extract value from observability across every layer of your hybrid infrastructure.
Why We’re Evolving Pricing
Customer-first isn’t new for us, it’s who we are. From day one, our pricing has been predictable, transparent, and free from “gotchas” that too often come with enterprise software. No hidden modules, no surprise fees. Just straightforward licensing that grows with you. That commitment isn’t changing.
What is changing is the world our customers operate in. Hybrid environments are now the backbone of modern IT, spanning on-premises data centers, multi-cloud deployments, edge computing, and everything in between. But pricing models in our category haven’t evolved at the same pace, and they’re often fragmented, unpredictable, and hard to scale.
Today, we’re changing that. Our new pricing model is a natural evolution of the principles we’ve always stood for: simplicity, flexibility, and fairness.
In this new model, we’re shifting away from product-by-product licensing to three packages: Essentials, Advanced, and Signature. Each enabled by a flexible Hybrid Unit.
The Power of the Hybrid Unit
The Hybrid Unit is at the core of this change. It’s a single, flexible measure of consumption that adapts to your environment, not the other way around.
One Hybrid Unit can represent:
one monitored device
one IaaS instance
five wireless access points
or seven PaaS resources
But the real value isn’t in the math, it’s in the freedom it gives you.
Scenario 1: Shifting from servers to cloud. Imagine you’re running 200 on-prem servers today. Next quarter, half of those workloads move into AWS. With traditional licensing, you’d need to get your purchasing team involved, renegotiate contracts or request budget approval for new SKUs. With Hybrid Units, nothing changes. The same 200 Hybrid Units seamlessly cover your new AWS instances. Procurement isn’t slowed down, and your migration stays on schedule.
Scenario 2: Scaling modern apps. A development team embraces Kubernetes and rolls out thousands of new containers. Instead of worrying about licensing each PaaS instance, your Hybrid Units absorb that growth. Your team focuses on innovation, not another vendor contract cycle and negotiation to estimate K8s usage multiple years into the future.
Scenario 3: Growing wireless footprints. Let’s say your campus is expanding, and you’re adding hundreds of new wireless access points. Instead of scrambling to buy a new SKU, your existing Hybrid Units flex to cover them. No disruption, no delays.
In practice, this means less time managing contracts and more time driving innovation. You gain the predictability of a standardized model with the flexibility to adapt as your infrastructure evolves.
The Packages at a Glance
Essentials: Foundational monitoring and LM Logs, ideal for small to mid-sized teams managing up to 1,000 devices.
Advanced: Comprehensive hybrid observability, including everything in Essentials, plus LM Uptime, Dynamic Service Insights, and Data Publisher.
Signature: Full-stack visibility for complex enterprises, with SaaS Monitoring, Cost Optimization, and ServiceNow CMDB integration.
For Advanced and Signature tiers, you can easily move into agentic AIOps and prepare for autonomous IT with Edwin AI, our AI-native event intelligence engine that cuts through noise and accelerates root cause analysis.
And every package makes it easier than ever for IT teams to accelerate their troubleshooting by including LM Logs because context-rich troubleshooting should never be optional.
What This Means for You
Whether you’re running lean or scaling globally, this model is designed to meet you where you are:
Predict and prevent issues before they hit production with Edwin AI’s proactive intelligence.
Monitor everything—from data centers to cloud-native apps—in a single, unified platform.
Save time on procurement and renewals with straightforward packages and consistent unit pricing.
Scale your coverage without scaling complexity—the Hybrid Unit gives you flexibility across environments.
Drive ROI from day one with pre-bundled capabilities that reduce MTTR and eliminate tool sprawl.
These new packages aren’t mandatory, they’re an option. For some, Essentials will be a cost-effective way to stay protected. For others, Advanced and Signature will unlock new paths to automation and resilience. But in every case, it’s built around you: your hybrid journey, your scale, and your outcomes.
Looking Ahead
Observability is no longer a niche category. It’s central to how resilient, sustainable, and secure digital infrastructure gets built. With this new pricing model, we’re making it easier for customers to consolidate tools, reduce noise, and get ahead of what’s next.
We’re excited to bring this to market. And as always, we’re building alongside you. Focused together on delivering platform value, unlocking automation, and helping IT teams move with more confidence into the AI-powered future.
These days many IT Operations teams have gotten very sophisticated in the ways they talk about availability, SLAs, SLOs (Service Level Objectives), and even more nuanced measures of reliability. But when websites or services go down, even briefly, “uptime” is still the number you’re explaining to execs, customers, or incident review boards.
In reality, keeping a service up is table stakes. It’s the minimum expected from any ops team. But hitting that 99.99% isn’t automatic. That’s why we built LM Uptime: to make it easier than ever before for ITOps to monitor web and endpoints.
What is LM Uptime?
LM Uptime integrates web and ping checks directly into LogicMonitor’s unified observability platform, LM Envision, bringing full-stack, platform-native visibility to your web and endpoint monitoring. You can monitor your websites and services–whether external or internal –on your private network, from worldwide locations, and from within your private networks.
Why It Matters Now
Downtime can be a significant financial cost for your organization. It also erodes trust. As your infrastructure grows increasingly complex and more distributed, your critical services span cloud, on-prem, and third-party systems. You need a solution that can verify availability from where it matters most: the user’s point of view.
LM Uptime gives your team the proactive edge. Whether you’re defending uptime, preparing for audits, or responding to incidents, this solution ensures you’re never in the dark when it matters most.
LM Uptime delivers:
Smarter Monitoring: All datapoints support alerting, with dynamic thresholds, flexible graphing, and full dashboard/widget compatibility.
Operational Simplicity: Alert routing, group inheritance, and property management now work just like with devices, reducing support burden and setup time.
Service Integration: Uptime checks can be added to Services, linking performance to business outcomes—something other tools don’t do.
Future-Readiness: This shift sets the stage for better correlation, reporting, and AI insights across all resources.
How LM Uptime Works
LM Uptime executes checks against your website and services from LogicMonitor’s worldwide resource monitoring locations, delivering an outside-in view of your externally-accessible services. For websites and resources available only within your private networks, LM Uptime runs checks from inside the network using the existing collectors in LogicMonitor.
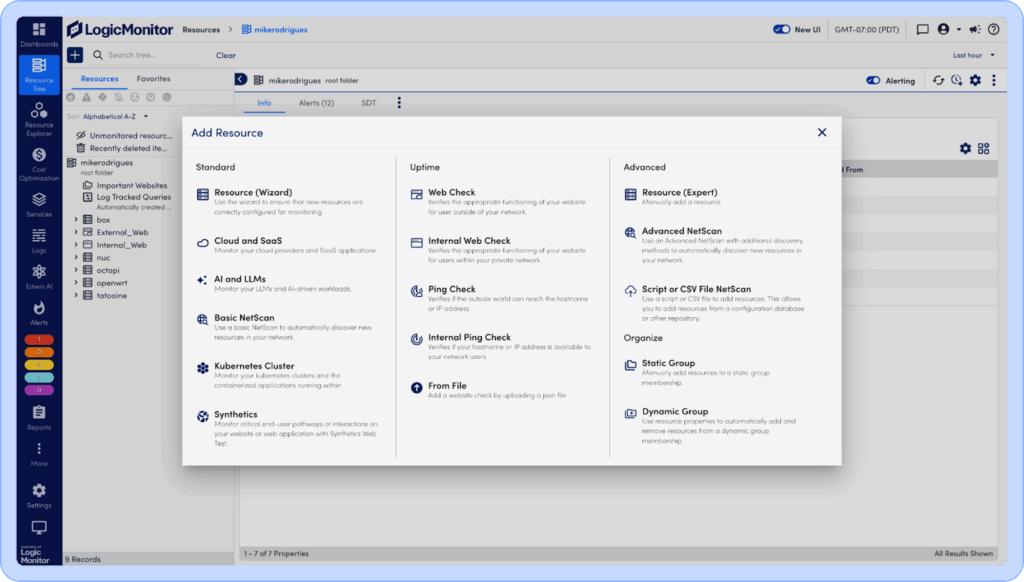
To create an LM Uptime Check, it’s as easy as adding any other resource. Go to the Resource Tree and press the Add Resource (+) button and choose a type of Uptime Check:
For web and ping checks, you create checks that are executed from outside of your network, and internal checks that are performed from within your private network.
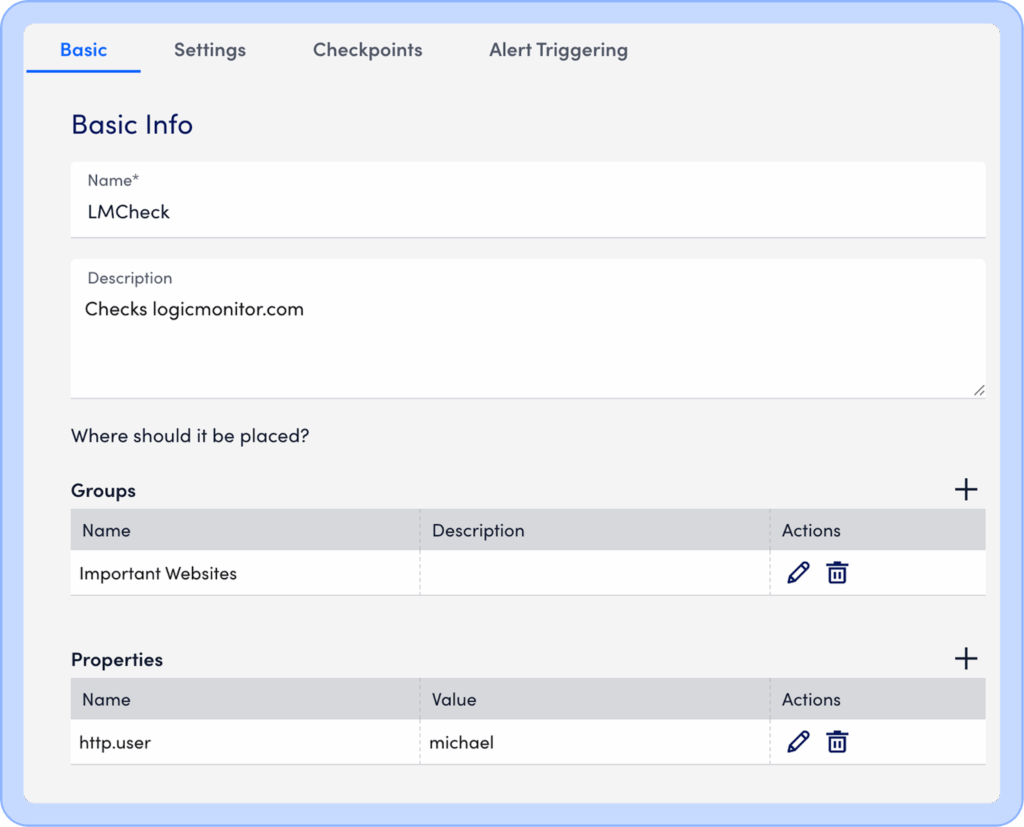
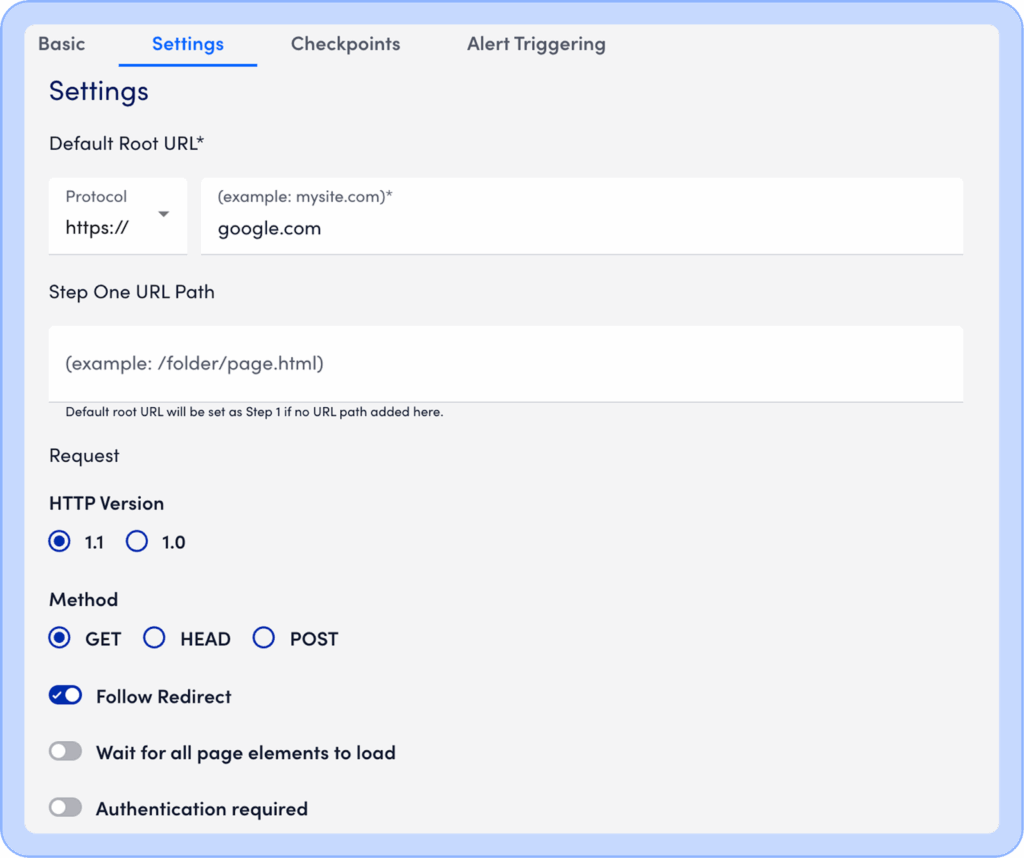
Next set the basic information for the check, including the base URL and paths to check.
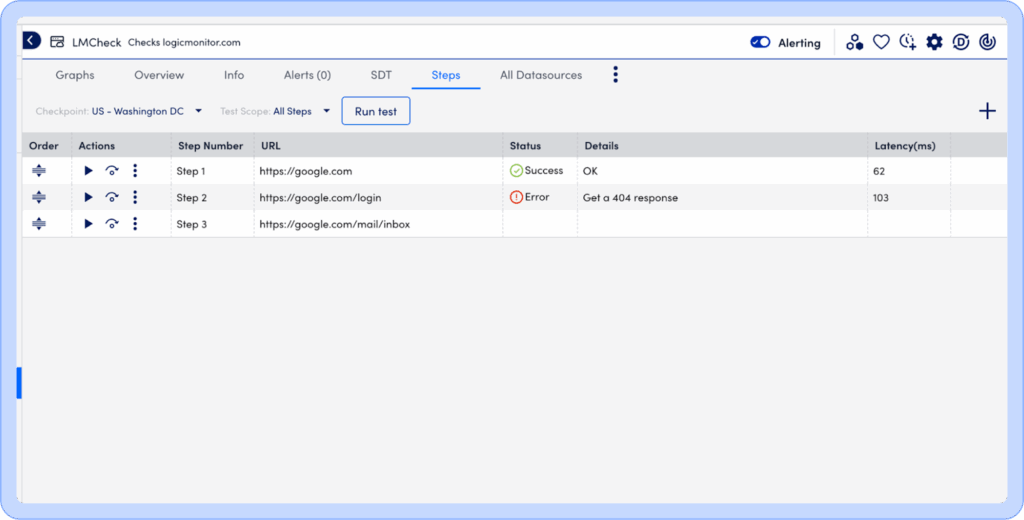
Add steps to the check
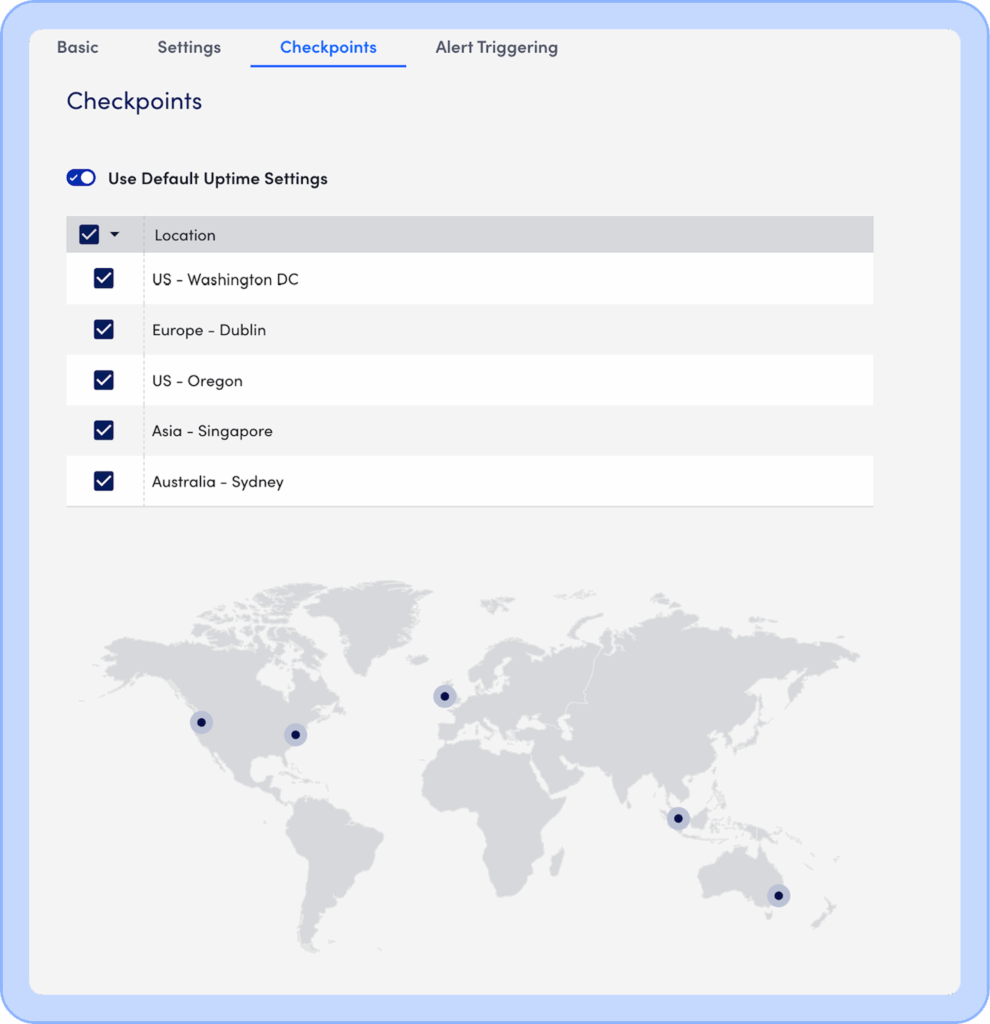
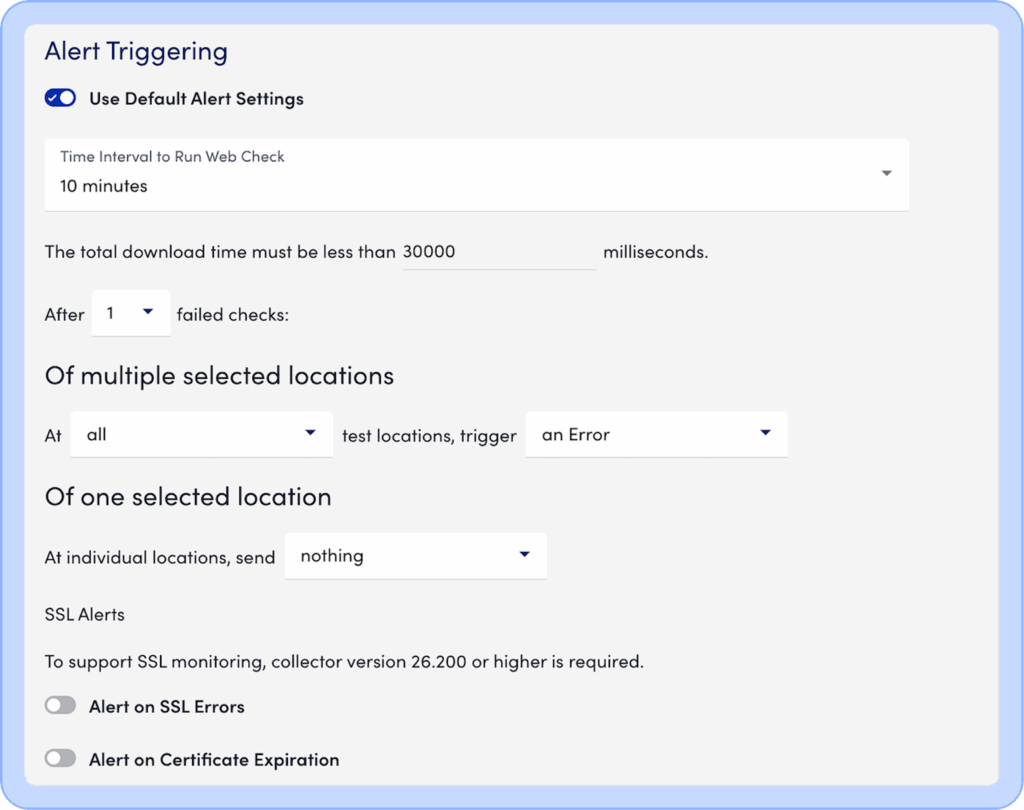
Then pick the locations and the trigger conditions:
Once these are set up, you will be able to visualize and monitor your websites as resources, which gives you:
More flexible alert tuning across a wider set of datapoints
Same property system as Resources
Static & Dynamic Grouping with all your other Resources
Dashboard widgets that weren’t compatible with legacy websites
Ability to include in Resource Reports
Native service integration with websites as members of Service Insights
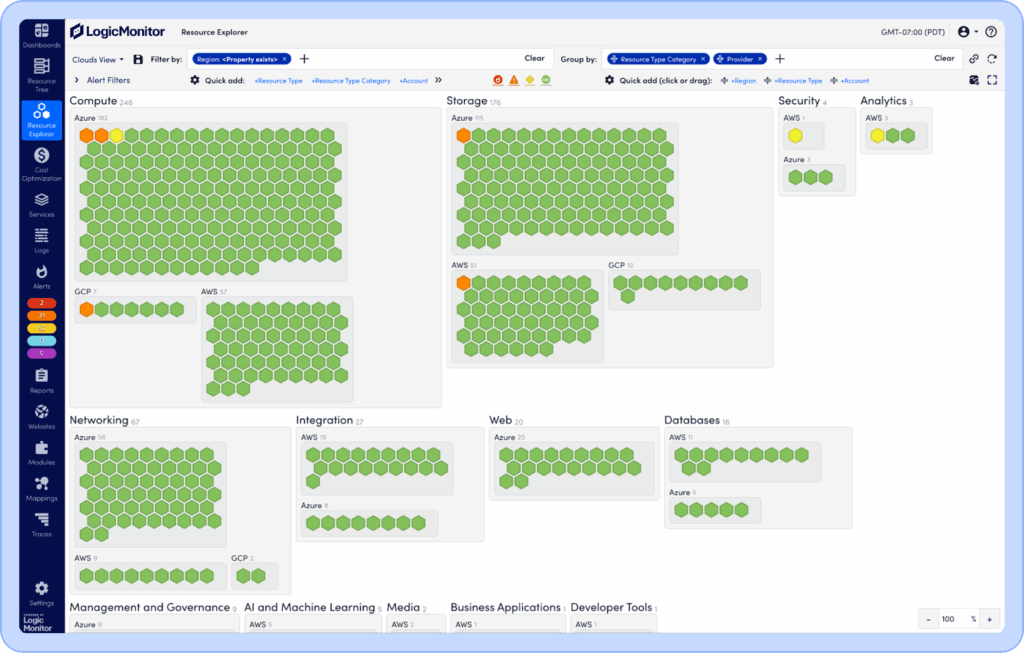
See the state of all of your resources, including websites, together in the Resource Explorer
How We Stack Up Against the Competition
What sets LM Uptime apart from other web monitoring tools is its simplicity to set up and use as well as the end-to-end visibility and value it returns by monitoring websites and all of the resources on which they depend on a single platform. Since LM Uptime is part of LM Envision, you can monitor web, infrastructure, cloud, and network resources without switching between tools. You get a single observability platform with a unified interface.
Pricing and Getting Started
LM Uptime is included in LogicMonitor Advanced and Signature platform packages, and also available as a standalone product.
Start monitoring your web sites and services with your hybrid infrastructure now
System uptime sets the pace of business. When a critical service degrades, the clock is running, and every delay compounds the impact.
While modern monitoring tools can flag the issue in seconds, detection is not resolution. Teams still have to scramble through dashboards, runbooks, and chat threads while your outage drags on. Alerts without action are just more noise.
This is the execution gap—the costly lag between knowing about a problem and actually resolving it. ITOps teams understand that the difference between a 15-minute resolution and a 90-minute one is not only time but also tens of thousands in revenue, missed SLAs, and permanent customer trust loss.
Edwin AI closes the execution gap. While basic monitoring tools stop at surfacing alerts, we’ve spent the last year building something fundamentally different: Agentic AIOps that detects and resolves incidents.
Now, we’re pushing the envelope further. We’re introducing Edwin AI’s growing suite of specialized agents—purpose-built for ITOps teams who know that in production environments, speed changes everything.
TL;DR: LogicMonitor introduces Edwin AI’s next evolution: an orchestrated ecosystem of specialized agents that close the execution gap in IT operations.
Monitoring tells you something’s wrong; observability tells you why; Edwin AI’s agents fix it.
Traditional incident response stops at detection and leaves teams scrambling across tools and silos.
Edwin AI closes the execution gap with 10+ specialized agents that investigate, correlate, recommend, and remediate in seconds.
The results are faster MTTR, fewer escalations, and IT teams operating at a new scale.
The Limitations of Traditional Incident Response
It’s worth starting with how most incident response works today and why many advanced tools are still falling short.
Even high-performing ITOps organizations remain trapped in an outdated operational model. Incident response continues to follow a relay race structure: one tool detects an issue, another analyzes it, and then the “fix” baton gets passed often across teams, tools, and time zones.
The numbers tell the story. Despite most teams having documented processes and automation, incidents still drag on, driving more downtime and higher costs. That’s because while legacy monitoring approaches excel at detection and correlation, they abandon teams at the most critical moment: execution. And the result is a predictable pattern of operational friction:
Runbook hunting: Engineers scramble through wikis, knowledge bases, and shared folders to find the right resolution steps, often under pressure while systems remain down.
Context switching: Teams frantically juggle between dashboards, ITSM tickets, chat threads, and CLI tools, trying to piece together the complete operational picture while the clock ticks.
Manual remediation: Even supposedly “automated” fixes require manual triggers, human validation, and cross-team coordination, introducing delays at the moment speed matters most.
Information silos: Critical context like change data, historical logs, and previous incident resolutions are trapped in separate systems, making root cause analysis slower when every second counts.
This operational fragmentation is systematic delay built into the incident response process:
MTTI (Mean Time to Identify) stretches longer because relevant context isn’t surfaced instantly alongside alerts. Engineers waste time reconstructing the operational narrative instead of focusing on resolution.
MTTR (Mean Time to Resolve) suffers when fixes require coordination across disconnected tools and teams, with no intelligent agent orchestrating the end-to-end process.
Institutional knowledge evaporates when successful fixes live in individual memory or scattered documentation, rather than being actively surfaced by the system when similar conditions arise.
The path from “alert detected” to “problem solved” remains fundamentally broken, and there’s been no automated way to close it.
Learn more on how agentic AIOps automates IT incident response.
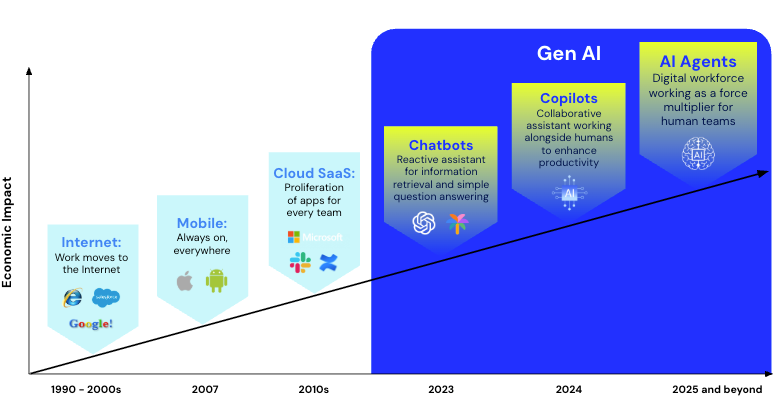
Bridging this execution gap demands systems that can work at the speed, scale, and precision of modern production environments. Copilots and chatbots can assist, but they wait for a prompt and stop short of execution. AI agents are different. They stay inside the incident context, share information with other agents, and act without constant human direction.
AI agents offer:
Continuous context awareness: Agents aren’t starting from scratch every time you ask for help; they already have the incident history, related metrics, logs, and changes in view.
Coordinated problem-solving: Agents can delegate to each other. For example, one agent pulls metrics while another finds related changes, and a third recommends the fix.
Execution: Agents can run automation, roll back the bad deploy, or restart a service.
Ambient operation: Agents can act before you ask, detecting early signals and kicking off diagnostics or mitigations.
Together, these abilities turn agents from passive helpers into an active, coordinated workforce, shortening the path from detection to resolution.
Introducing Edwin AI’s Agent Ecosystem: Specialized Skills for Complex Environments
With this launch, Edwin AI evolves from a single autonomous IT operations agent into an ecosystem of specialized AI agents, each designed to master a specific stage of the incident lifecycle.
These agents work in concert, sharing context and orchestrating actions, so IT teams can go from alert to resolution without the bottlenecks of manual triage, fragmented tooling, or knowledge silos.
Here’s a quick run through of all Edwin AI’s agents:
Event Intelligence Agents
ITOps Agent: Interacts via natural language to answer, investigate, and guide triage, troubleshooting, and remediation.
Insights Agent: Provides context-rich responses grounded in Edwin AI’s insight and alert data.
ITSM Agents
Similar Incidents Agent:Learns from past resolution notes to accelerate diagnosis and recommend proven resolutions.
Change Records Agent: Highlights recent deployments, configuration updates, or infrastructure changes that may relate to current incidents.
Knowledge Base (KB) Agents
Public Knowledge Agent: Searches public docs, vendor portals, and internal knowledge for matching solutions.
Private Knowledge Agent: Analyzes your organization’s internal knowledge to surface relevant guidance without switching context.
Telemetry Agents
Metrics Agent: Surfaces key metrics in real-time, detecting patterns, deviations from normal behavior and enabling performance insights.
Logs Anomaly Agent: Automatically identifies unusual log entries associated with alerts to help pinpoint root cause faster.
On-Call Agents
On-Call Agent: Taps into past collaboration threads and incident escalations from Slack, Teams, and PagerDuty to provide contextual guidance, recommended actions, and SME routing.
In-Chat Agent: Ability to engage with Edwin AI directly from Slack and Microsoft Teams.
Data Visualization Agents
Charts Agent: Generates visualizations on Edwin data from natural language queries, including insights, alerts, and events.
Automation Agents
Generate Automation Agent: Creates automations to remediate incidents.
Discover & Execute Automation Agent: Identifies and acts on existing automation to resolve issues.
Alongside this agent ecosystem, Edwin AI continues to provide core capabilities like AI-generated alert summaries, root cause analysis, and remediation recommendations. These skills complement the specialized agents and ensure every stage of incident response is covered.
How Edwin AI’s Agents Work Together
Most AI in IT operations is still single-purpose: one model answers questions, another plots charts, another runs automation. Individually, Edwin AI’s agents bring deep expertise to specific parts of the incident lifecycle. But their real strength comes from working together.
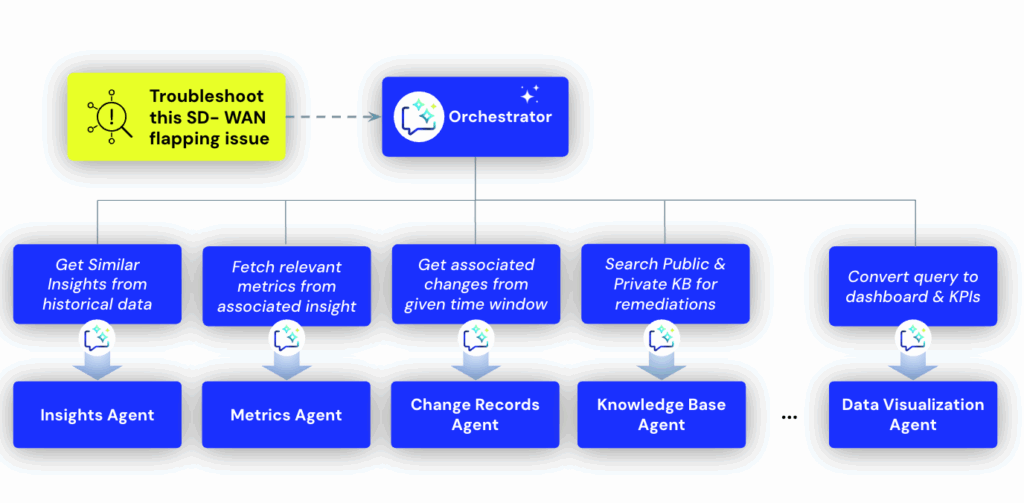
To offer an example: At the core of Edwin AI is the Orchestrator Agent, the brain that coordinates specialized agents.
It receives an incident as context.
It decides which agents should be called, in what order, and with what parameters.
It aggregates outputs, evaluates results, and determines the next best step.
When an alert comes in from a critical database service:
Event Intelligence Agents generate the AI Title, Summary, and RCA.
Change Records Agent checks for recent deployments to that service.
Metrics Agent surfaces the CPU and I/O spikes that preceded the alert.
Generate Automation Agent creates a playbook to roll back the change.
Execute Automation Agent runs the rollback automatically.
Post Mortem Document Agent compiles a report—all without an engineer leaving Edwin.
Edwin AI’s specialized agents are already reshaping how IT operations teams detect, diagnose, and resolve incidents.
From early access customers to in-house testing, the results point to one clear outcome: lower MTTR, fewer escalations, and engineers freed from repetitive firefighting.
1. Instant, Context-Rich Triage
Before: L1 engineers spend the first 15-20 minutes of an incident stuck piecing together what happened from scattered dashboards, ticket notes, and monitoring alerts.
After: By generating an AI title, summary, root cause analysis, and impact analysis in seconds, Edwin AI provides a clear, natural-language brief that keeps everyone—from on-call SREs to executive stakeholders—aligned on the same actionable picture.
“The Edwin AI Agent is very helpful for L1 engineers. It gives them a starting point for triage and helps surface relevant information faster—ultimately helping them prioritize, escalate, and resolve faster.” — Early Access Participant
2. Faster Root Cause Identification
Before: Engineers manually dig through logs, cross-reference with recent change requests, and search internal KBs.
After: Metrics Agent, Logs Anomaly Agent, Change Records Agent, and Similar Incidents Agent run in parallel—correlating anomalies, recent changes, and historical fixes in seconds.
3. Knowledge That Finds You
Before: Critical fixes live buried in Confluence, runbooks, or vendor portals.
After: Private Knowledge and Public Knowledge Agents retrieve relevant resolution steps automatically—no hunting, no browser tabs, no stale answers. Engineers act with confidence, knowing recommendations are sourced from their own institutional knowledge or the most trusted vendor docs.
4. Automated Remediation Execution
Before: Even “routine” fixes required a human to trigger automation, validate the result, and update the ticket.
After: Automation Agents identify the right fix and take action by rolling back bad deployments, restarting failed services, or applying known patches without delay.
5. Consistent Post-Incident Documentation
Before: Post-mortems were rushed, inconsistent, and sometimes skipped entirely under workload pressure.
After: Post Mortem Document Agent auto-compiles incident details, RCA, remediations, timelines, and outcomes into a standardized format—preserving institutional memory and improving future readiness.
From AI as an Assistant to AI as a Teammate
AIOps was never meant to stop at detection and correlation. The original promise was autonomous, self-healing IT—systems that could not only find problems but fix them. Until now, the technology and orchestration simply weren’t mature enough to deliver.
Agentic AIOps fulfills that promise. Where copilots and chatbots once offered guidance but left execution to humans, agents now investigate, correlate, recommend, and act while humans provide oversight and judgment.
This means IT teams are operating at a fundamentally different scale. One engineer can oversee the work of what is, in effect, an entire AI-powered operations crew.
Edwin AI is leading this shift. Built from the ground up to unify observability, event intelligence, and automation under one intelligent system, Edwin applies specialized agents across every phase of the incident lifecycle without losing context.
See Edwin AI’s Agents in Action
Your next major incident is not a question of if, but when. The difference between a quick, contained resolution and a prolonged outage can come down to how fast you can bridge the execution gap.
It’s time to take the next step: Book a live demo and watch how Edwin AI’s agent ecosystem takes you from alert to resolution in a fraction of the time.
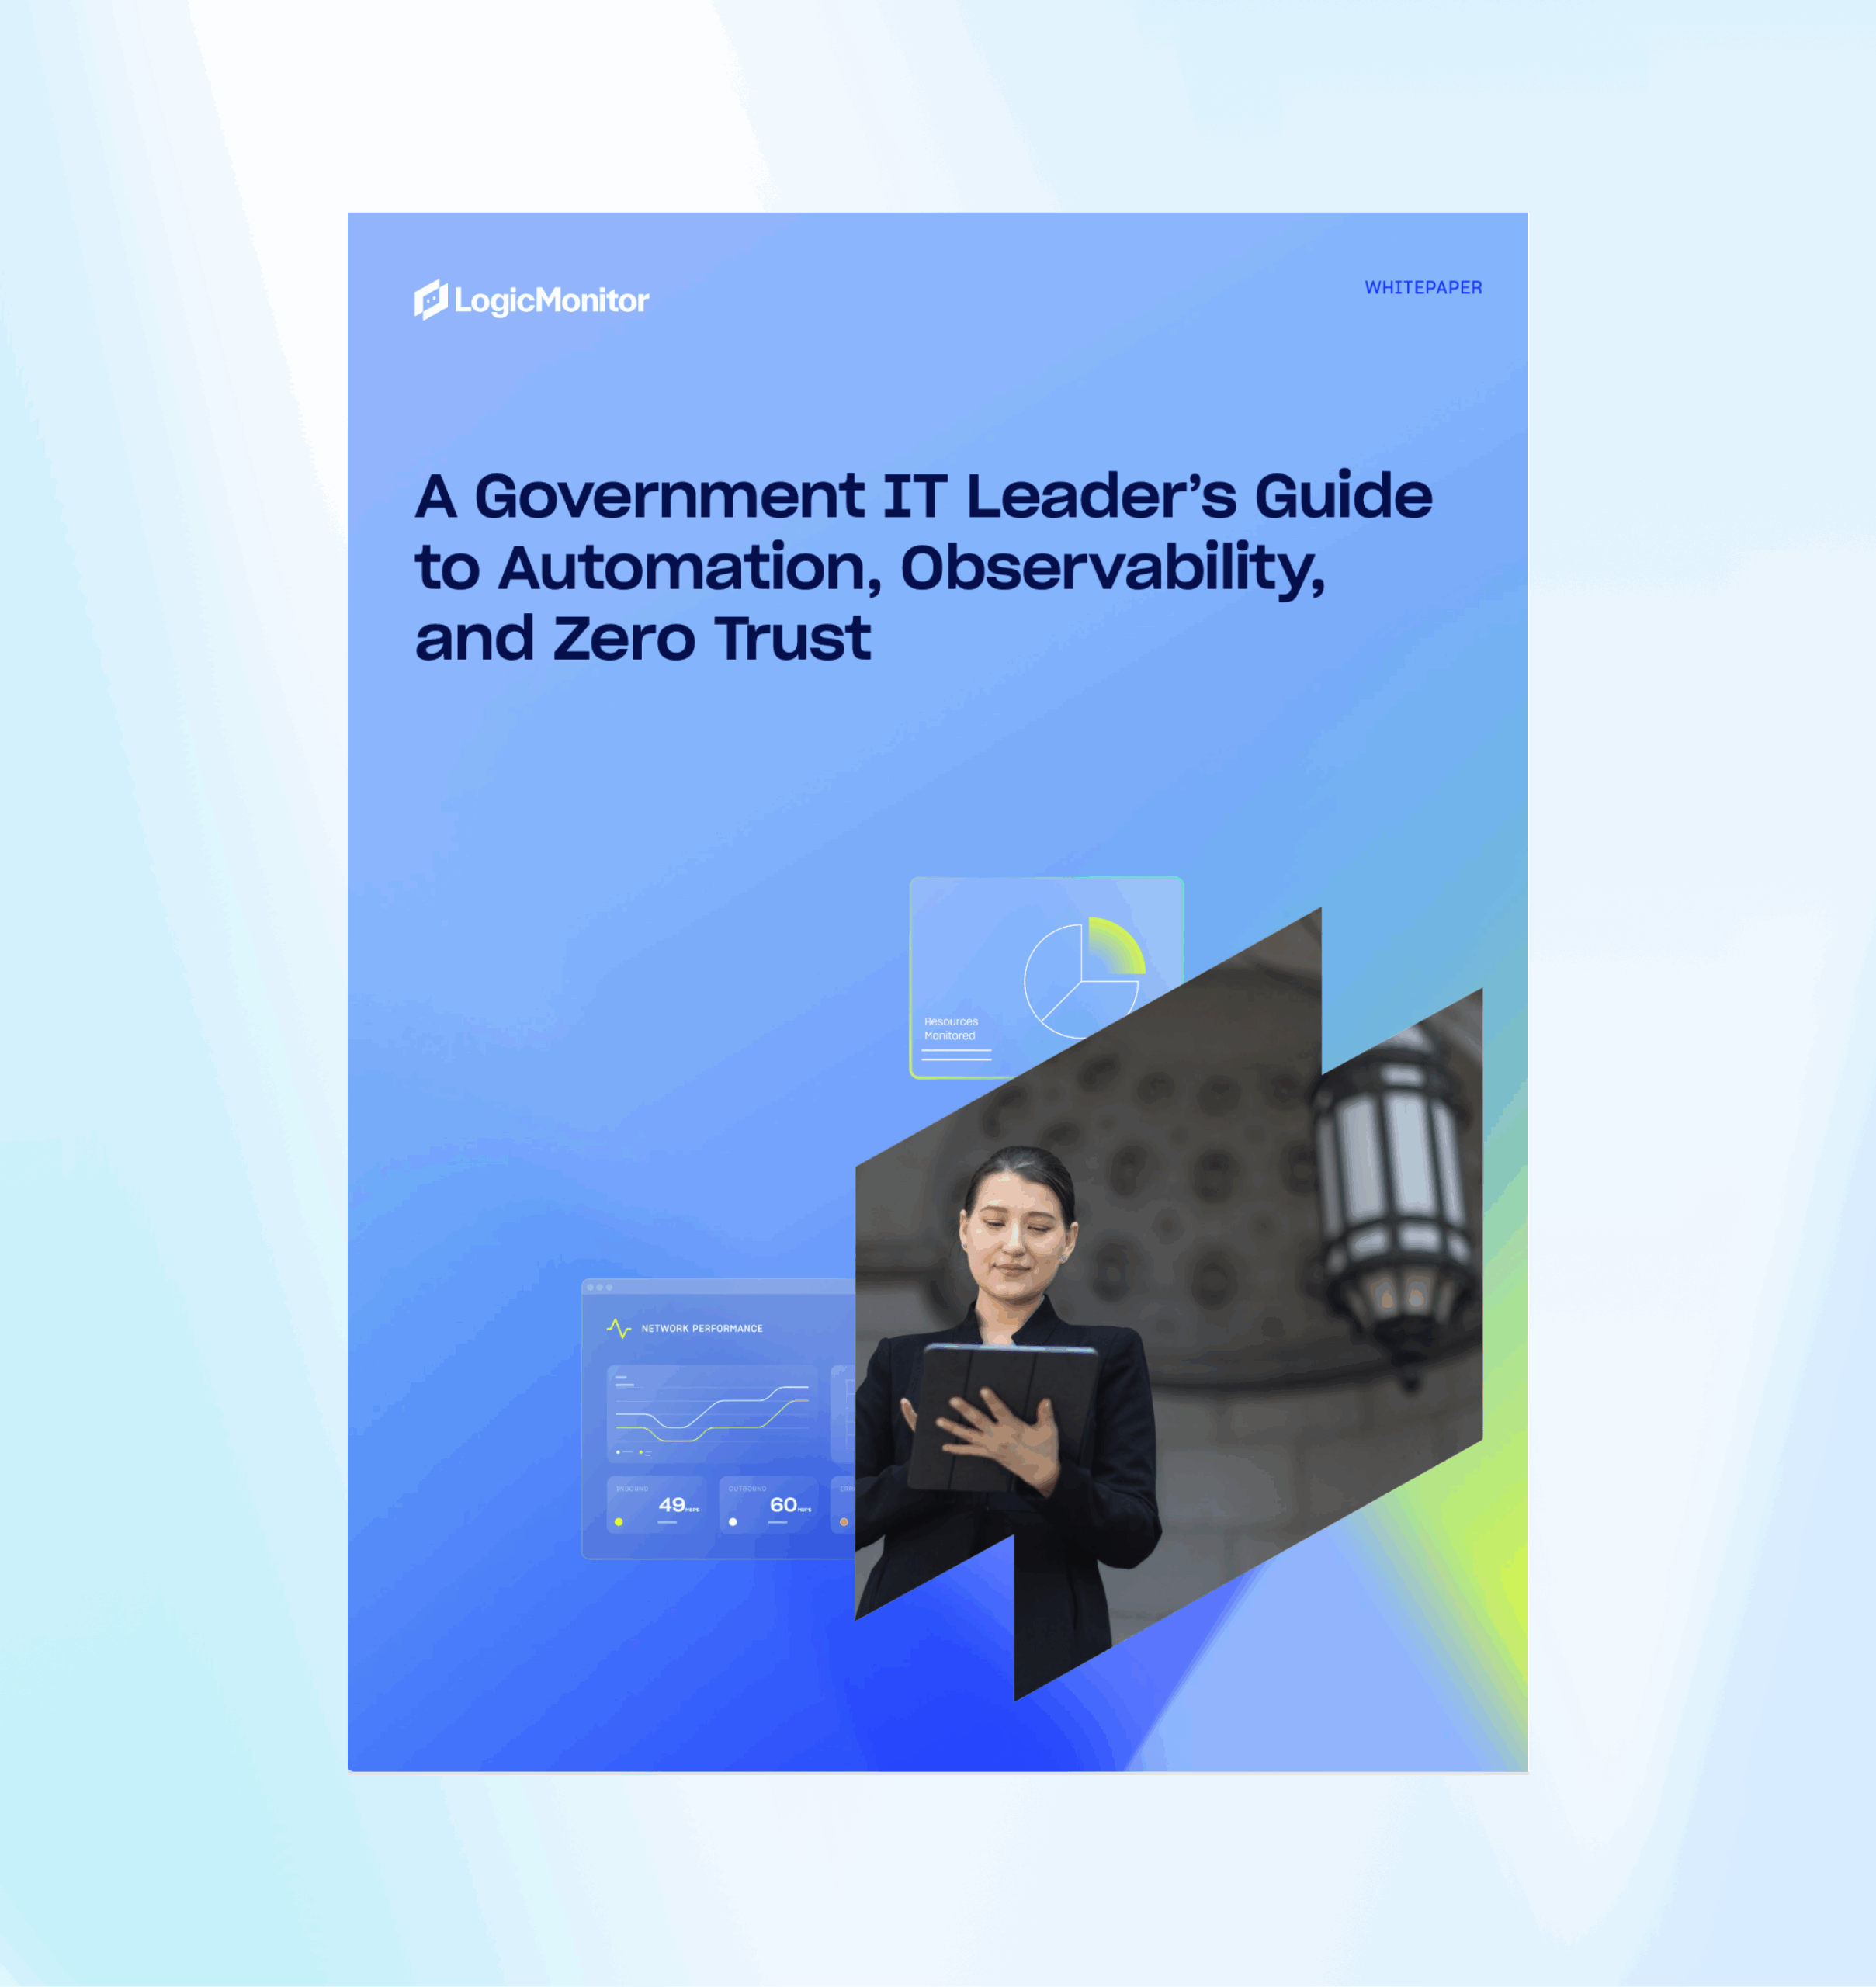
A Government IT Leader’s Guide to Automation, Observability, and Zero Trust
Government IT is at a breaking point. Aging infrastructure, fragmented visibility, rising cyber threats, and tight budgets are pushing public sector teams to the edge.
Our new whitepaper, A Government IT Leader’s Guide to Automation, Observability, and Zero Trust, is designed for public sector IT leaders ready to move from reactive firefighting to proactive resilience. Inside, you’ll discover how forward-thinking agencies are:
Overcoming legacy complexity with hybrid observability powered by AI
Unifying security and compliance through Zero Trust architectures and FedRAMP-ready platforms
Reducing downtime and operational risk with intelligent automation (agentic AIOps)
Delivering secure, uninterrupted digital services that maintain public trust
As a government IT leader, you’ll gain:
A clear view of what’s holding public sector IT back—and how to break through
Practical strategies to achieve real-time visibility across hybrid environments
Insights on integrating automation to speed incident response and reduce alert fatigue
Guidance on implementing Zero Trust while balancing legacy systems and compliance requirements
Move beyond outdated monitoring and siloed tools.
Thank you!
Your video will begin shortly
At LogicMonitor, we believe that shaping the future of Agentic AIOps and observability requires more than just powerful technology. It demands bold perspective, deep market insight, and strategic vision. That’s why we’re excited to welcome Gregg Siegfried, former Gartner Vice President and longtime observability analyst, as our new Head of Market Strategy & Competitive Intelligence.
Gregg brings over 30 years of operating and advisory experience to LogicMonitor, including nearly a decade guiding enterprises through complex decisions in monitoring, AIOps, and IT operations. His appointment signals our deepened commitment to delivering insight-driven innovation in an increasingly dynamic market.
We sat down with Gregg to learn more about his move from Gartner back into operating, his take on observability trends, and what excites him about joining LogicMonitor at this pivotal moment.
Q: After nearly a decade at Gartner, what inspired your move back into operating—and why LogicMonitor?
Gregg: I’m a builder. Most of my career has involved creating or operating software products and services. Gartner is a wonderful place to work, and it absolutely reshaped my approach to technology, but at some point, I realized I missed building. With the industry evolving so rapidly, I realized I wanted to shift from observing change to driving it, and that meant stepping back into an operating role. I began to wonder if I could return to a smaller, more agile environment.
LogicMonitor has exactly the right combination of size, stability, and potential to capture my interest. The team is exceptional. The platform is helping customers not only monitor infrastructure but optimize, automate, and scale it in ways that weren’t possible even a few years ago. When I saw how it’s powering digital transformation for global brands, I knew I wanted to be part of that story. And Christina [Kosmowski, CEO]—well, she can be very convincing, as you probably know.
Q: From your vantage point, what are the most exciting—and most overhyped—trends in observability right now?
Gregg: Agentic AI probably fits both categories. AI has moved incredibly fast, and it’s hard not to be impressed by what LLMs are already enabling. But hype can outpace reality. I’m also closely watching OpenTelemetry’s momentum—adoption is accelerating, and its stability has improved dramatically.
More broadly, I’m excited by how observability is expanding to touch things like incident response and progressive delivery. I’ve long been a proponent of autonomous IT operations, and it’s finally starting to feel within reach, assuming we can move beyond rule-based AI systems to agent-first ones that can take action. Also, of course, we have to have that unified data context to bring the telemetry and observability dataset together with external ITOps context to power a unified knowledge graph. This does require a level of collaboration across the vendor ecosystem that’s incredibly diverse right now—there’s something for everyone.
Q: Your role at LogicMonitor spans market strategy and competitive intelligence. How do you separate signal from noise in such a fast-moving space?
Gregg: Ask me again in a few months! But seriously, my experience leading Magic Quadrants taught me how to filter overwhelming volumes of input—vendors, clients, noise—and zero in on what really matters to customers looking to achieve outcomes for their organizations. Sometimes, what isn’t being talked about is more important than what is.
I’m especially excited that there’s such strong internal AI adoption at LogicMonitor, stemming from the OpenAI collaboration. These days, it’s not that we have too little data—we often have too much. Partnering with teams across Sales, Product, Engineering, and Marketing will be essential to ensure we’re always reading the right signals.
Q: How do technologies like OpenTelemetry, eBPF, and AI figure into the future of observability?
Gregg: The future of telemetry acquisition is open source—and right now, that means OpenTelemetry. Robust OTel support is already “table stakes.” Differentiation in this space is shifting toward analysis, insights, and automation.
eBPF is fascinating. It enables safe code execution in the Linux kernel and powers some slick instrumentation use cases. For example, some tools can now auto-instrument applications without touching the code—collecting traces, logs, and metrics directly from the kernel.
And with AI, it’s a double-edged sword. Observability platforms will increasingly depend on AI for anomaly detection, adaptive thresholds, and GenAI-based insights. And the future lies with agentic AIOps. But at the same time, we also need to be thinking about how we observe AI and agents. LLM-based apps can seem healthy by traditional metrics but deliver nonsense due to hallucinations or drift—a nontrivial observability challenge.
Q: What’s one piece of advice you’d give to enterprise teams navigating today’s complex observability stacks?
Gregg: Simplify. Rationalize. Most teams don’t need 10 or 20 monitoring tools anymore. And having all these tools will only slow you down more as the IT environment gets more complex. Today’s platforms are powerful—the challenge is understanding how your systems interact. Reducing tool sprawl makes those relationships much clearer. That’s where resilience lives.
Q: And finally — what keeps you grounded outside of work?
Gregg: My family, absolutely. I’ve spent the last decade living in a forest, and nature’s constant change is incredibly grounding. I recharge through music—playing, listening, traveling to shows. I also volunteered as an EMT for years. That work puts “IT emergencies” into perspective pretty quickly.
Looking Ahead
Gregg’s arrival comes at a transformational moment—not just for LogicMonitor, but for the entire observability category. As we invest in AI-powered insight, open standards like OpenTelemetry, and platform-wide simplification, Gregg will be instrumental in ensuring our strategy stays sharp, differentiated, and customer-led.
We’re thrilled to welcome him to the team.
👉 Connect with Gregg on LinkedIn 📢 Stay tuned for more from Gregg in upcoming analyst and industry briefings.
Raconteur: Unlocking the strategic CIO
Tips, tricks, and key concepts for IT organizations looking to start their journey to an observable future.
This report from Raconteur explores how observability powered by automation can allow CIOs to become truly strategic and drive better experiences for customers and employees.
In this report, Raconteur explores:
The rise of the experience-first CIO
Reaching a world of true observability
Linking ITOps and DevOps
Raising the profile of IT
The risks and rewards of IT automation
Download the report
Thank you!
Your video will begin shortly
Report
2024 G2 Grid® Report for Enterprise Monitoring
See how LogicMonitor, Dynatrace, Splunk and other top vendors stack up in this comprehensive report by G2, the world’s largest B2B software review platform.
This third-party comparison of enterprise monitoring software is based on real customer reviews and dives into customer satisfaction ratings related to:
Ease of implementation (ease of setup, implementation time, and more).
Feature comparison (functionality and management).
Relationship ratings (ease of doing business, quality of support, and more).
Here’s what’s inside the report:
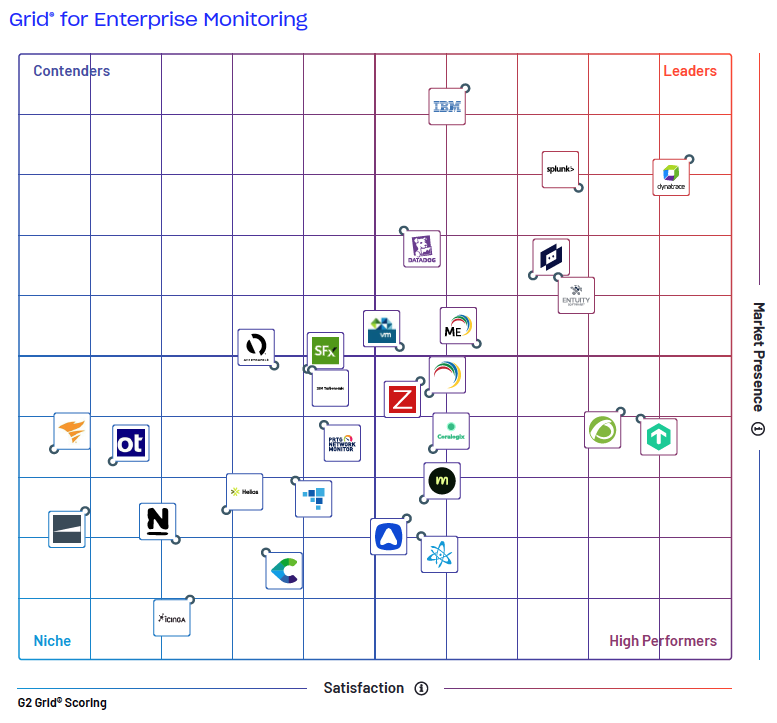
G2 Grid® for Enterprise Monitoring: A comprehensive overview of the Enterprise Monitoring Software landscape from validated, third-party data.
Head-to-Head Product Comparisons: How the enterprise monitoring softwares stack up in terms of customer segments, implementation, user adoption and ROI.
Real User Testimonials: Don’t take it from us. Find out why other IT Pros are turning to LogicMonitor.
Download report
Solution brief
LM Infrastructure Product Brief
LM Infrastructure
LogicMonitor’s SaaS-based infrastructure monitoring provides comprehensive visibility into infrastructure topology, availability, and performance with correlation across dynamic IT infrastructure devices and resources. From data centers to public/private clouds; experience predictive insights and intelligent troubleshooting to scale, optimize costs, and innovate for maximum enterprise productivity. Read the product brief to learn more!