These days many IT Operations teams have gotten very sophisticated in the ways they talk about availability, SLAs, SLOs (Service Level Objectives), and even more nuanced measures of reliability. But when websites or services go down, even briefly, “uptime” is still the number you’re explaining to execs, customers, or incident review boards.
In reality, keeping a service up is table stakes. It’s the minimum expected from any ops team. But hitting that 99.99% isn’t automatic. That’s why we built LM Uptime: to make it easier than ever before for ITOps to monitor web and endpoints.
What is LM Uptime?
LM Uptime integrates web and ping checks directly into LogicMonitor’s unified observability platform, LM Envision, bringing full-stack, platform-native visibility to your web and endpoint monitoring. You can monitor your websites and services–whether external or internal –on your private network, from worldwide locations, and from within your private networks.
Why It Matters Now
Downtime can be a significant financial cost for your organization. It also erodes trust. As your infrastructure grows increasingly complex and more distributed, your critical services span cloud, on-prem, and third-party systems. You need a solution that can verify availability from where it matters most: the user’s point of view.
LM Uptime gives your team the proactive edge. Whether you’re defending uptime, preparing for audits, or responding to incidents, this solution ensures you’re never in the dark when it matters most.
LM Uptime delivers:
Smarter Monitoring: All datapoints support alerting, with dynamic thresholds, flexible graphing, and full dashboard/widget compatibility.
Operational Simplicity: Alert routing, group inheritance, and property management now work just like with devices, reducing support burden and setup time.
Service Integration: Uptime checks can be added to Services, linking performance to business outcomes—something other tools don’t do.
Future-Readiness: This shift sets the stage for better correlation, reporting, and AI insights across all resources.
How LM Uptime Works
LM Uptime executes checks against your website and services from LogicMonitor’s worldwide resource monitoring locations, delivering an outside-in view of your externally-accessible services. For websites and resources available only within your private networks, LM Uptime runs checks from inside the network using the existing collectors in LogicMonitor.
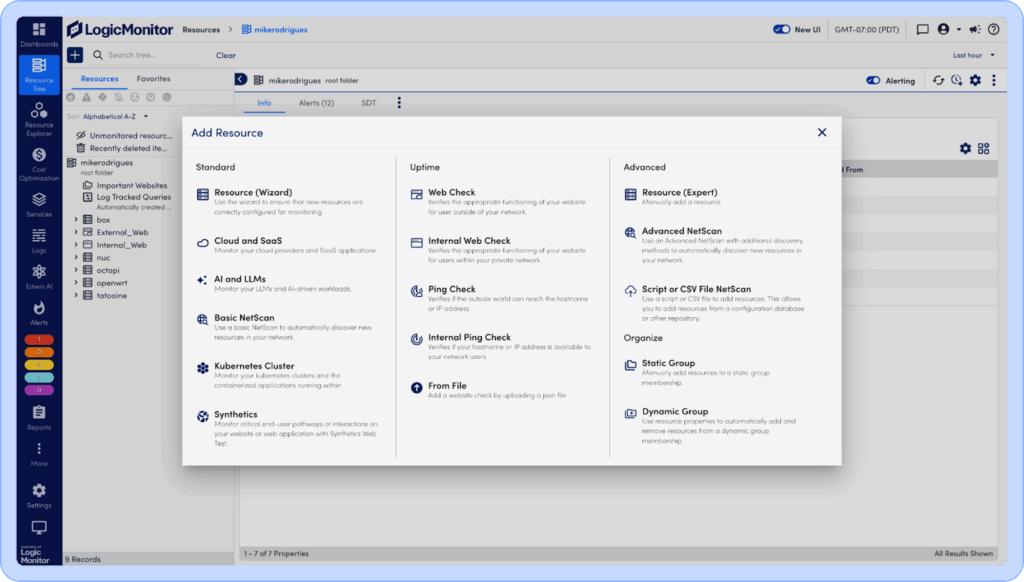
To create an LM Uptime Check, it’s as easy as adding any other resource. Go to the Resource Tree and press the Add Resource (+) button and choose a type of Uptime Check:
For web and ping checks, you create checks that are executed from outside of your network, and internal checks that are performed from within your private network.
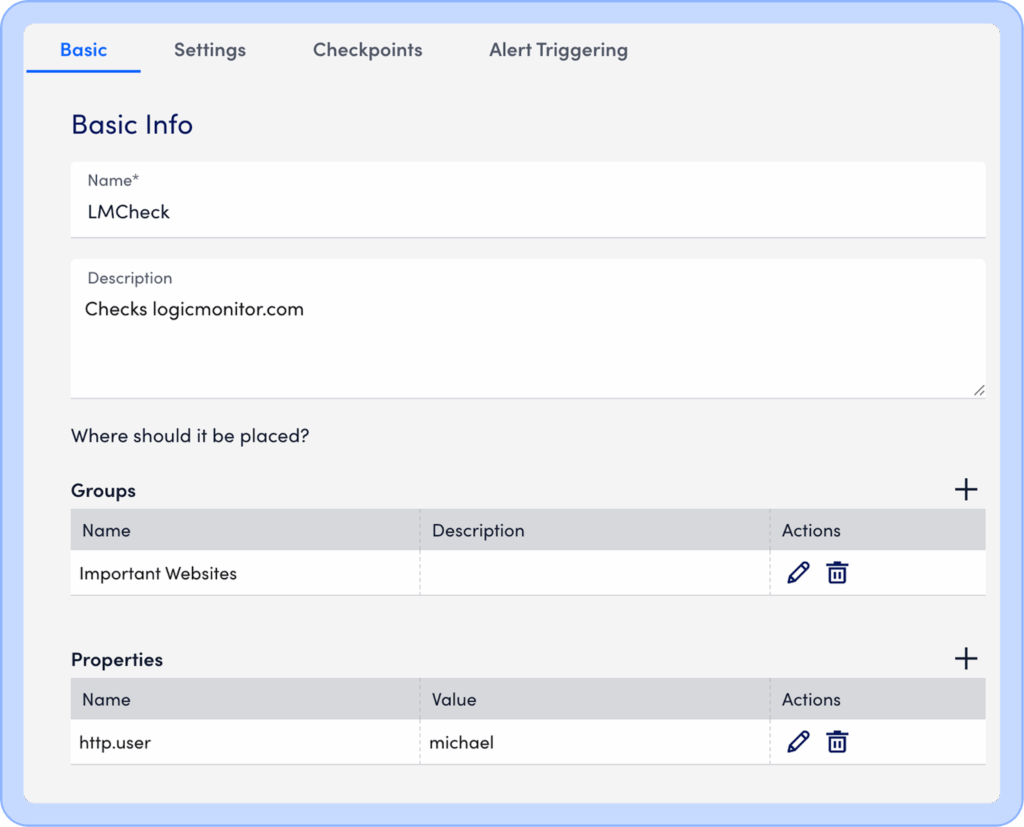
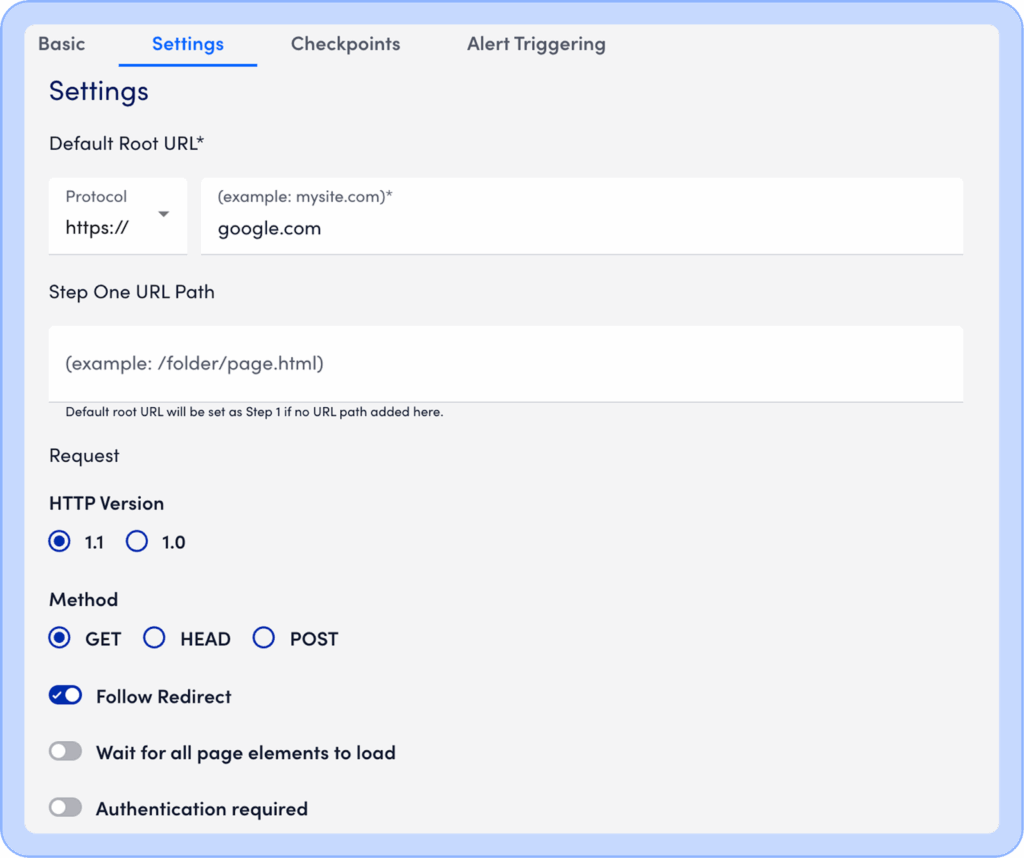
Next set the basic information for the check, including the base URL and paths to check.
Add steps to the check
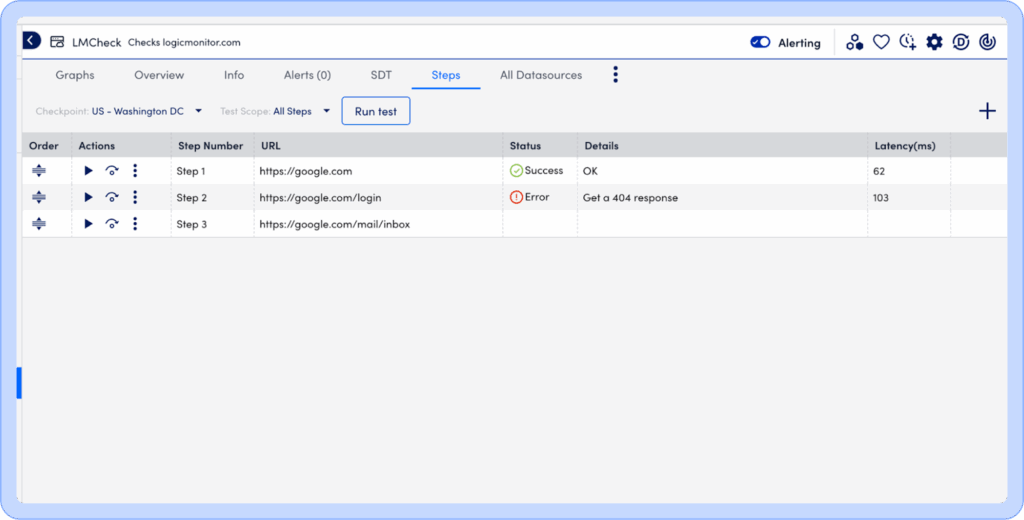
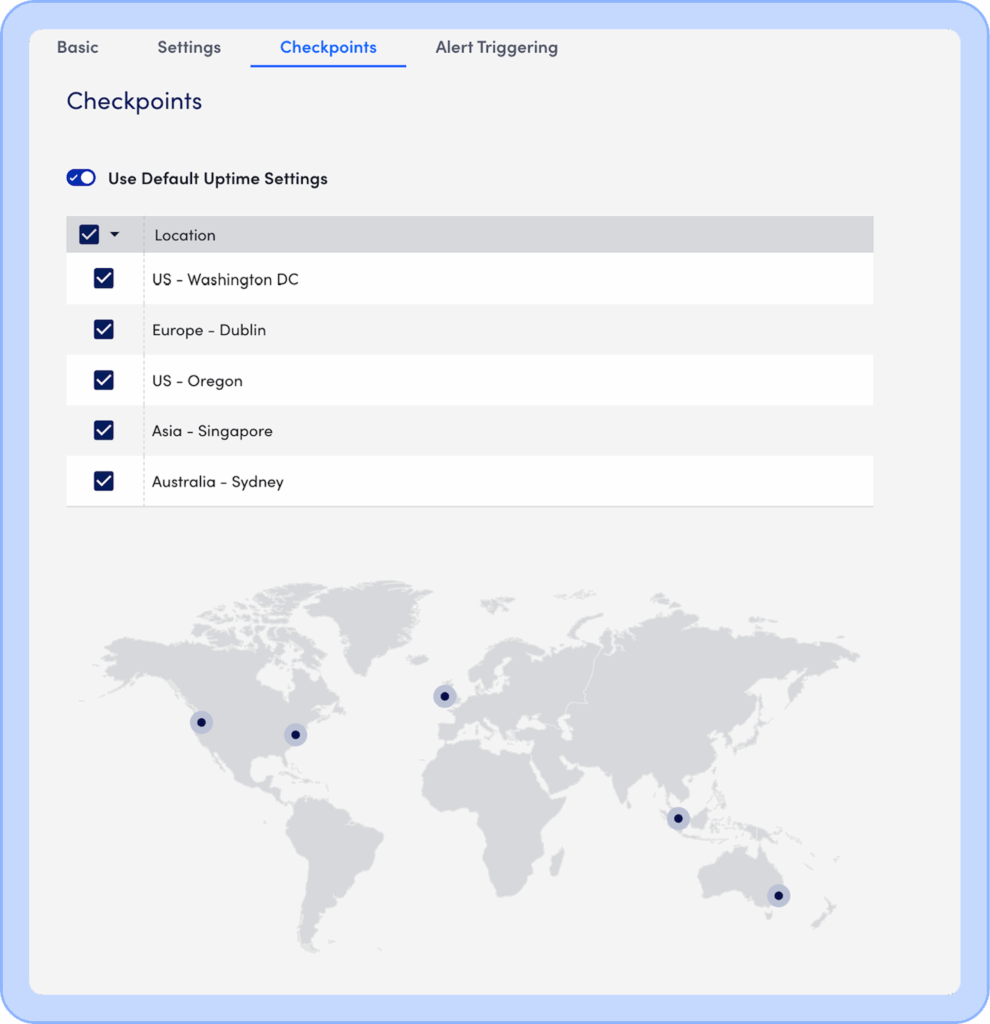
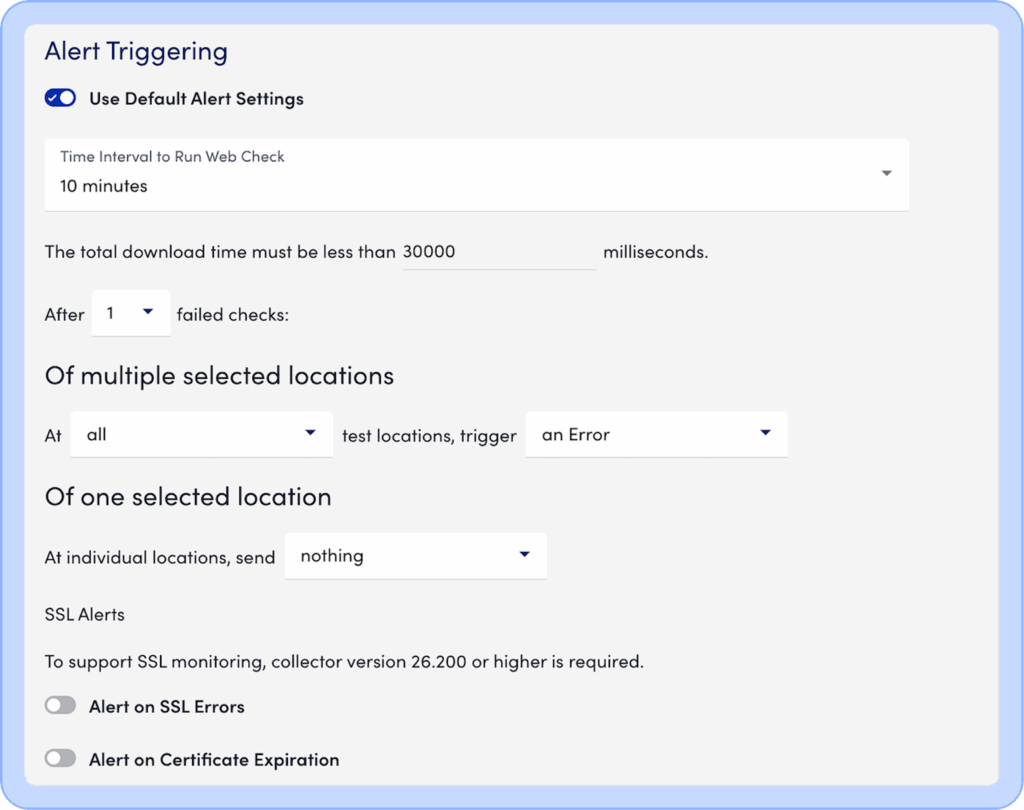
Then pick the locations and the trigger conditions:
Once these are set up, you will be able to visualize and monitor your websites as resources, which gives you:
More flexible alert tuning across a wider set of datapoints
Same property system as Resources
Static & Dynamic Grouping with all your other Resources
Dashboard widgets that weren’t compatible with legacy websites
Ability to include in Resource Reports
Native service integration with websites as members of Service Insights
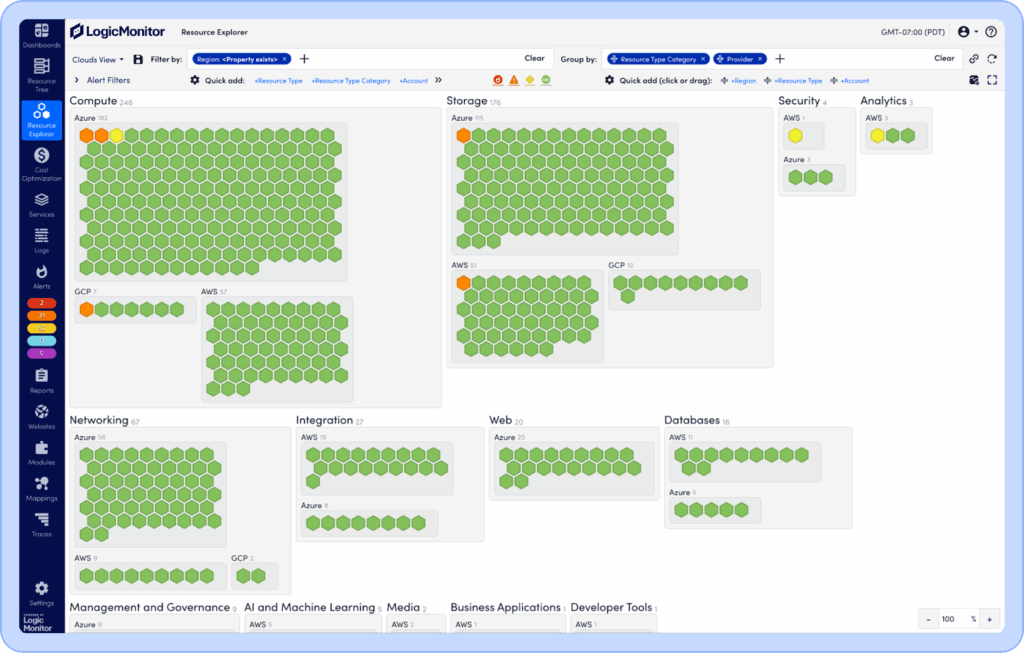
See the state of all of your resources, including websites, together in the Resource Explorer
How We Stack Up Against the Competition
What sets LM Uptime apart from other web monitoring tools is its simplicity to set up and use as well as the end-to-end visibility and value it returns by monitoring websites and all of the resources on which they depend on a single platform. Since LM Uptime is part of LM Envision, you can monitor web, infrastructure, cloud, and network resources without switching between tools. You get a single observability platform with a unified interface.
Pricing and Getting Started
LM Uptime is included in LogicMonitor Advanced and Signature platform packages, and also available as a standalone product.
Start monitoring your web sites and services with your hybrid infrastructure now