FEATURE AVAILABILITY: Dependent Alert Mapping is available to users of LogicMonitor Enterprise.
Overview
Dependent Alert Mapping leverages the auto-discovered relationships among your monitored resources, as discovered by LogicMonitor’s topology mapping AIOps feature, to determine the root cause of an incident that is impacting dependent resources.
When enabled for your alerting operations, Dependent Alert Mapping highlights the originating cause of the incident, while optionally suppressing notification routing for those alerts determined to be dependent on the originating alert. This can significantly reduce alert noise for events in which a parent resource has gone down or become unreachable, thus causing dependent resources to go into alert as well.
How Dependent Alert Mapping Works
During an alert storm, many alerts relating to the same originating incident are raised in LogicMonitor and a slew of notifications may be sent out based on alert rule settings for each metric threshold that is exceeded. This can result in a flood of notifications for resources affected by the incident without a clear indication of which resources are the root cause of the incident.
Enabling Dependent Alert Mapping addresses this issue through the following process:
- Identifying unreachable alerts for resources in a dependency chain. Dependent Alert Mapping is based on topology relationships. If a resource that is part of an identified dependency chain goes down or becomes unreachable, its alerts are flagged for Dependent Alert Mapping. A resource is considered down or unreachable when an alert of any severity level is raised for it by the PingLossPercent or idleInterval datapoints, which are associated with the Ping and HostStatus DataSources respectively.
- Delaying routing of alert notifications (optional). When a resource in the dependency chain goes down or becomes unreachable, this first “reachability” alert triggers all resources in the chain to enter a delayed notification state. This state prevents immediate routing of alert notifications and provides time for the incident to fully manifest and for the Dependent Alert Mapping algorithm to determine the originating and dependent causes.
- Adding dependency role metadata to alerts. Any resource in the dependency chain with a reachability alert is then identified as a parent node or suppressing node to its dependent child or suppressed nodes. This process adds metadata to the alert identifying the alert’s dependency role as either originating or dependent. This role provides the data needed for suppressing dependent alert notifications.
- Suppressing routing of alert notifications (optional). Those alerts identified as dependent are not routed, thus reducing alert noise to just those alerts that identify originating causes. (Dependent alerts still display in the LogicMonitor interface; only notification routing is suppressed.)
- Clearing of alerts across dependency chain. When the originating reachability alerts begin to clear, all resources in the dependency chain are once again placed into a delayed notification state to allow time for the entire incident to clear. After five minutes, any remaining alerts will then be routed for notification or, if some resources are still unreachable, a new Dependent Alert Mapping incident is initiated for these devices and the process repeats itself.
Requirements for Dependent Alert Mapping
For dependent alert mapping to take place, the following requirements must be met.
Unreachable or Down Resource
To trigger dependent alert mapping, a resource must be unreachable or down, as determined by an alert of any severity level being raised on the following datapoints:
- PingLossPercent (associated with the Ping DataSource)
- idleInterval (associated with the HostStatus DataSource)
Note: Dependent Alert Mapping is currently limited to resources and does not extend to instances. For example, a down interface on which other devices are dependent for connectivity will not trigger Dependent Alert Mapping.
Topology Prerequisite
Dependent Alert Mapping relies on the relationships between monitored resources. These relationships are automatically discovered via LogicMonitor’s topology mapping feature. To ensure this feature is enabled and up to date, see Topology Mapping Overview.
Performance Limits
Dependent Alert Mapping has the following performance limits:
- Default number of dependent nodes (total): 10,000 Devices
- Topology Connections used for Dependent Alert Mapping: Network, Compute, Routing.
- Topology Device ERT (predef.externalResourceType) excludes: VirtualInstances, AccessPoints, and Unknown.
Configuring Dependent Alert Mapping
Every set of Dependent Alert Mapping configurations you create is associated with one or more entry points. As discussed in detail in the Dependency Chain Entry Point section of this support article, an entry point is the resource at which the dependency chain begins (i.e. the highest level resource in the resulting dependency chain hierarchy); all resources connected to the entry-point resource become part of the dependency chain and are, therefore, subject to Dependent Alert Mapping if any device upstream or downstream in the dependency chain becomes unreachable.
The ability to configure different settings for different entry points provides considerable flexibility. For example, MSPs may have some clients that permit a notification delay but others that don’t due to strict SLAs. Or, an enterprise may want to route dependent alerts for some resources, but not for others.
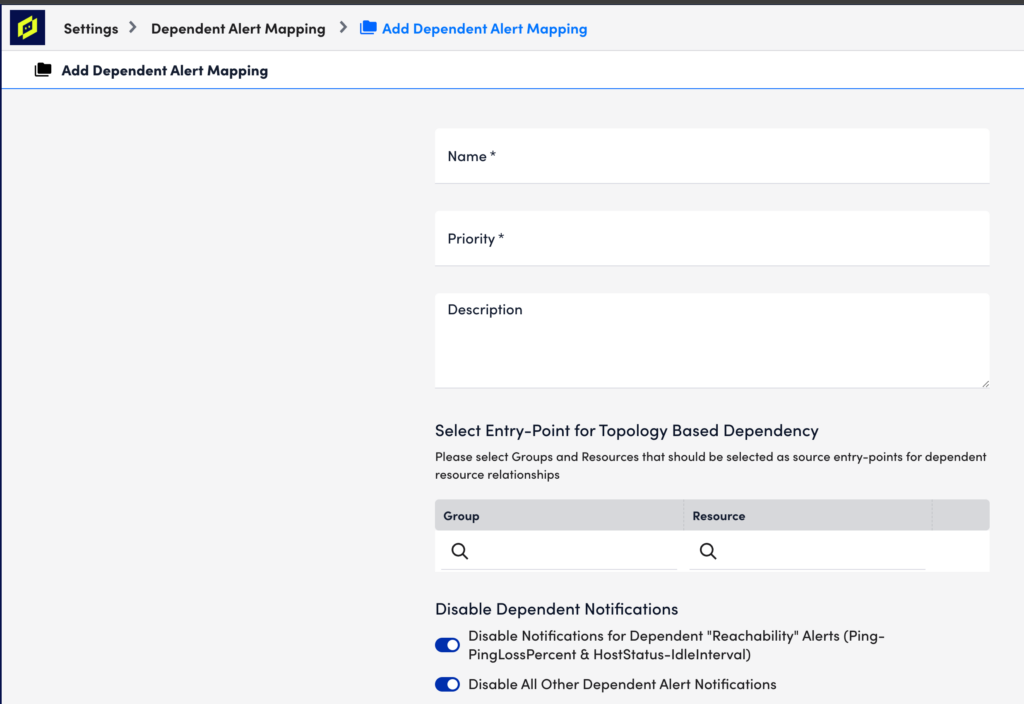
To configure Dependent Alert Mapping, select Settings > Alert Settings > Dependent Alert Mapping | > Add. A dialog appears that allows you to configure various settings. Each setting is discussed next.
Name
In the Name field, enter a descriptive name for the configuration.
Priority
In the Priority field, enter a numeric priority value. A value of “1” represents the highest priority. If multiple configurations exist for the same resource, this field ensures that the highest priority configurations are used. If you are diligent about ensuring that your entry-point selections represent unique resources, then priority should never come into play. The value in this field will only be used if coverage for an entry point is duplicated in another configuration.
Description
In the Description field, optionally enter a description for the configuration.
Entry Point
Under the Select Entry-Point for Topology-Based Dependency configuration area, click the plus sign (+) icon to add one or more groups and/or individual resources that will serve as entry point(s) for this configuration. For either the Group or Resource field, you can enter a wildcard (*) to indicate all groups or all resources. Only one of these fields can contain a wildcard per entry point configuration. For example, selecting a resource group but leaving resources wildcarded will return all resources in the selected group as entry points.
The selection of an entry-point resource uses the topology relationships for this resource to establish a parent/child dependency hierarchy (i.e. dependency chain) for which Dependent Alert Mapping is enabled. If any resource in this dependency chain goes down, it will trigger Dependent Alert Mapping for all alerts arising from members of the dependency chain.
Once saved, all dependent nodes to the entry point, as well as their degrees of separation from the entry point, are recorded in the Audit Log, as discussed in the Dependent Alert Mapping Detail Captured by Audit Log section of this support article.
Note: The ability to configure a single set of Dependent Alert Mapping settings for multiple entry points means that you could conceivably cover your entire network with just one configuration.
Guidelines for Choosing an Entry Point
When possible, you should select the Collector host as the entry point. As the location from which monitoring initiates, it is the most accurate entry point. However, if your Collector host is not in monitoring or if its path to network devices is not discovered via topology mapping, then the closest device to the Collector host (i.e. the device that serves as the proxy or gateway into the network for Collector access) should be selected.
In a typical environment, you will want to create one entry point per Collector. The following diagrams offer guidelines for selecting these entry points.
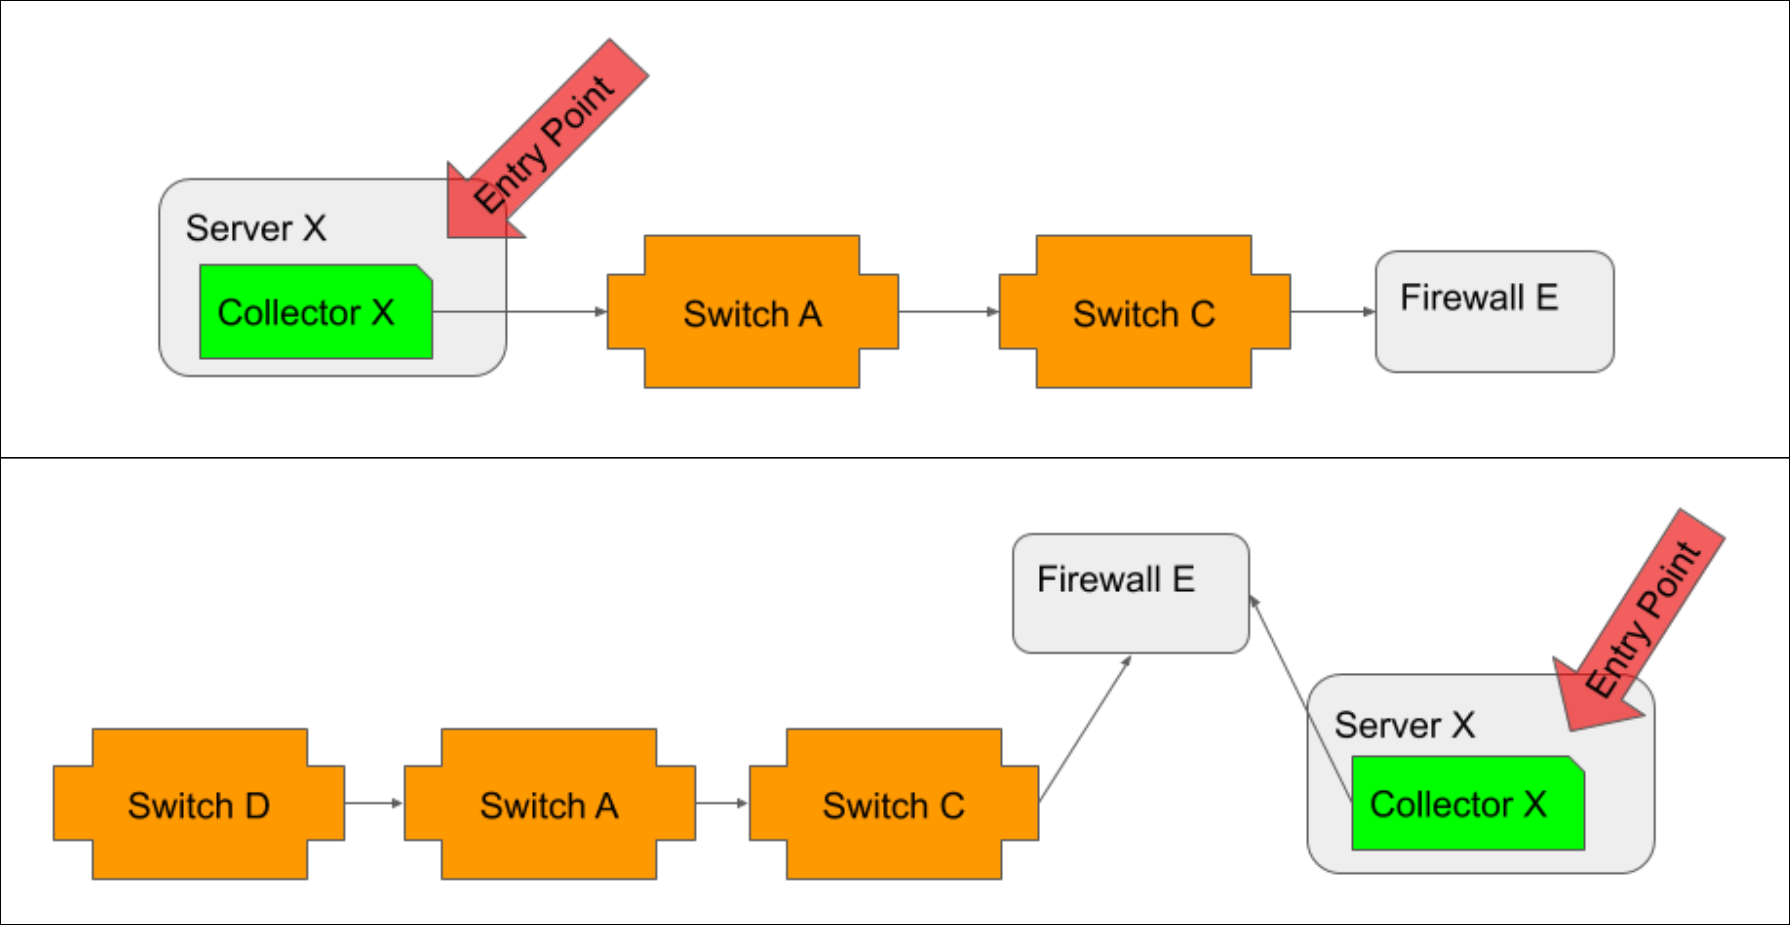
When the Collector host is monitored, and its path to network devices is discoverable via topology, it should be the entry point, regardless of whether it resides inside (illustrated in top example) or outside (illustrated in bottom example) the network.
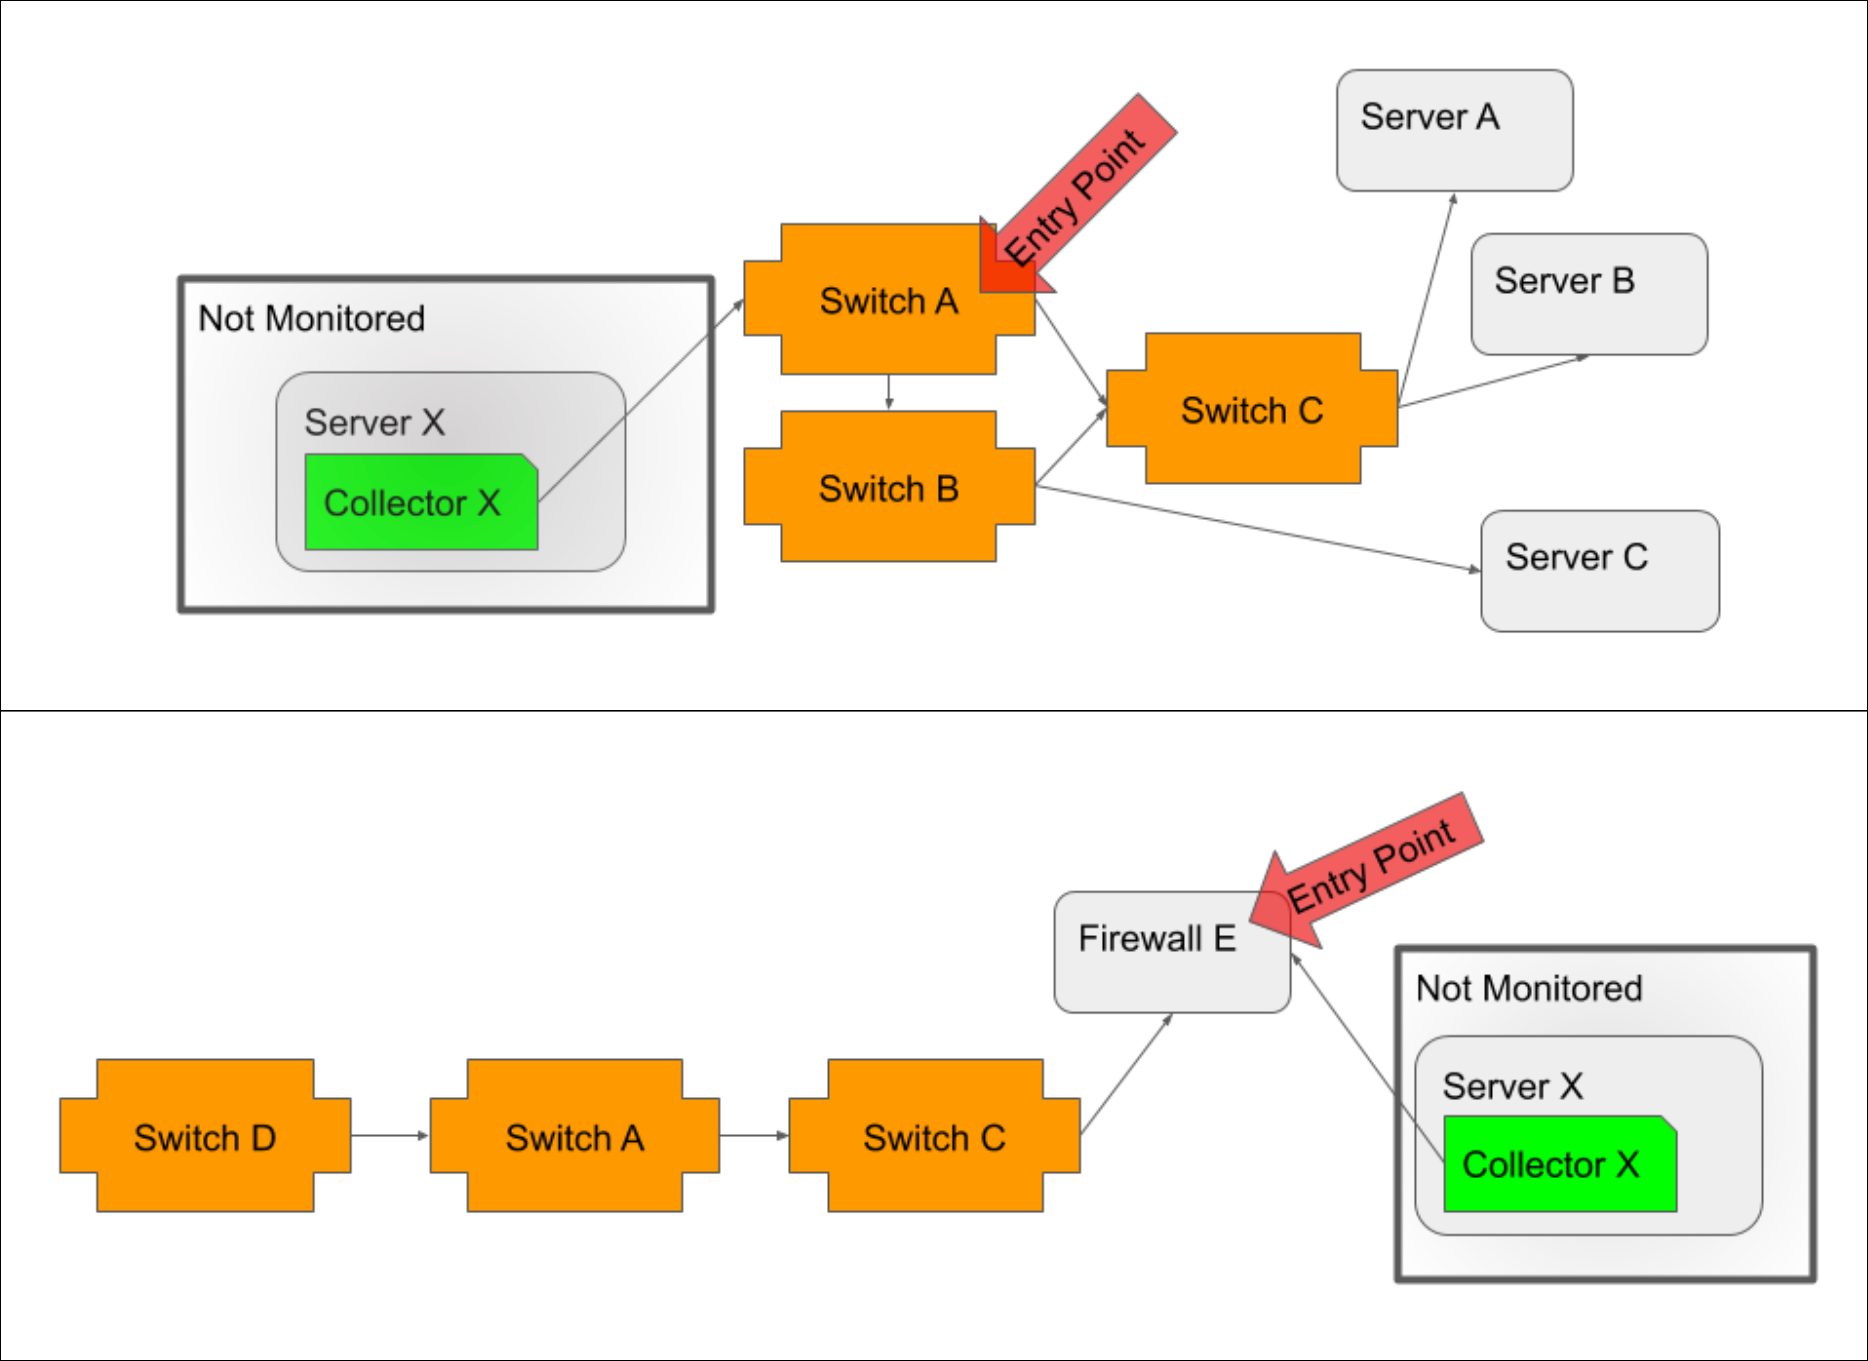
If the Collector host is not monitored, then the device closest to the Collector host, typically a switch/router if the host is inside the network (illustrated in top example) or a firewall if the host is outside the network (illustrated in bottom example), should be selected as the entry point.

If the Collector host is monitored, but its path to network devices is not discoverable via topology, then the device closest to the Collector host that is both monitored and discovered should be selected as the entry point.
Note: To verify that topology relationships are appropriately discovered for the entry point you intend to use, open the entry point resource from the Resources page and view its Maps tab. Select “Dynamic” from the Context field’s dropdown menu to show connections with multiple degrees of separation. See Maps Tab.
Understanding the Resulting Dependency Chain
The selection of an entry-point resource establishes a dependency hierarchy in which every connected resource is dependent on the entry point as well as on any other connected resource that is closer than it is to the entry point. This means that the triggering of Dependent Alert Mapping is not reliant on just the entry point becoming unreachable and going into alert. Any node in the dependency chain that is unreachable and goes into alert (as determined by the PingLossPercent or idleInterval datapoints) will trigger Dependent Alert Mapping.
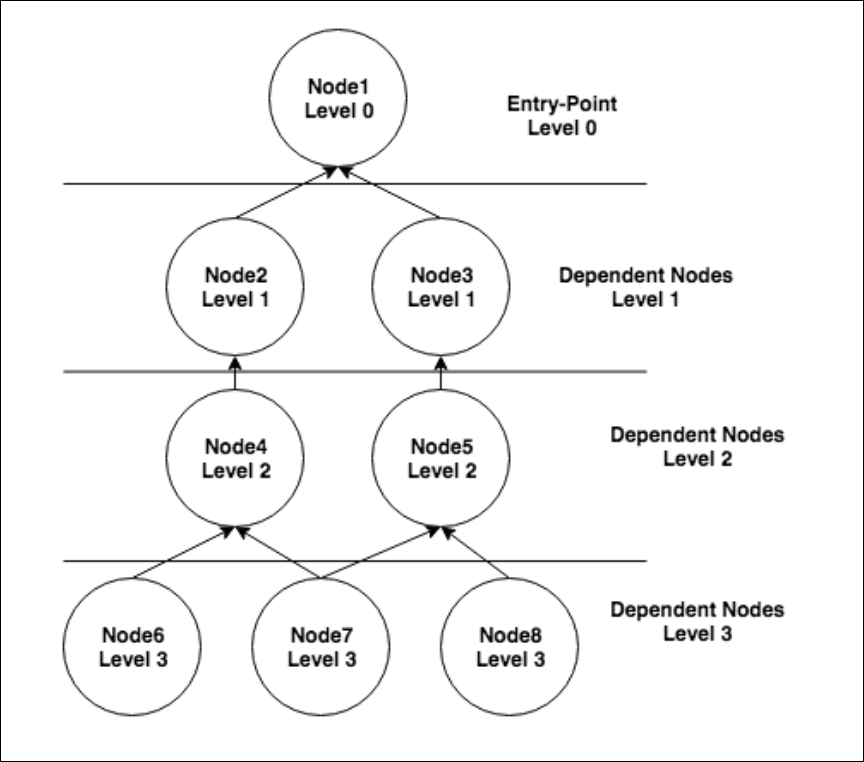
In this example dependency chain, node 1 is the entry point and nodes 2-8 are all dependent on node 1. But other dependencies are present as well. For example, if node 2 goes down and, as a result, nodes 4, 6 and 7 become unreachable, RCA would consider node 2 to be the originating cause of the alerts on nodes 4, 6 and 7. Node 2 would also be considered the direct cause of the alert on node 4. And node 4 would be considered the direct cause of the alerts on nodes 6 and 7. As discussed in the Alert Details Unique to Dependent Alert Mapping section of this support article, originating and direct cause resource(s) are displayed for every alert that is deemed to be dependent.
Disable Dependent Notifications
Use the following options to suppress notification routing for dependent alerts during a Dependent Alert Mapping incident:
- Disable Notifications for Dependent “Reachability” Alerts (Ping-PingLossPercent & HostStatus-IdleInterval). When checked, this option disables alert notifications for dependent alerts triggered by either the PingLossPercent (associated with the Ping DataSource) or idleInterval (associated with the HostStatus DataSource) datapoints.
- Disable All Other Dependent Alert Notifications. When checked, this option also serves to disable routing for dependent alerts, but not if those dependent alerts are the result of the resource being down or unreachable (as determined by the PingLossPercent or idleInterval datapoints). In other words, notifications for dependent alerts that are triggered by datapoints other than PingLossPercent or idleInterval are suppressed; notifications for dependent alerts that are triggered by PingLossPercent or idleInterval are released for routing.
Most likely, you’ll want to check both options to suppress all dependent alert routing and release only those alerts determined to represent the originating cause. However, for more nuanced control, you can disable only reachability alerts—or only non-reachability alerts. This may prove helpful in cases where different teams are responsible for addressing different types of alerts.
Note: If you want to verify the accuracy of originating and dependent alert identification before taking the potentially risky step of suppressing alert notifications, leave both of these options unchecked to begin with. Then, use the root cause detail that is provided in the alert, as discussed in the Alert Details Unique to Dependent Alert Mapping section of this support article, to ensure that the outcome of Dependent Alert Mapping is as expected.
Routing Delay
By default, the Enable Alert Routing Delay option is checked. This delays alert notification routing for all resources that are part of the dependency chain when an alert triggers Dependent Alert Mapping, allowing time for the incident to fully manifest itself and for the algorithm to determine originating cause and dependent alerts. As discussed in the Viewing Dependent Alerts section of this support article, an alert’s routing stage will indicate “Delayed” while root cause conditions are being evaluated.
If routing delay is enabled, the Max Alert Routing Delay Time field is available. This field determines the maximum amount of time alert routing can be delayed due to Dependent Alert Mapping.
If evaluation is still occurring when the maximum time limit is reached (or if the Enable Alert Routing Delay option is unchecked), notifications will be routed with whatever Dependent Alert Mapping data is available at that time. In the event of no delay being permitted, this will likely mean that no root cause data will be included in the notifications. However, in both cases, as the incident manifests, the alerts will continue to evolve which will result in additional information being added to the alerts and, in the case of those alerts determined to be dependent, suppression of additional escalation chain stages.
Note: Reachability or down alerts for entry point resources are always routed immediately, regardless of settings. This is because an entry-point resource will always be the originating cause, making it an actionable alert and cause for immediate notification.
Viewing Dependent Alerts
Alerts that undergo Dependent Alert Mapping display as usual in the LogicMonitor interface—even those whose notifications have been suppressed as a result of being identified as dependent alerts. As discussed in the following sections, the Alerts page offers additional information and display options for alerts that undergo Dependent Alert Mapping.
Columns and Filters Unique to Dependent Alert Mapping
The Alerts page offers three columns and two filters unique to the Dependent Alert Mapping feature.
Note: The values reported in the Dependent Alert Mapping columns will only display when an alert is active. Once it clears, the values within the column will clear, while the original Dependent Alert Mapping metadata will remain in the original alert message.
Routing State Column
The Routing State column displays the current state of the alert notification. There are three possible routing states:
- Delayed. A “Delayed” routing state indicates that the dependency role of the alert is still being evaluated and, therefore, the alert has not yet been released for routing notification.
- Suppressed. A “Suppressed” routing state indicates that no subsequent alert notification was routed for the alert because it was determined to be dependent and met the notification disabling criteria set for the Dependent Alert Mapping configuration.
- Normal. A “Normal” routing state indicates that the alert notification was released for standard routing as specified by alert rules.
Dependency Role Column
The Dependency Role column displays the role of the alert in the incident. There are three possible dependency roles:
- TBD. A “TBD” dependency role indicates that the incident is still being evaluated and dependency has not yet been determined.
- Originating. An “Originating” dependency role indicates that the alert represents the resource that is the root cause (or one of the root causes) of the incident.
- Dependent. A “Dependent” dependency role indicates that the alert is the result of another alert, and not itself representative of root cause.
Dependent Alerts Column
The Dependent Alerts column displays the number of alerts, if any, that are dependent on the alert. If the alert is an originating alert, this number will encompass all alerts from all resources in the dependency chain. If the alert is not an originating alert, it could still have dependent alerts because any alert that represents resources downstream in the dependency chain is considered to be dependent on the current alert.
Routing State and Dependency Role Filters
LogicMonitor offers two filters based on the data in the Routing State and Dependency Role columns. The criteria for these filters lines up with the values available for each column.
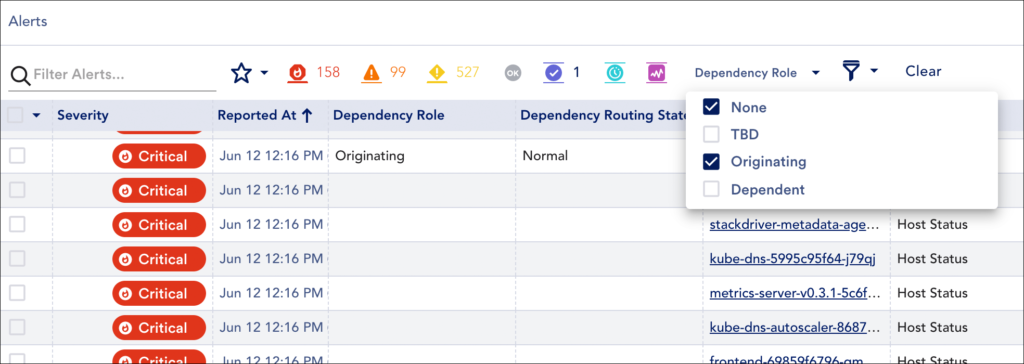
Dependent Alert Mapping algorithm as well as all other alerts across your portal that were never assigned a dependency role (i.e. they didn’t undergo
Dependent Alert Mapping).
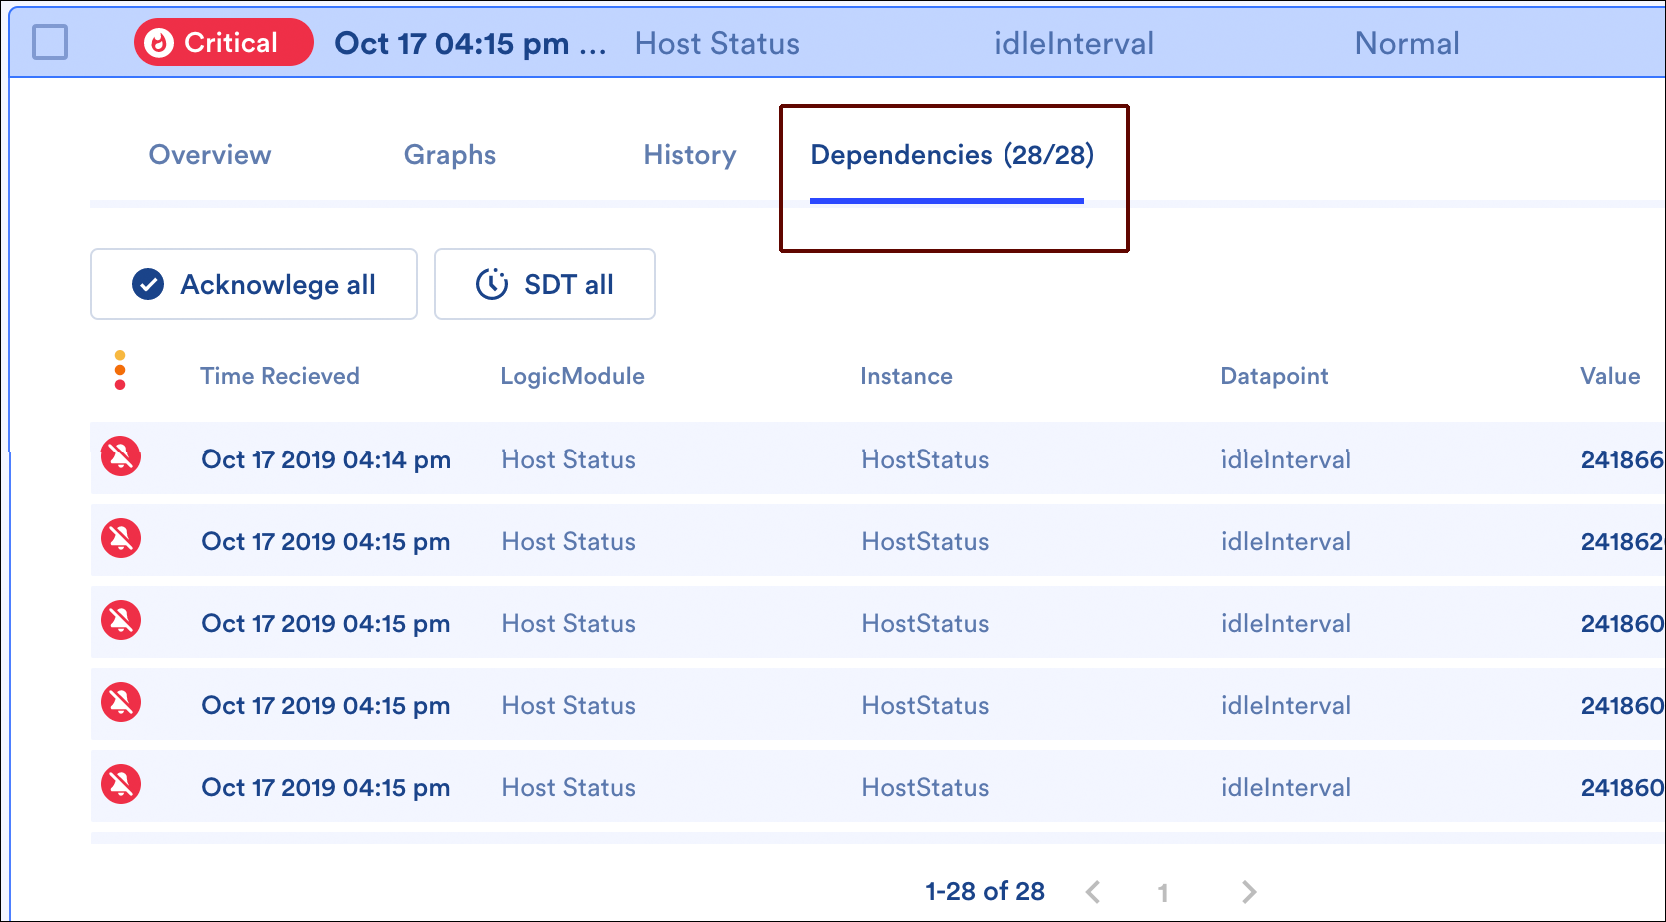
Dependencies Tab
When viewing the details of an alert with dependent alerts (i.e. an originating cause alert or direct cause alert), a Dependencies tab is additionally available. This tab lists all of the alert’s dependent alerts (i.e. all alerts for resources downstream in the dependency chain). These dependent alerts can be acknowledged or placed into scheduled downtime (SDT) en masse using the Acknowledge all and SDT all buttons.
Alert Details Unique to Dependent Alert Mapping
The alert details for an alert that is part of a Dependent Alert Mapping incident carry additional details related to the root cause—these details are present in both the LogicMonitor UI and alert notifications (if routed).
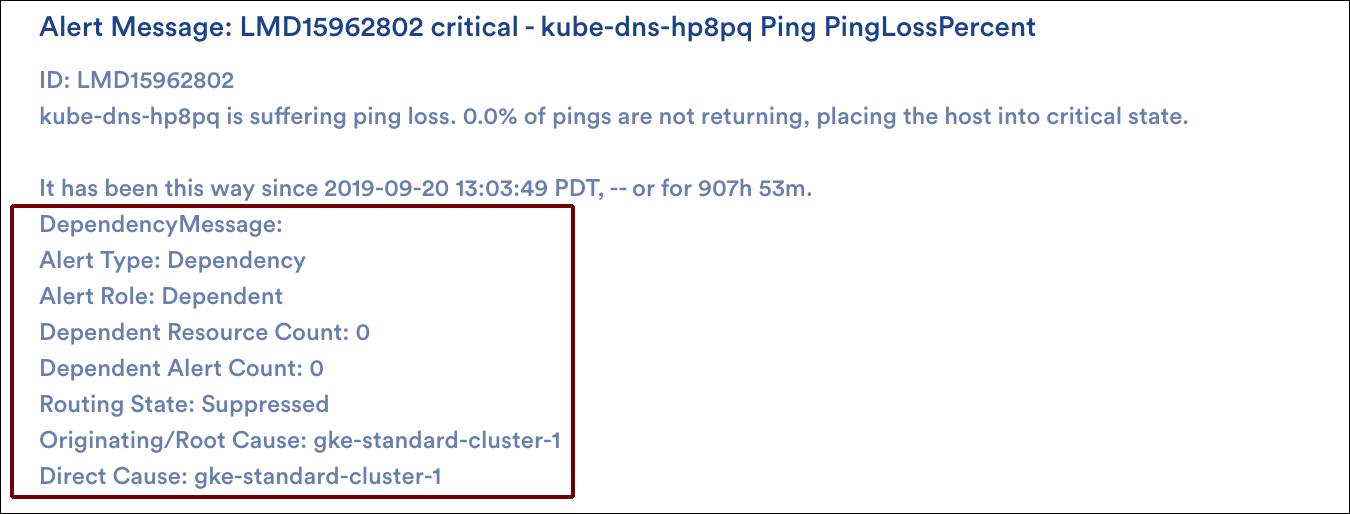
The alert type, alert role, and dependent alert count carry the same details as the columns described in a previous section. If the alert is not the originating alert, then the originating cause and direct cause resource names are also provided. Direct cause resources are the immediate neighbor resources that are one step closer to the entry point on which the given resource is directly dependent.
Dependent Alert Mapping details are also available as tokens. For more information on using tokens in custom alert notification messages, see Tokens Available in LogicModule Alert Messages.
- ##DEPENDENCYMESSAGE##
Represents all dependency details that accompany alerts that have undergone Dependent Alert Mapping
- ##ALERTDEPENDENCYROLE##
- ##DEPENDENTRESOURCECOUNT##
- ##DEPENDENTALERTCOUNT##
- ##ROUTINGSTATE##
- ##ORIGINATINGCAUSE##
- ##DIRECTCAUSE##
Dependent Alert Mapping Detail Captured by Audit Log
Approximately five minutes after saving a Dependent Alert Mapping configuration, the following information is captured in LogicMonitor’s audit logs for the “System:AlertDependency” user:
Entry Point(type:name(id):status:level:waitingStartTime):
Nodes In Dependency(type:name(id):status:level:waitingStartTime:EntryPoint):
Where:
- status (of the node or entry point) is Normal|WaitingCorrelation|Suppressing|Suppressed|WaitingClear
- level is the number of steps the node is removed from the entry point (always a value of 0 for the entry point)
- waitingStartTime is the start of delay if node is in a status state of “WaitingCorrelation”
For more information on using the audit logs, see About Audit Logs.
Modeling the Dependency Chain
Using the entry point and dependent nodes detail captured by the audit logs (as discussed in the previous section), you may want to consider building out a topology map that represents the entry point(s) and dependent nodes of your Dependent Alert Mapping configuration. Because topology maps visually show alert status, this can be extremely helpful when evaluating an incident at a glance. For more information on creating topology maps, see Mapping Page.
Role-Based Access Control
Like many other features in the LogicMonitor platform, Dependent Alert Mapping supports role-based access control. By default, only users assigned the default administrator or manager roles will be able to view or manage Dependent Alert Mapping configurations. However, as discussed in Roles, roles can be created or updated to allow for access to these configurations.
Dynamic thresholds represent the bounds of an expected data range for a particular datapoint. Unlike static datapoint threshold which are assigned manually, dynamic thresholds are calculated by anomaly detection algorithms and continuously trained by a datapoint’s recent historical values. For more information, see Static Datapoint Thresholds.
When dynamic thresholds are enabled for a datapoint, alerts are dynamically generated when these thresholds are exceeded. In other words, alerts are generated when anomalous values are detected.
Dynamic thresholds detect the following types of data patterns:
- Anomalies
- Rates of change
- Seasonality (daily/weekly) trends
Dynamic thresholds (and their resulting alerts) are automatically and algorithmically determined based on the history of a datapoint, they are well suited for datapoints where static thresholds are hard to identify (such as when monitoring number of connections, latency, and so on) or where acceptable datapoint values aren’t necessarily uniform across an environment.
For example, consider an organization that has optimized its infrastructure so that some of its servers are intentionally highly utilized at 90% CPU. This utilization rate runs afoul of LogicMonitor’s default static CPU thresholds which typically consider ~80% CPU (or greater) to be an alert condition. The organization could take the time to customize the static thresholds in place for its highly-utilized servers to avoid unwanted alert noise or, alternately, it could globally enable dynamic thresholds for the CPU metric. With dynamic thresholds enabled, alerting occurs only when anomalous values are detected, allowing differing consumption patterns to coexist across servers.
For situations like this one, in which it is more meaningful to determine if a returned metric is anomalous, dynamic thresholds have tremendous value. Not only will they trigger more accurate alerts, but in many cases issues are caught sooner. In addition, administrative effort is reduced considerably because dynamic thresholds require neither manual upfront configuration nor ongoing tuning.
Training Dynamic Thresholds
Dynamic thresholds require a minimum of 5 hours of training data for DataSources with polling intervals of 15 minutes or less. As more data is collected, the algorithm is continuously refined, using up to 15 days of recent historical data to inform its expected data range calculations.
Daily and weekly trends also factor into dynamic threshold calculations. For example, a load balancer with high traffic volumes Monday through Friday, but significantly decreased volumes on Saturdays and Sundays, will have expected data ranges that adjust accordingly between the workweek and weekends. Similarly, dynamic thresholds would also take into account high volumes of traffic in the morning as compared to the evening. A minimum of 2.5 days of training data is required to detect daily trends and a minimum of 9 days of data is required to detect weekly trends
Requirements for Adding Dynamic Thresholds
To add threshold values, you need the following:
- A user with the “Threshold” and “Manage” permissions set at the Resource group level.
- If your environment leverages Access Groups for modules, the user must have the “Resources: Group Threshold” permission set.
Adding Dynamic Thresholds at Global DataSource Definition Level
- In LogicMonitor, navigate to Resources Tree > Resources.
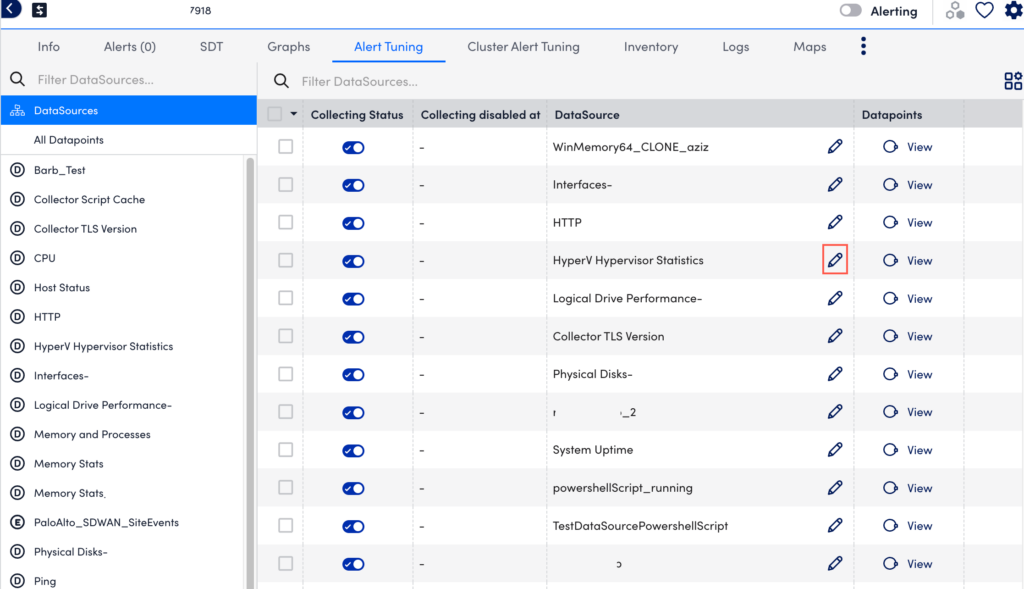
- Select the Alert Tuning tab, and then select a specific datapoint from the dataSource table to edit that dataSource definition in a new tab.
- In the DataSource definition page, select the Datapoints tab.
- In the Datapoints section, under the Action column of your required Normal or Complex Datapoint table, select
 .
. - In the details panel, under the Dynamic Thresholds section, select Alert Threshold Wizard. You can alternately toggle enable Add Dynamic Threshold to add your dynamic threshold.
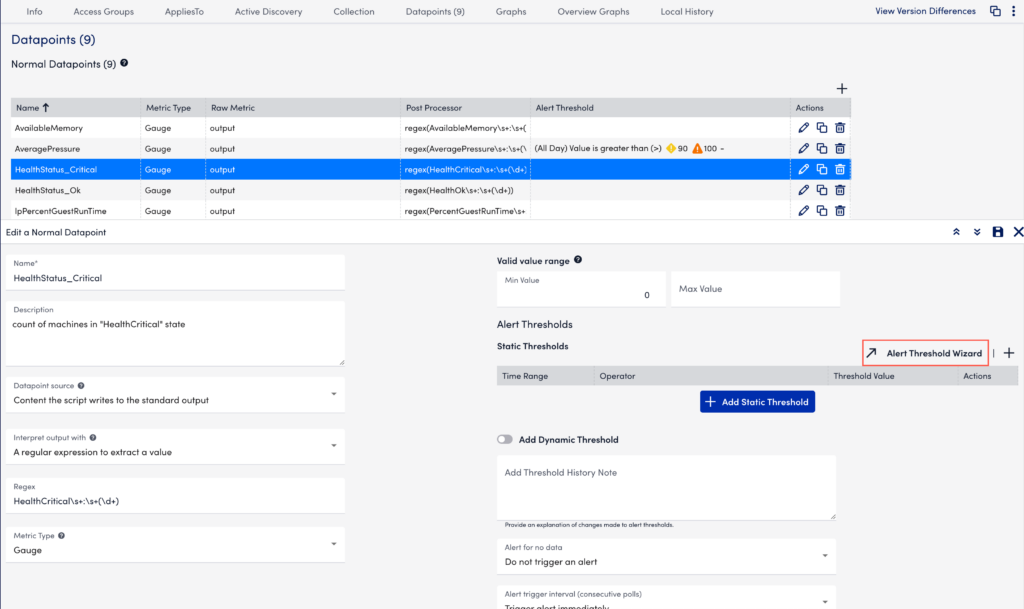
- In the Global Datapoint Threshold modal, select the time range from the From and To dropdown menus.
Multiple sets of thresholds can only exist at the same level if they specify different time frames.enab - In the When field, select a comparison method as follows:
- Value—Compares the datapoint value against a threshold
- Delta—Compares the delta between the current and previous datapoint value against a threshold
- NaNDelta—Operates the same as delta, but treats NaN values as 0
- Absolute value—Compares the absolute value of the datapoint against a threshold
- Absolute delta—Compares the absolute value of the delta between the current and previous datapoint values against a threshold
- Absolute NaNDelta—Operates the same as absolute delta, but treats NaN values as 0
- Absolute delta%—Compares the absolute value of the percent change between the current and previous datapoint values against a threshold
- Select a comparison operation (For example, >(Greater Than), =(Eqaul To), and so on).
- Enter one or multiple severity levels with your required values to trigger that alert severity. If you add the same threshold value to more than one severity level, the higher severity level takes precedence.
For example, if you set both the warning and error severity level thresholds at 100, then a datapoint value of 100 will trigger an error alert. If the datapoint value jumps from a lower severity level to a higher severity level, the alert trigger interval count (the number of consecutive collection intervals for which an alert condition must exist before an alert is triggered) is reset. For more information, see Datapoint Overview. - Select Save to close the Global Datapoint Threshold modal.
- In the Add Threshold History Note input field, enter the required update.
- From the Alert for no data dropdown menu, select your required alert severity option.
- From the Alert trigger interval (consecutive polls) dropdown menu, select your required alert trigger interval value.
- From the Alert clear interval (consecutive polls) dropdown menu, select your required alert clearing interval value.
- From the Alert Message dropdown menu, select the required alert template.
- Select Save to apply the settings.
Adding Dynamic Thresholds at Instance, Instance Group, Resource Group, and Resource DataSource Level
- In LogicMonitor, navigate to Resources Tree > Resources.
- Select the level where you want to add the static threshold.
For more information, see Different Levels for Enabling Alert Thresholds. - Select the Alert Tuning tab, and then select the required row from the datapoint table.
- In the details panel, select the Threshold tab.
Select Add a Threshold and select Dynamic Threshold.
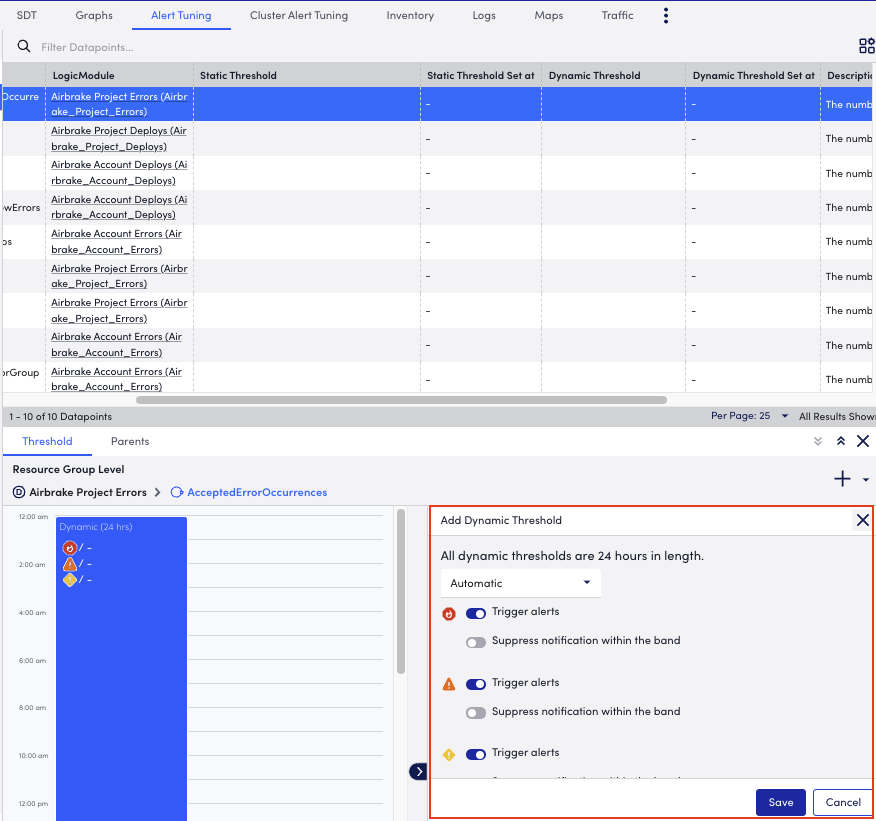
- In the Add Dynamic Threshold section of the details panel, select the alerts that must be triggered or suppressed.
Threshold priority is represented from right to left in the modal or from left to right in the composite string. - (Optional) Select Manual from the dropdown menu to set specify the criteria when you want to trigger an alert and add the number of consecutive intervals after which a warning, error, or critical alert must be sent.
- Select Save to apply the settings.
LogicMonitor provides logs for out-of-the-Box (OOTB) integrations directly in your portal. This gives you visibility into the outgoing and response payloads for every integration call to help you troubleshoot. Each time LogicMonitor makes a call to an integration, an entry is added to the Integrations Logs. Communication inbound to LogicMonitor from an integration is captured in the Audit Logs. For more information, see About Audit Logs.
Note: The Custom Email Delivery integration does not log information to the Integrations Logs.
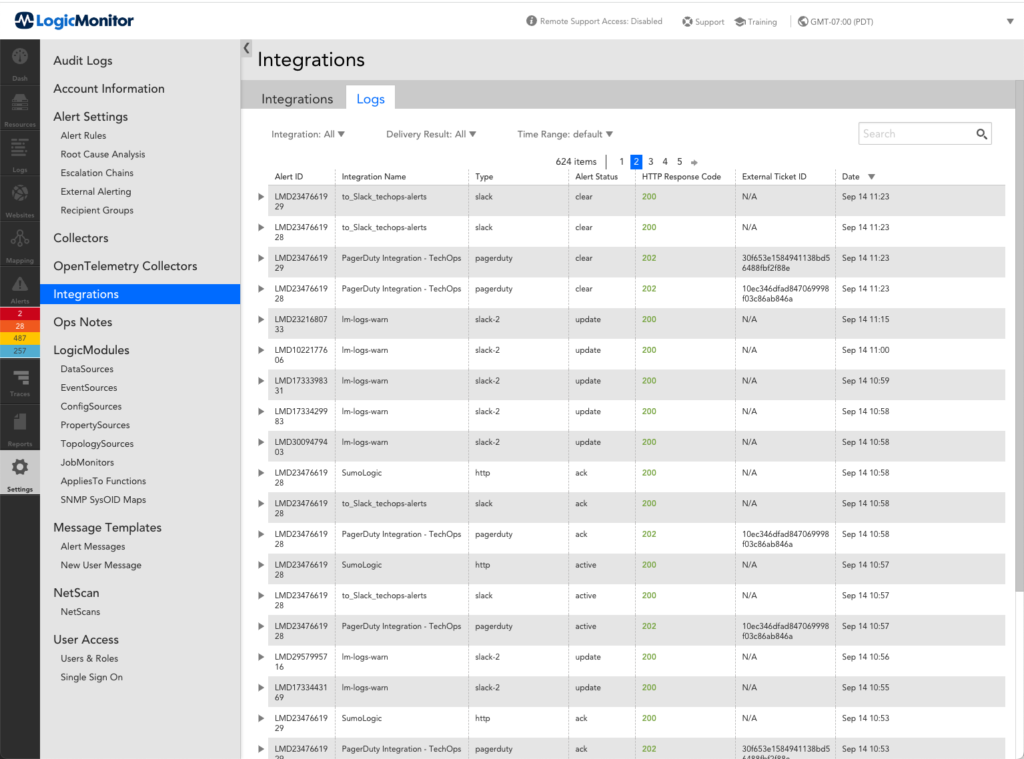
You can expand each individual log for more details about the call, including the HTTP response, header, number of delivery retries, and error message (if applicable).
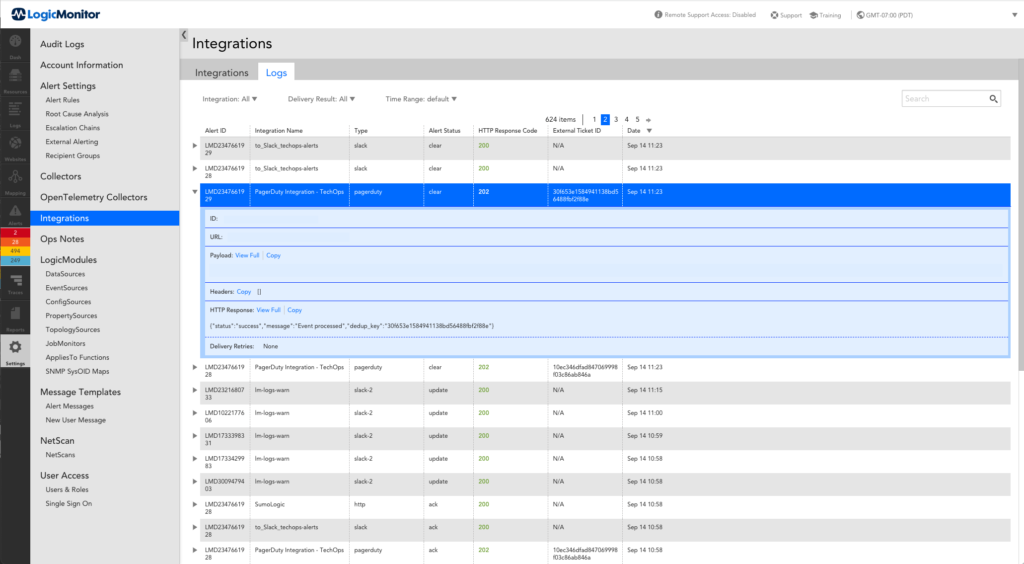
Note: While sending alert notifications through integration, the active alert status for an alert with higher severity is delivered as soon as the alert is created. However, the clear alert status for the alert with higher severity is delivered only after the entire alert session is over.
Disclaimer: This content is no longer maintained and will be removed at a future time.
While LogicMonitor has a robust alert delivery, escalation, and reporting system, you may be using other tools in parallel to access and store IT information.
You can use LogicMonitor’s custom HTTP delivery integration settings to enable LogicMonitor to create, update, and close tickets in Zendesk in response to LogicMonitor alerts.
In this support article, we’ve divided the process of creating a Zendesk/LogicMonitor integration into three major steps:
- Familiarize yourself with background resources
- Ready Zendesk for integration
- Create the Zendesk custom HTTP delivery integration in LogicMonitor
Familiarize Yourself with Background Resources
Review the following resources before configuring your Zendesk integration:
- LogicMonitor support article: Custom HTTP Delivery. This support article provides an overview of the various configurations and settings found in LogicMonitor’s custom HTTP delivery integrations.
- LogicMonitor support article: Tokens Available in LogicModule Alert Messages. This support article provides an overview of the available tokens that can be passed through to Zendesk. Note: The examples in this support article additionally use a ##zendesk.authorid## token that was created as a custom property on the device. Custom device properties can be very useful when using the same integration to create tickets as multiple organizations or users.
- Zendesk developer documentation: API Introduction
Ready Zendesk for Integration
To ready Zendesk for integration, perform the following steps:
- Create a Zendesk user to be used for authentication.
- Configure your Zendesk API key for authentication.
Create the Zendesk Custom HTTP Delivery Integration in LogicMonitor
To create a Zendesk/LogicMonitor custom HTTP delivery integration that can create, update, and close tickets in Zendesk in response to LogicMonitor alerts, perform the following steps:
- Select Settings > Integrations > Add > Custom HTTP Delivery.
- Enter a name and description for the Zendesk integration.
- Select Use different URLs or data formats to notify on various alert activity.
This allows LogicMonitor to take different actions in Zendesk, depending on whether the alert is being created, acknowledged, cleared, or escalated.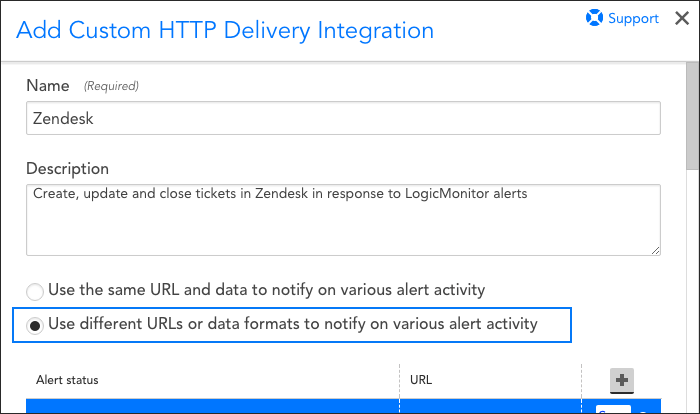
- Specify settings for creating a new ticket (as triggered by a new alert):
Note: For each request, you can select which alert statuses trigger the HTTP request. Requests are sent for new alerts (status: Active), and can also be sent for alert acknowledgements (status: Acknowledged), clears (status: Cleared) and escalations/de-escalations/adding note (status: Escalated). If the escalated status is selected and a note is added to the alert, an update request is sent whether the alert is active/cleared. If the escalated status is not selected and a note is added to the alert, a request is not sent.- Select HTTP Post as the HTTP method and enter the URL to which the HTTP request should be made. Format the URL to mimic this path structure: “[acme].zendesk.com/api/v2/tickets.json”. Be sure to preface the URL with “https://” in the preceding drop-down menu.
- Provide username and password values.
Note: When authenticating with the Zendesk API, you only need to enter the API key in the password field and your username with “/token” appended at the end, as shown in the next screenshot. - The settings under the “Alert Data” section should specify raw JSON, and the payload should look something like the following as a starting point:
{ "ticket": { "subject": "##LEVEL## - ##HOST## ##INSTANCE##", "type": "incident", "comment": { "body": "Host: ##HOST##\nDatasource: ##DATASOURCE##\nDatapoint: ##DATAPOINT##\nLevel: ##LEVEL##\n Start: ##START##\nDuration: ##DURATION##\nValue: ##VALUE##\nReason: ##DATAPOINT## ##THRESHOLD##"}, "priority": "normal" } }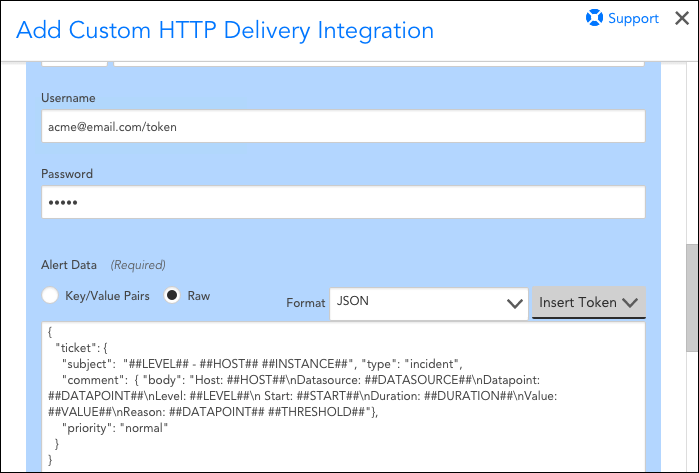
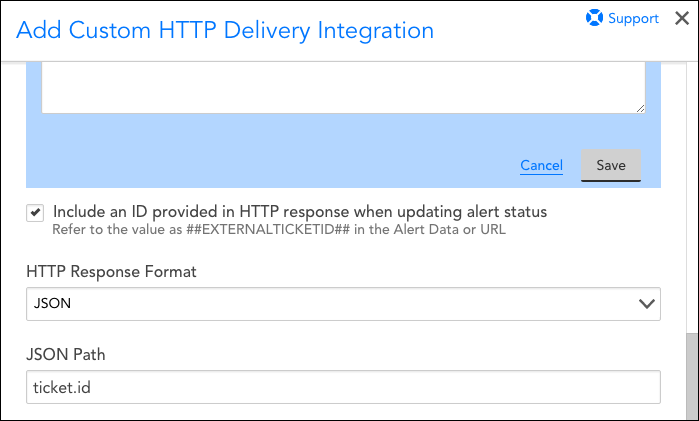
- If you want LogicMonitor to update the status of your Zendesk tickets when the alert changes state or clears, check the “Include an ID provided in HTTP response when updating alert status” box. Enter “JSON” as the HTTP response format and enter “ticket.id” as the JSON path, as shown next. This captures Zendesk’s identifier for the ticket that is created by the above POST so that LogicMonitor can refer to it in future actions on that ticket using the ##EXTERNALTICKETID## token.
- Click the Save button located within the blue box to save the settings for posting a new alert.
- Click the + icon to specify settings for acknowledged alerts, if applicable to your environment. Several settings remain the same as entered for new alerts, but note the following changes:
- Select Acknowledged.
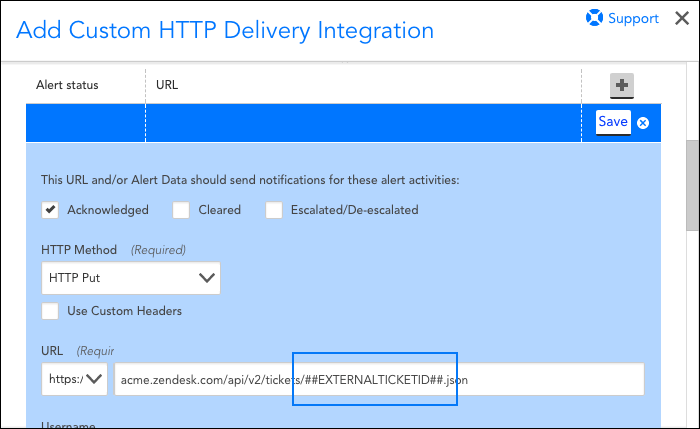
- Select “HTTP Put” as the HTTP method and enter the URL to which the HTTP request should be made. Notice that the URL in the following screenshot references a slightly different URL path than the one used to create a new ticket and includes the ##EXTERNALTICKETID## token in order to pass in the ticket we want to acknowledge.
- The payload should look something like the following as a starting point:
{ "ticket": { "status": "open", "comment": { "body": "##MESSAGE##", "author_id": "##zendesk.authorid##" } } }
- Save the settings for acknowledged alerts and then click the + icon to specify settings for escalated alerts, if applicable to your environment. Several settings remain the same as entered for acknowledged alerts, but note the following changes:
- Check the “Escalated/De-escalated” box.
- The payload should look something like the following as a starting point:
{ "ticket": { "subject": "##LEVEL## - ##HOST## ##INSTANCE##", "type": "incident", "comment": { "body": "Alert Escalated/De-escalated:\nHost: ##HOST##\nDatasource: ##DATASOURCE##\nDatapoint: ##DATAPOINT##\nLevel: ##LEVEL##\n Start: ##START##\nDuration: ##DURATION##\nValue: ##VALUE##\nReason: ##DATAPOINT## ##THRESHOLD##"}, "priority": "normal" } }
- Save the settings for escalated alerts and then click lick the + icon to specify settings for cleared alerts. Several settings remain the same as entered for acknowledged and escalated alerts, but note the following changes:
- Check the “Cleared” box.
- The payload should look something like the following as a starting point:
{ "ticket": { "subject": "##LEVEL## - ##HOST## ##INSTANCE##", "type": "incident", "comment": { "body": "Alert Cleared:\nHost: ##HOST##\nDatasource: ##DATASOURCE##\nDatapoint: ##DATAPOINT##\nLevel: ##LEVEL##\n Start: ##START##\nDuration: ##DURATION##\nValue: ##VALUE##\nReason: ##DATAPOINT## ##THRESHOLD##"}, "status": "solved","priority": "normal" } }
- Save the settings for cleared alerts and then click the Save button at the very bottom of the screen to save your new Zendesk custom HTTP delivery integration.
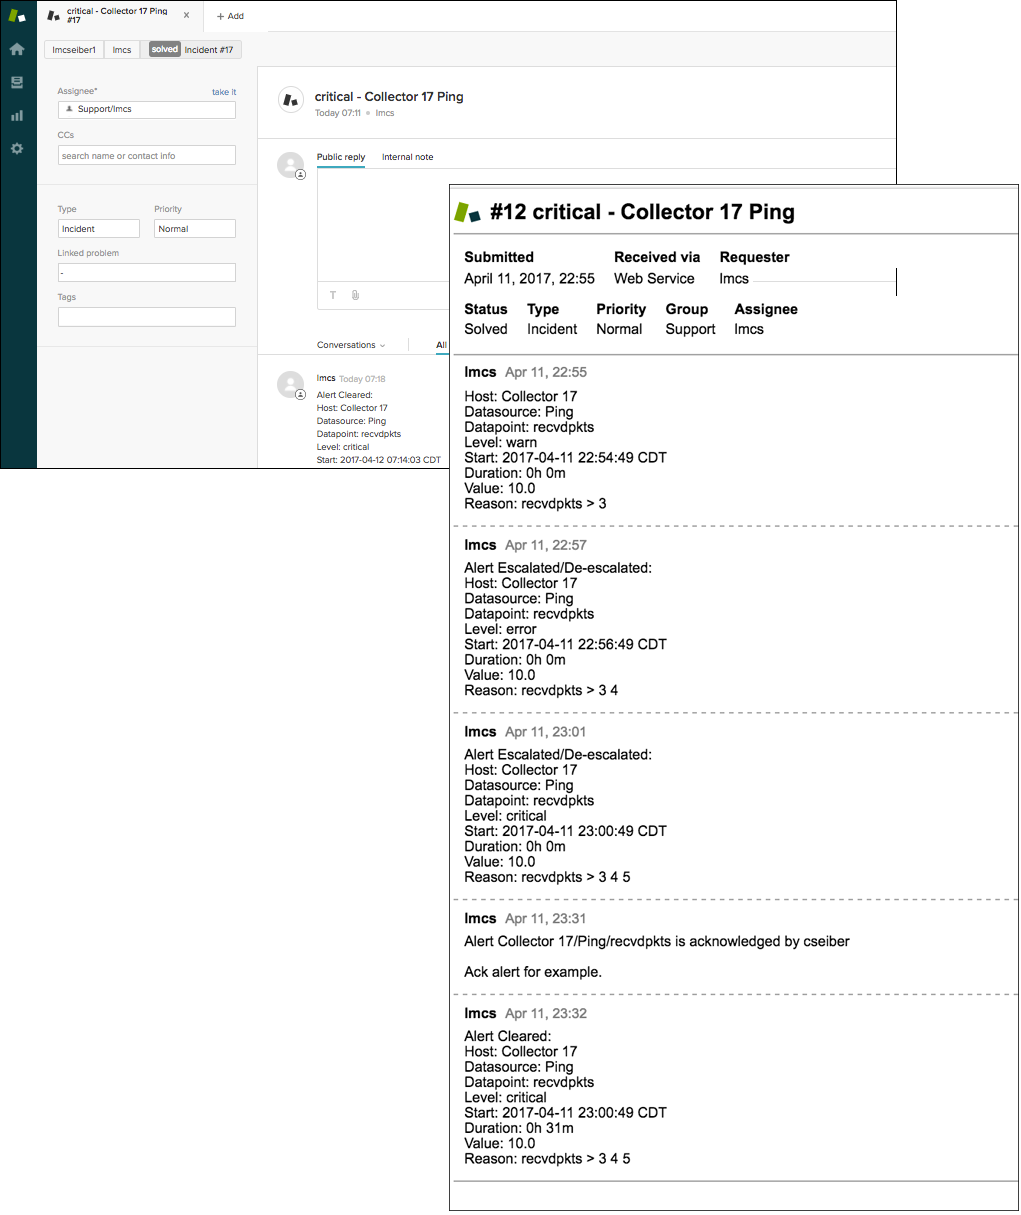
- Add your newly created delivery method to an escalation chain that is called by an alert rule. Once you do, Zendesk issues will be automatically created, updated, and cleared by LogicMonitor alerts, as shown next.
Note: Alert rules and escalation chains are used to deliver alert data to your Zendesk integration. When configuring these, there are a few guidelines to follow to ensure tickets are created and updated as expected within Zendesk. For more information, see Alert Rules and Escalation Chains.
Disclaimer: This content is no longer maintained and will be removed at a future time.
Puppet is IT automation software that enables system administrators to manage provisioning and configuration of their infrastructure. We know that in addition to maintaining correct infrastructure configuration, system administrators additionally rely on monitoring to help prevent outages. Our Puppet module was created with this in mind, and allows your Puppet infrastructure code to manage your LogicMonitor account as well. This enables you to confirm that correct device properties are maintained, that devices are monitored by the correct Collector, that they remain in the right device groups and much more.
Note:
- This module is compatible with Puppet versions 3 and 4, and is a different (newer) version of our original module
- This module is only compatible with linux servers. Windows compatibility may be added in future releases.
- This module requires PuppetDB
Module Overview
LogicMonitor’s Puppet module defines 4 classes and 4 custom resource types:
Classes
- logicmonitor: Handles setting the credentials needed to interact with the LogicMonitor API
- logicmonitor::master: Collects the exported lm_device resources and lm_devicegroup resources. Communicates with the LogicMonitor API
- logicmonitor::collector: Handles LogicMonitor collector management for the device. Declares an instance of lm_collector and lm_installer resources
- logicmonitor::device: Declares an exported lm_device resource
- logicmonitor::device_group: Declares an exported lm_device_group resource
Resource Type
- lm_device_group: Defines the behavior of the handling of LogicMonitor device groups. We recommend using exported resources
- lm_device: Defines the handling behavior of LogicMonitor collectors. Used only with the logicmonitor::collector class
- lm_collector: Defines the handling behavior of LogicMonitor collectors. Used only with the logicmonitor::collector class
- lm_installer: Defines the handling behavior of LogicMonitor collector binary installers. Used only within the logicmonitor::collector class
Requirements
To use LogicMonitor’s Puppet Module, you need the following:
- Ruby 1.8.7 or 1.9.3
- Puppet 3.X or Puppet 4.x
- JSON Ruby gem (included by default in Ruby 1.9.3)
- Store Configs in Puppet
- Device Configuration
Store Configs
To enable store configs, add storeconfigs = true to the [master] section of your puppet.conf file, like so:
# /etc/puppet/puppet.conf
[master]
storeconfigs = trueOnce enabled, PuppetDB is needed to store the config info.
Device Configuration
As with your other LogicMonitor devices, the collector will need to communicate with the device in order to gather data. Make sure the correct properties and authentication protocols are configured as part of the Puppet installation.
Installing the LogicMonitor Puppet Module
You can install LogicMonitor’s Puppet Module one of two ways:
- Using Puppet’s Module Tool
- Using GitHub
Using Puppet’s Module Tool
Run the following command on your Puppet Master to download and install the most recent version of the LogicMonitor Puppet Module published on Puppet Forge:
$ puppet module install logicmonitor-logicmonitorUsing GitHub
$ cd /etc/puppet/modules
$ git clone git: //github.com/logicmonitor/logicmonitor-puppetv4.git
$ mv logicmonitor-puppet-v4 logicmonitorGetting Started
Once you’ve installed LogicMonitor’s Puppet Module, you can get started using the following sections:
Create a New User for Puppet
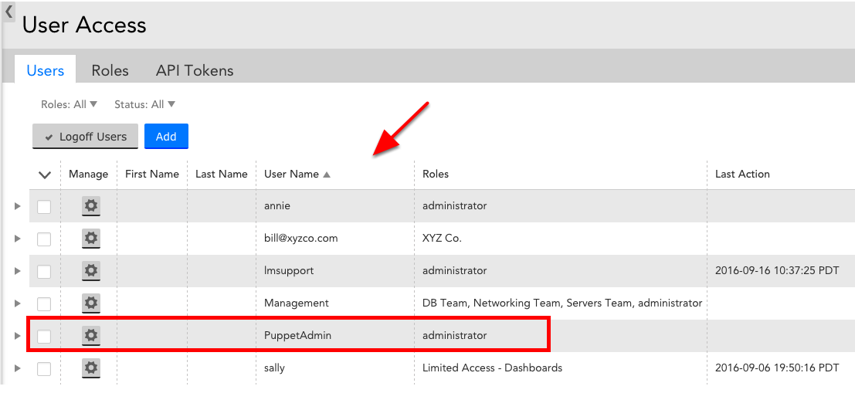
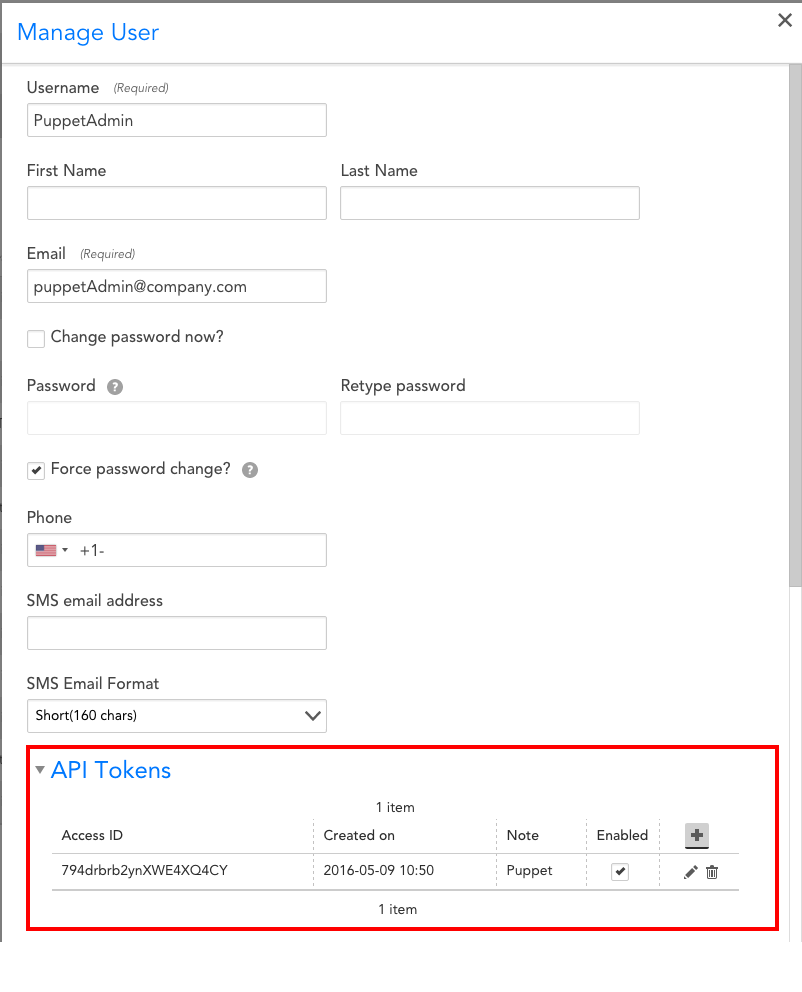
We recommend you create a new user with administrator privileges in your LogicMonitor account that you will use exclusively within your Puppet nodes to track changes made by Puppet in the audit log. You will need to provision this user API Tokens.
Configuration
- Class: logicmonitor (modules/logicmonitor/manifests/init.pp)
This is the top level class for the LogicMonitor module; it only needs to be defined on the Puppet Master. Its purpose is to set the LogicMonitor credentials to be used by all the child classes.
| Parameter | Description | Inputs |
| account | Your LogicMonitor account name. e.g. if you log into https://mycompany.logicmonitor.com your account should be “mycompany” | String |
| access_id | The API access id of a LogicMonitor user with access to manage device, groups, and collectors. Actions taken by Puppet show up in the audit log associated with this API access id. We recommend creating a dedicated user for your Puppet account. | String |
| access_key | The API access key associated with the LogicMonitor user Puppet will be making changes on behalf of. | String |
- class: logicmonitor::master (modules/logicmonitor/manifests/master.pp)
The master class enables communication between the LogicMonitor module and your LogicMonitor account for group and device management. This class acts as the collector for the lm_device and lm_devicegroup exported resources. This prevents conflicts and provides a single point of contact for communicating with the LogicMonitor API. This class must be explicitly declared on a single device.
Note: All devices with the logicmonitor::collector and logicmonitor::master classes will need to be able to make outgoing https requests.
Parameters: none
- Class: logicmonitor::collector (modules/logicmonitor/manifests/collector.pp)
This class manages the creation, download, and installation of a LogicMonitor collector on the specified node.
- The only absolute requirement for a collector node is that it is Linux and can make an outgoing SSL connection over port 443
- We suggest the collector system have at least 1G of RAM
- If the collector will be collecting data for more than 100 devices, it is a good idea to dedicate a machine to it
| Parameter | Description | Inputs |
| install_dir | The path to install the LogicMonitor collector. | A valid directory path. Default to “/usr/local/logicmonitor” |
- Class: logicmonitor::device (modules/logicmonitor/manifests/device.pp)
This class is used to add devices to your LogicMonitor account. Devices which are managed through Puppet will have any properties not specified in the device definition removed.
| Parameter | Description | Inputs |
| collector | The fully qualified domain name of the collector machine. You can find this by running hostname -f on the collector machine. | String. No Default (required) |
| hostname | The IP address or fully qualified domain name of the node. This is the way that the collector reaches this device. | String. Default to $fqdn |
| display_name | The human readable name to display in your LogicMonitor account. e.g. “dev2.den1” | String. Default to $fqdn |
| description | The long text description of the host. This is seen when hovering over the device in your LogicMonitor account. | String. No Default (Optional) |
| disable_alerting | Turn on or off alerting for the device. If a parent group is set to disable_alerting = true alerts for child devices will be turned off as well. | Boolean, Default to false |
| groups | A list of groups that the device should be a member of. Each group is a String representing its full path. E.g. “/linux/production” | List. No Default (Optional) |
| properties | A hash of properties to be set on the device. Each entry should be “propertyName” => “propetyValue”. E.g. {“mysql.port” => 6789, “mysql.user” => “dba1”} | Hash. No Default (Optional) |
class {'logicmonitor:: device':
collector => "qa1.domain.com",
hostname => "10.171.117.9",
groups => ["/Puppetlabs", "/Puppetlabs/Puppetdb"],
properties => {"snmp.community" => "Puppetlabs"}.
description => "This device hosts the PuppetDB instance for this deployment",
}
class {'logicmonitor::device':
collector => $fqdn,
display_name => "MySQL Production Host 1",
groups => ["/Puppet", "/production", "/mysql"],
properties => {"mysql.port" => 1234},
}Adding a Device Group:
Type: lm_device_group Device groups should be added using an exported resource to prevent conflicts. It is recommended device groups are added from the same node where the logicmonitor::master class is included. Devices can be included in zero, one, or many device groups. Device groups are used to organize how your Logic Monitor Devices are displayed and managed and d not require a collector. Properties set at the device group level will be inherited by any devices added to the group.
| Parameter | Description | Inputs |
| full_path | The full path of the host group. E.g. a device group “bar” with parent group “foo” would have the full_path of “/foo/bar” | String (required) |
| ensure | Puppet ensure parameter. | Present/absent. No Default (required) |
| disable_alerting | Turn on/off alerting for the group. If desirable_alerting is true, all child groups and devices will have alerting disabled | Boolean. Default to True. |
| properties | A hash of properties to be set on the device group. Each entry should be “propertyName” => “propertyValue”. E.g. {“mysql.user” => “dba1”}. The properties will be inherited by all child groups and hosts | Hash, No Default (optional) |
| description | The long text description of the device group. This is seen when hovering over the group in your LogicMonitor account. | String. No Default (optional) |
Examples
To add collector to a node:
include logicmonitor::collectorIf you want to specify a specific location where you’d like to install a collector:
class{"logicmonitor::collector":
install_dir => $install_dir,
}To add and edit properties of device groups use lm_devicegroup, example below.
@@lm_device_group{"/parent/child/grandchild/greatgrandchild":
ensure => present,
disable_alerting => false,
properties => {"snmp.community" => "n3wc0mm", "mysql.port" => 9999, "fake.pass" => "12345"}, description => "This is the description",
}For more examples of the module in action, check out logicmonitor-puppet-v4/README.md.
Your LogicMonitor account comes ready to integrate alert messages with your ServiceNow account. The bidirectional integration enables LogicMonitor to open, update and close ServiceNow incidents based on LogicMonitor alerts. By sending alerts from LogicMonitor into ServiceNow, you can take advantage of ServiceNow’s alerting platform features to increase uptime of your apps, servers, websites, and databases. ServiceNow users can also acknowledge an alert directly from an incident in ServiceNow.
As discussed in the following sections, setup of this integration requires:
- Installation of the LogicMonitor Incident Management Integration from the ServiceNow store.
- Configuration of the integration within LogicMonitor
- Configuration of alert rule/escalation chain to deliver alert data to the integration
- Configuration of ServiceNow (optional) to include acknowledge option on incident form
Installing and Configuring the LogicMonitor Incident Management Integration
- Click the GET button on the LogicMonitor Store page.
- Accept ServiceNow’s Notice by clicking Continue
- Note the Dependencies and Continue if they apply to your environment
- For the Entitlement Section choose to make the application available to all instances or just specific ones. (NOTE: This step does not install the application, it just makes it available for install later.)
- Accept the ServiceNow Terms
- Click GET
- Login to your ServiceNow instance
- Navigate to System Applications > Applications
- The LogicMonitor Incident Management application should be available in the Downloads section. Click Install to add the application to your instance.
After the application is installed you will need to provide account details for ServiceNow to automatically acknowledge alerts:
- Navigate to LogicMonitor Incident Management > Setup > Properties
- Set values for:
- LogicMonitor Account Name
- API Access ID*
- API Access Key*
- Click Save
*As discussed in API Tokens, API tokens for LogicMonitor’s REST API are created and managed from the User Access page in the LogicMonitor platform.
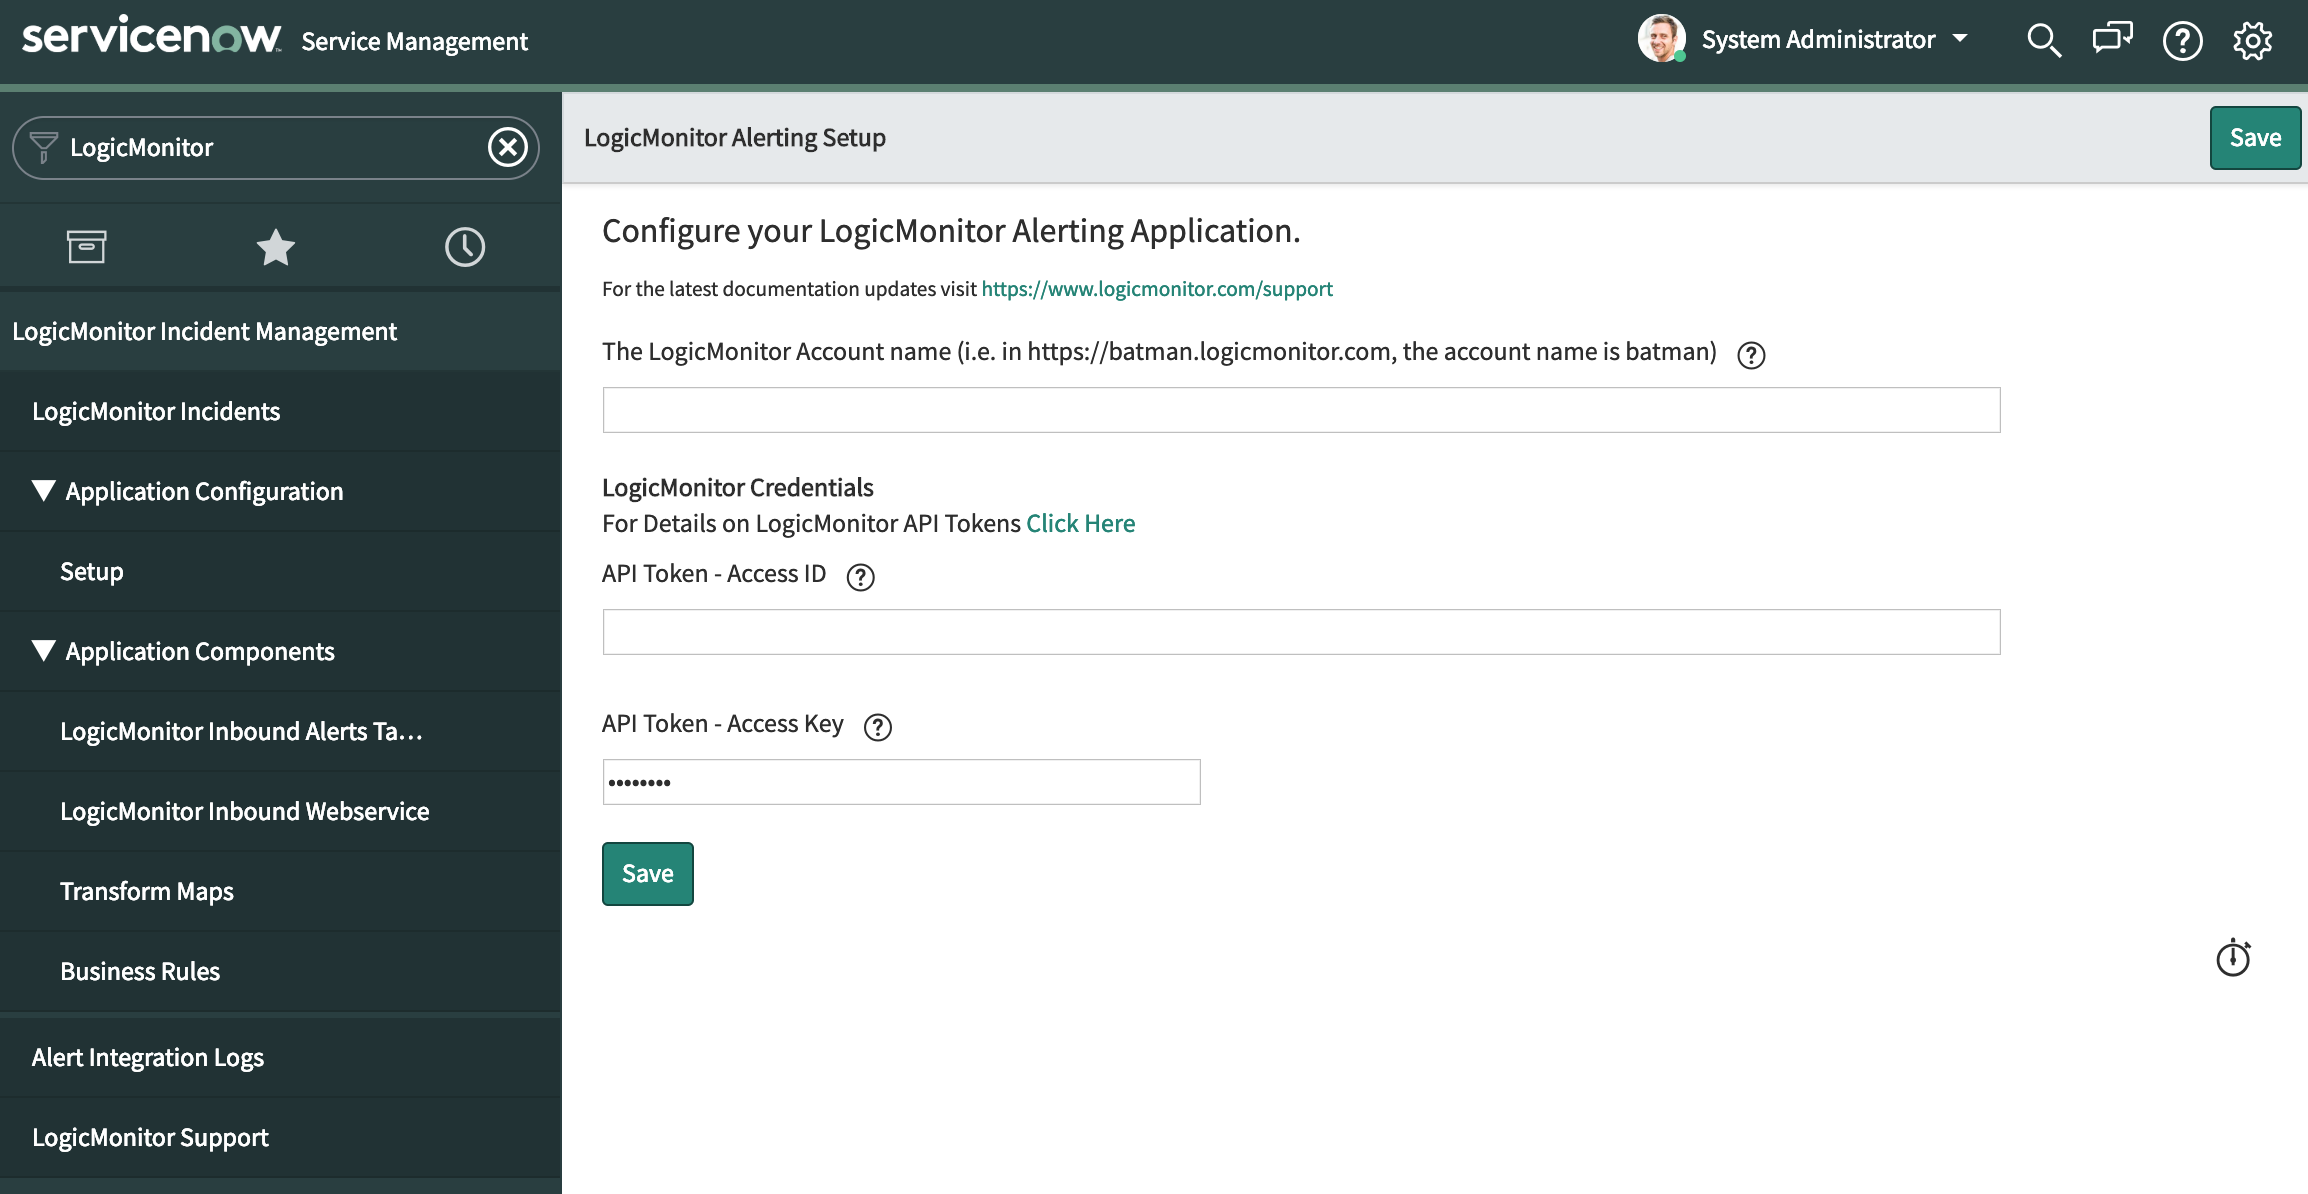
Configuring the Integration in LogicMonitor
You can enable the ServiceNow Integration in your account from Settings > Integrations. Select Add and then ServiceNow:
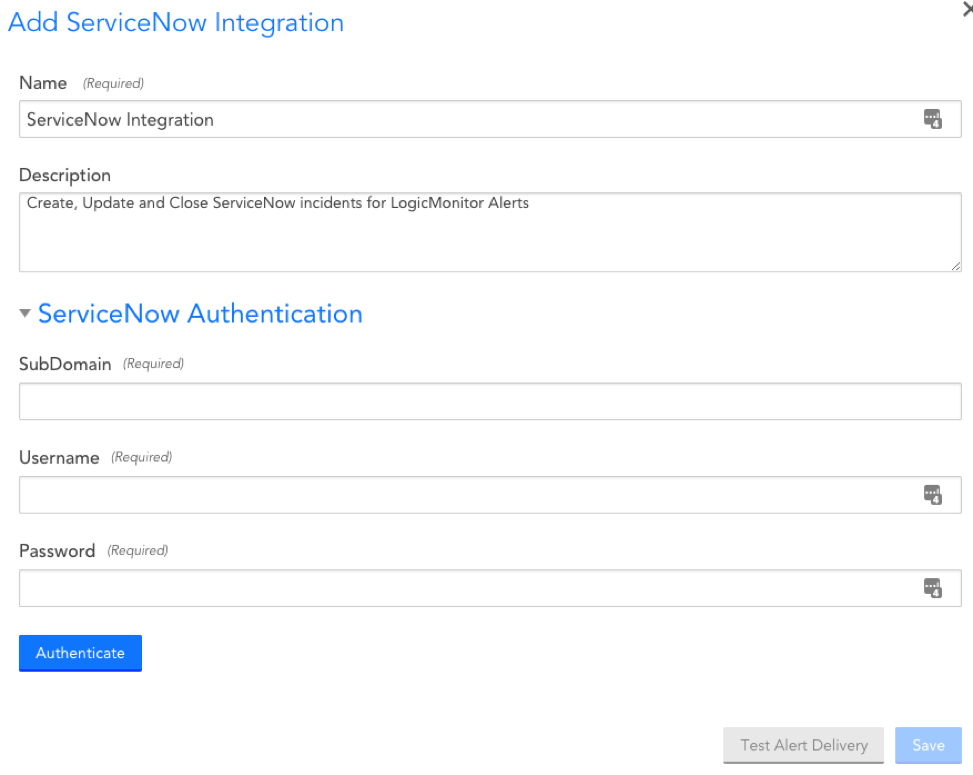
SubDomain
Your ServiceNow subdomain. You can find this in your ServiceNow portal URL. For example, if your ServiceNow portal url is https://dev.service-now.com/, your subdomain would be dev.
Username
The username associated with the ServiceNow account you want LogicMonitor to use to open, update and close ServiceNow incidents. Ensure that this user account is assigned the “LogicMonitor Integration” (x_lomo_lmint.LogicMonitor Integration) role, which was automatically added to your ServiceNow instance as part of the LogicMonitor application installation performed in step 1.
Password
The password associated with the ServiceNow username you specified.
ServiceNow Default Settings
The ServiceNow Settings section enables you to configure how incidents are created in ServiceNow for LogicMonitor alerts.
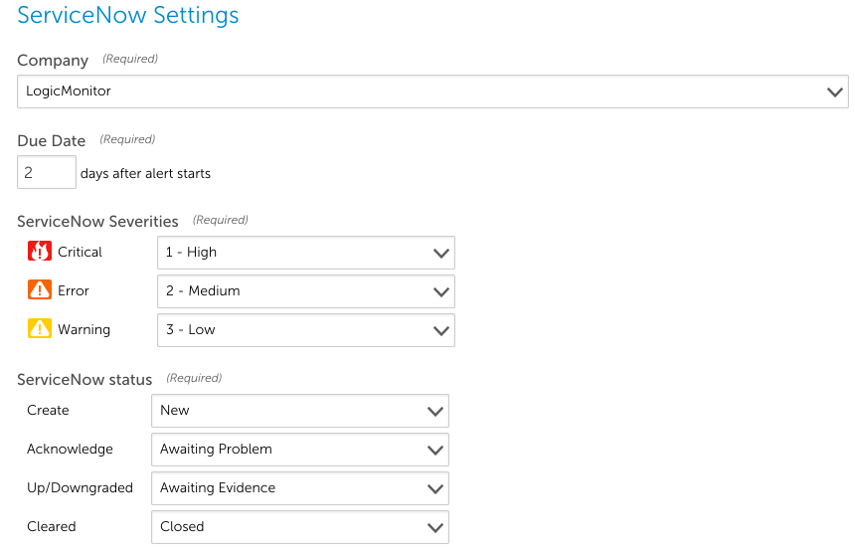
Company
The ServiceNow company that incidents will be created for.
Note: If you’d like to create, update and delete tickets across multiple ServiceNow companies, you can do that by setting the following property on the device whose alerts should trigger a new or change to existing ServiceNow incident:
servicenow.company
When an alert is triggered and routed to the ServiceNow Integration, LogicMonitor will first check to see if this property exists for the device associated with the alert. If it does exist, its value will be used instead of the value set in the Integration form.
Due Date
This field will determine how LogicMonitor sets the due date of the incidents in ServiceNow. Specifically, the ServiceNow incident due date will be set to the number of days you set this field to.
ServiceNow Severities
Indicate how the LogicMonitor alert severities should map to incidents created in your ServiceNow portal.
Note: This mapping determines severity level only for the ServiceNow incident. It does not play a role in determining the incident’s priority level.
ServiceNow status
Indicate how the LogicMonitor alert statuses should update the incidents created in your ServiceNow portal.
HTTP Delivery
The HTTP Delivery section controls how LogicMonitor formats and sends the HTTP requests to create, update and/or close incidents. You shouldn’t need edit to anything in the HTTP Delivery section, but if you wish to customize something you can use the information in the following sections to guide you. If not, you can save the integration now and proceed to the Configuring Alert Rule and Escalation Chain section.
By default, LogicMonitor will pre-populate four different HTTP requests, one for each of:
- new alerts (Active)
- acknowledged alerts (Acknowledged)
- cleared alerts (Cleared)
- escalated alerts (Escalated)
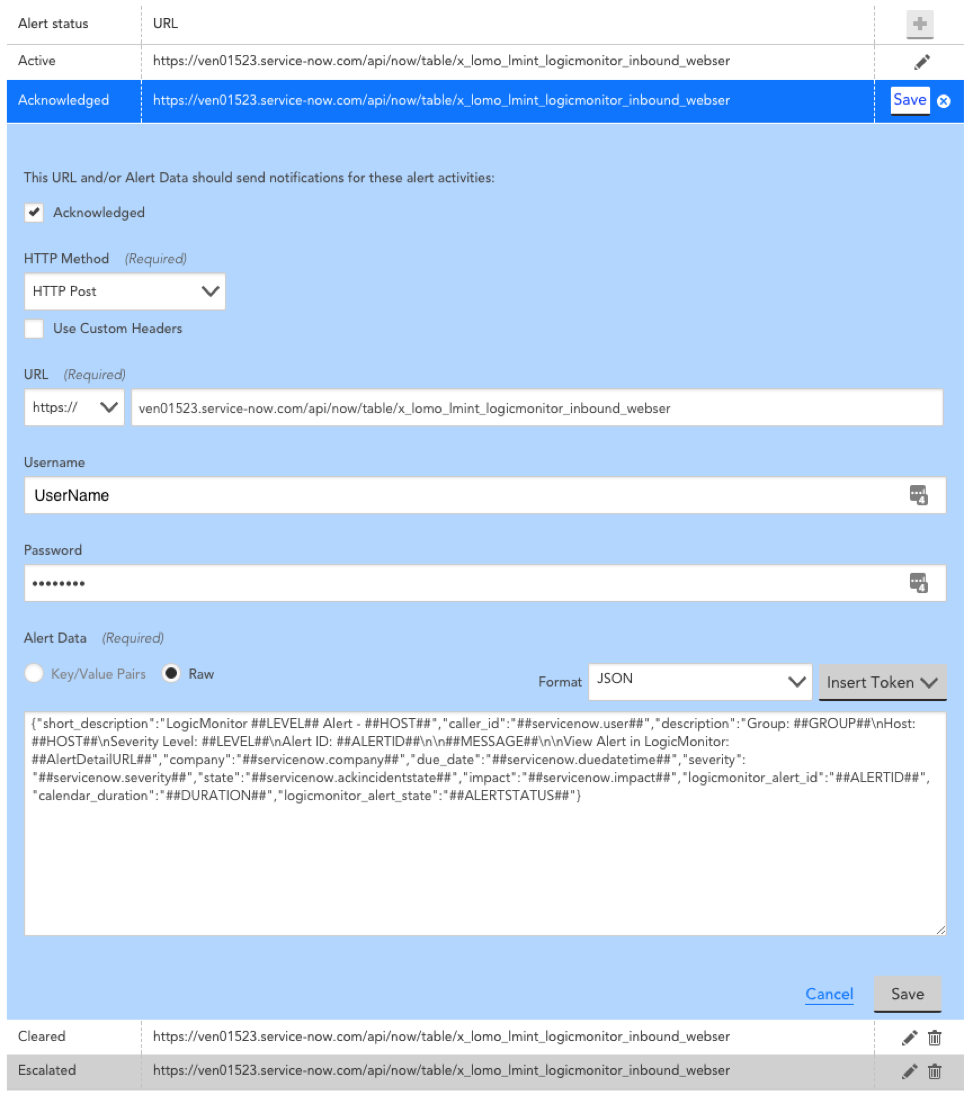
For each request, you can select which alert statuses trigger the HTTP request. Requests are sent for new alerts (status: Active), and can also be sent for alert acknowledgements (status: Acknowledged), clears (status: Cleared) and escalations/de-escalations/adding note (status: Escalated).
Note: If the escalated status is selected and a note is added to the alert, an update request is sent whether the alert is active/cleared. If the escalated status is not selected and a note is added to the alert, a request is not sent.
HTTP Method
The HTTP method for ServiceNow integrations is restricted to POST and PUT.
URL
The URL that the HTTP request should be made to. This field is auto-populated based on information you’ve provided.
Alert Data
The custom formatted alert data to be send in the HTTP request (used to create, update and close ServiceNow incidents). This field will be auto-populated for you. You can customize the alert data field using tokens.
Test Alert Delivery
This option sends a test alert and provides the response, enabling you to test whether you’ve configured the integration correctly.
Tokens Available
The following tokens are available:
- LogicModule-specific alert message tokens, as listed in Tokens Available in LogicModule Alert Messages.
- ##ADMIN##. The user the alert was escalated to.
- ##MESSAGE##. The rendered text of the alert message. This token will also pass all relevant acked information (e.g. the user that acknowledged the alert, ack comments, etc.).
- ##ALERTTYPE##. The type of alert (i.e. alert, eventAlert, batchJobAlert, hostClusterAlert, websiteAlert, agentDownAlert, agentFailoverAlert, agentFailBackAlert, alertThrottledAlert).
- ##EXTERNALTICKETID##. The ServiceNow incident ID.
Configuring Alert Rule and Escalation Chain
Alert rules and escalation chains are used to deliver alert data to your ServiceNow integration. When configuring these, there a few guidelines to follow to ensure tickets are opened, updated, and closed as expected within ServiceNow. For more information, see Alert Rules.
Alert Acknowledgement
You can configure an incident form in ServiceNow to acknowledge LogicMonitor alerts from ServiceNow. This involves adding an Acknowledge option to a ServiceNow Incident form, and allows technicians to view acknowledged LogicMonitor alerts from ServiceNow.
Requirements
To acknowledge LogicMonitor alerts from ServiceNow, you must have the LogicMonitor instance set up in the Incident Management Setup tab in ServiceNow. This involves providing your LogicMonitor Account Name and corresponding API Tokens.
For more information about configuring an incident in ServiceNow, see ServiceNow’s Incident Management documentation.
For more information about creating LogicMonitor API tokens, see API Tokens.
Adding Acknowledge Option to ServiceNow Incident Form
Recommendation: Add the LogicMonitor Alert Acknowledge field to an Incident View in addition to the base setup.
- As a ServiceNow administrator open an incident form.
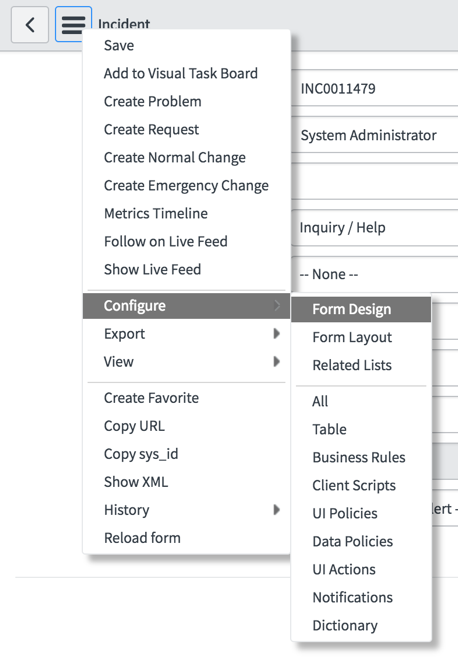
- Click the Menu button > Configure > Form Design.
3. Drag “LogicMonitor Alert Acknowledge” to the appropriate section of your form.
Additional ServiceNow solutions can be found in our Communities and Blog Posts that demonstrate custom implementations using the LogicMonitor Marketplace application as a base.
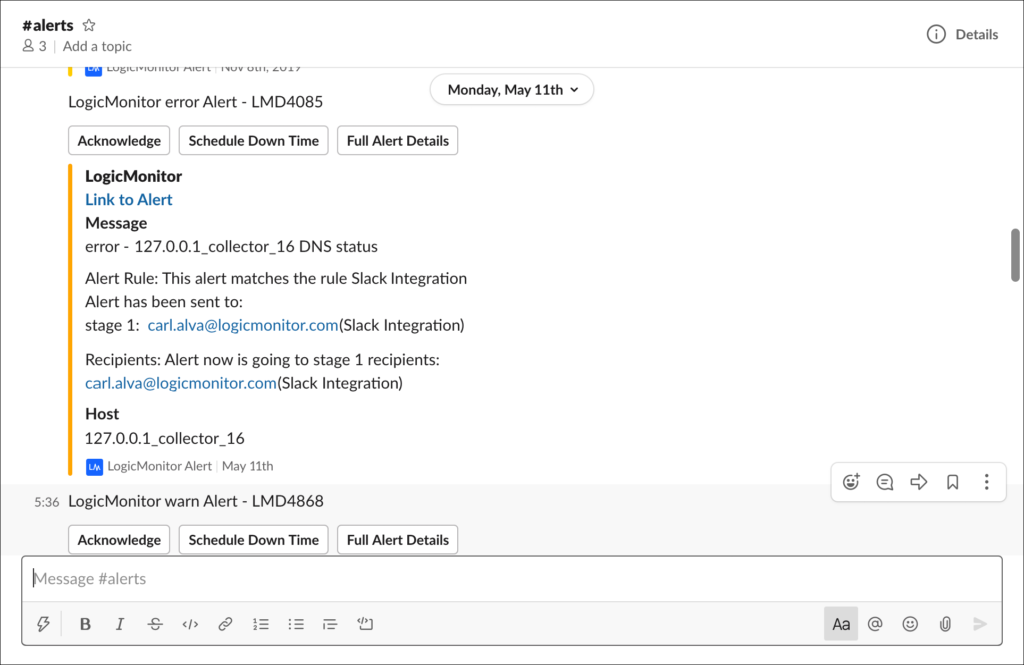
LogicMonitor offers an out-of-the-box alert integration for Slack via the LogicMonitor app for Slack. The integration between LogicMonitor and Slack is bi-directional, supporting the ability to:
- Route LogicMonitor alert notifications to Slack
- View and acknowledge alerts from Slack
- Put the resource triggering the alert into scheduled downtime (SDT) from Slack
- Open alerts in LogicMonitor from Slack
- Configure the conditions (alert rule, escalation chain, recipient group) under which alerts are routed to Slack—from Slack or LogicMonitor
Setting Up the LogicMonitor App for Slack
Setup of LogicMonitor’s alert integration solution for Slack involves four primary steps:
- Installing and configuring the app
- Routing alerts to Slack
- Adding/inviting the app to a Slack channel
- Configuring additional Slack channels (optional)
Installing and Configuring the Slack App
Installation and configuration of the LogicMonitor app for Slack can be initiated from either your LogicMonitor portal or Slack workspace.
Note: A LogicMonitor user must have manage-level permissions for integrations in order to configure any aspect of a Slack integration. For more information on this level of permissions, see Roles.
Installation and Configuration from LogicMonitor
Follow these steps to initiate installation and configuration of the LogicMonitor app for Slack from within LogicMonitor:
- In LogicMonitor, navigate to Settings > Integrations.
- Select Add. The Start New Integration pane appears.
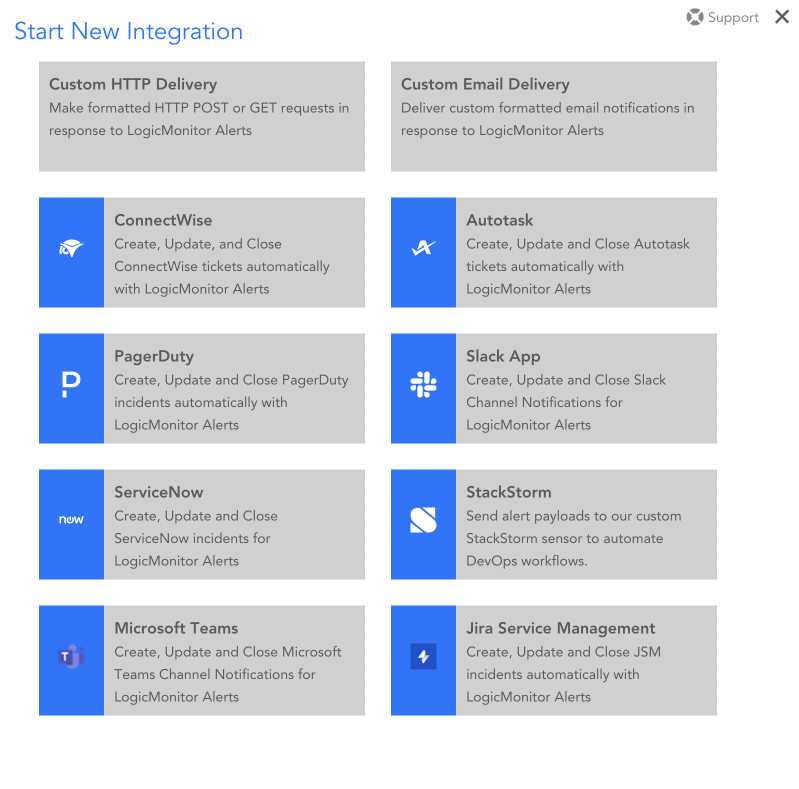
- Select Slack App. The Add Slack-2 Integration dialog box appears.
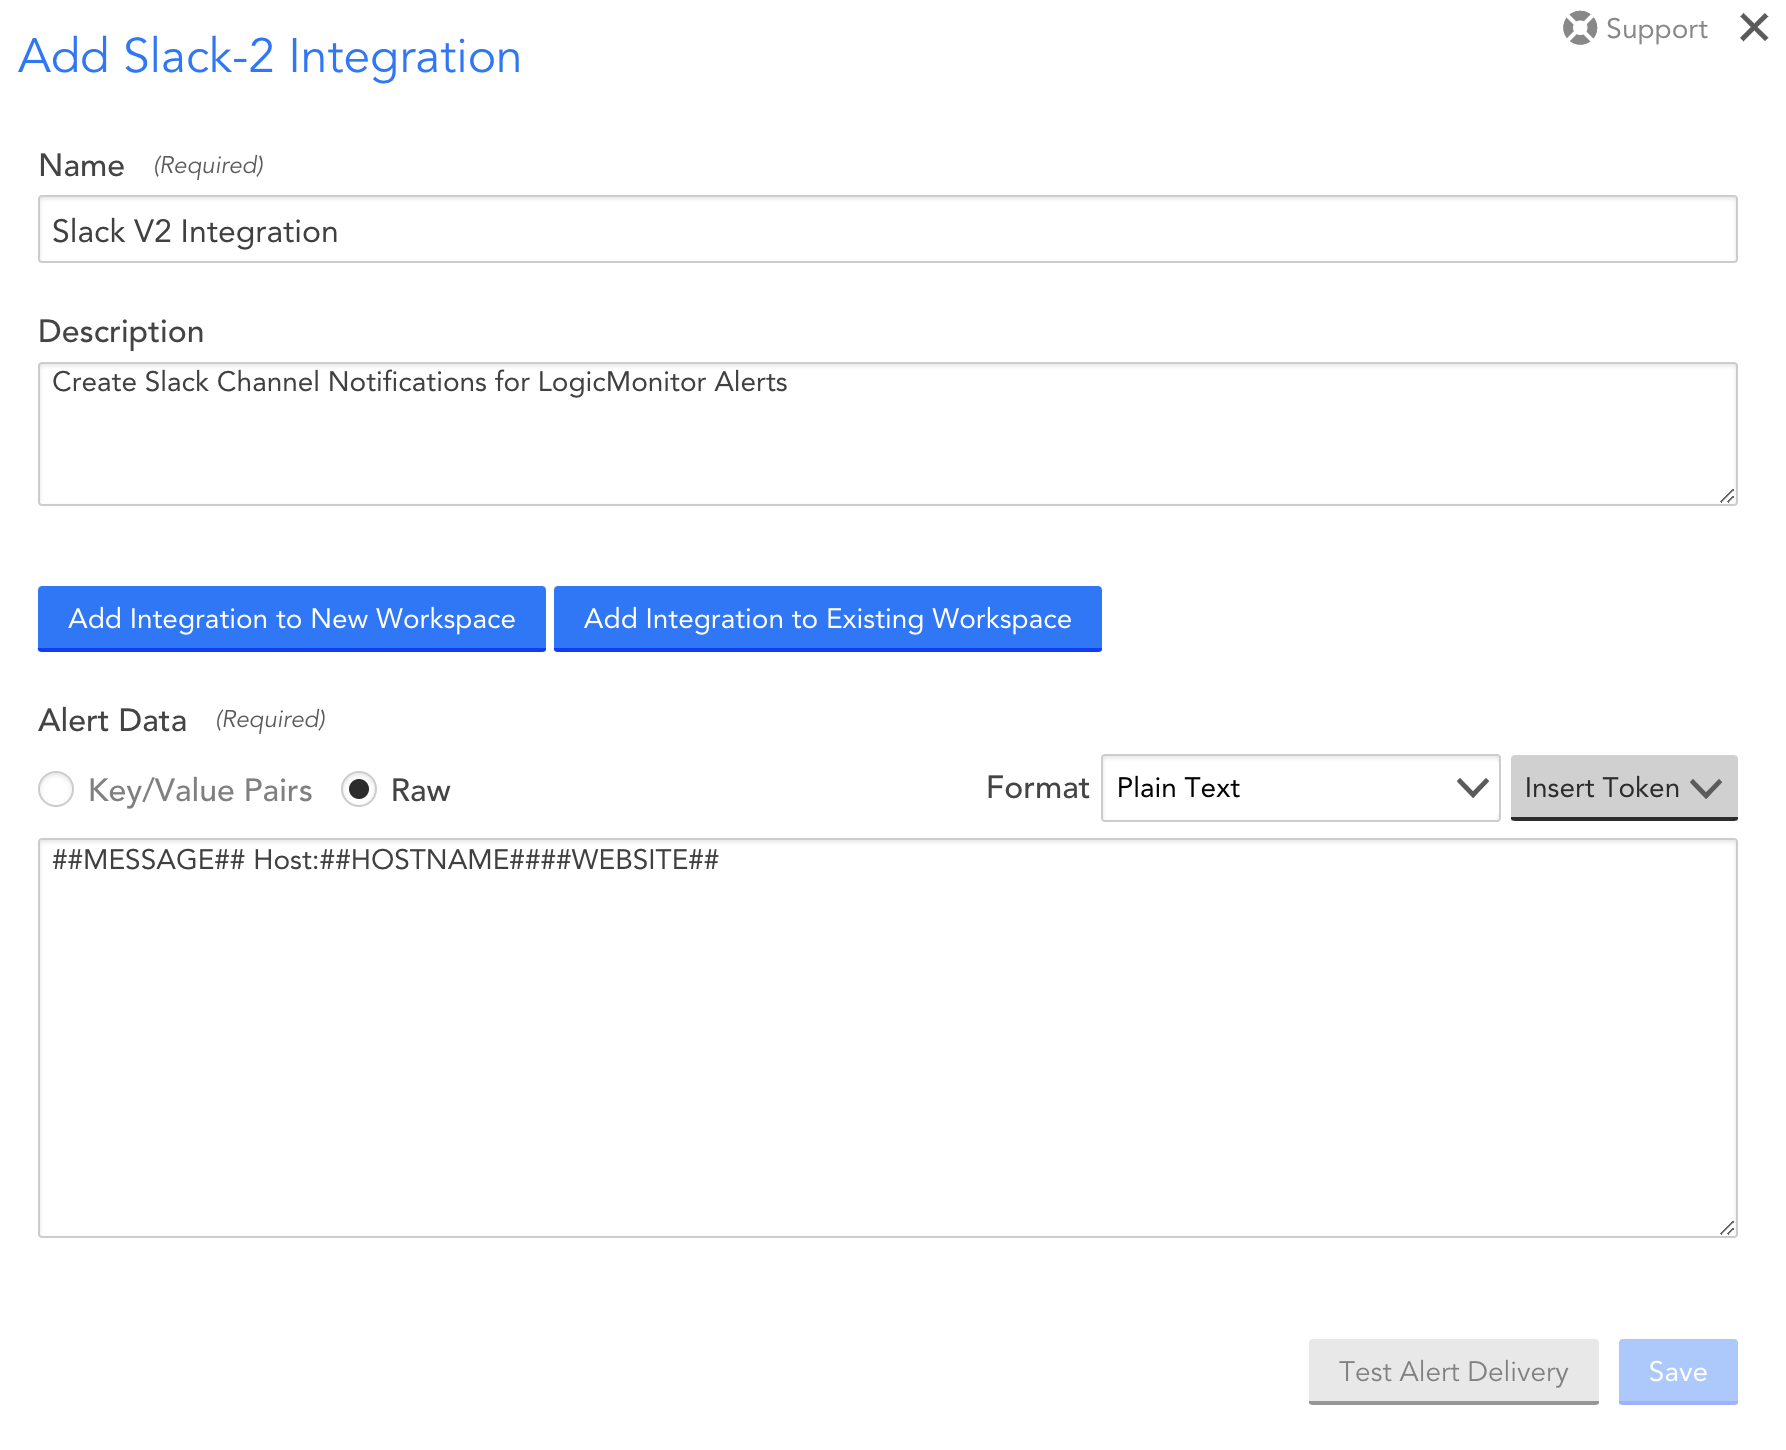
- Enter a unique name and description for the Slack integration. The value you enter for Name displays in the list of integrations.
Note: If the configuration dialog box that displays prompts for an incoming Webhook URL, you are looking at the configuration dialog box for LogicMonitor’s legacy Slack integration solution. Reach out to your CSM to ensure the new beta Slack integration is enabled for your portal.
- Select any of the following options to install and configure the LogicMonitor app:
- Add Integration to New Workspace to install and configure the LogicMonitor app for a Slack workspace that doesn’t yet have the app installed.
- Add Integration to Existing Workspace to create additional channel integrations for a Slack workspace that already has the LogicMonitor app installed. To know more about configuring additional integrations for a Slack workspace, see the Configuring Additional Slack Channels section of this support article.
- Depending on the level of permissions you have for your Slack workspace, the following Slack options appear:
- If you have the permissions to install apps to your Slack workspace, click the Allow button to grant the LogicMonitor app access to your Slack workspace and proceed to the next step.
- If you do not have the permissions to install apps to your Slack workspace, enter a note and click Submit to request install approval from a Slack app manager. Once permission has been granted, begin this set of steps again.
Note: If you are a member of multiple workspaces and need to select a workspace other than the one LogicMonitor initially presents, use the dropdown in the upper right corner to select (or log into) an alternate workspace. Consequently, you can install the app on a workspace that already has the LogicMonitor app installed. Installation (or reinstallation in this case) will proceed as usual, but we recommend you select the Add Integration to Existing Workspace button when wanting to create an integration for a workspace that already has the LogicMonitor app installed.
- You are redirected back to LogicMonitor where additional configurations are now available.
- From Alert Data, select Insert Token, and select the tokens you want for customizing the alert message. To know more about tokens, see Tokens.
Note:
- You can use only plain text format for the alert data message.
- The order of the tokens that you add in the Alert Data section determines how the alert message is displayed in Slack.
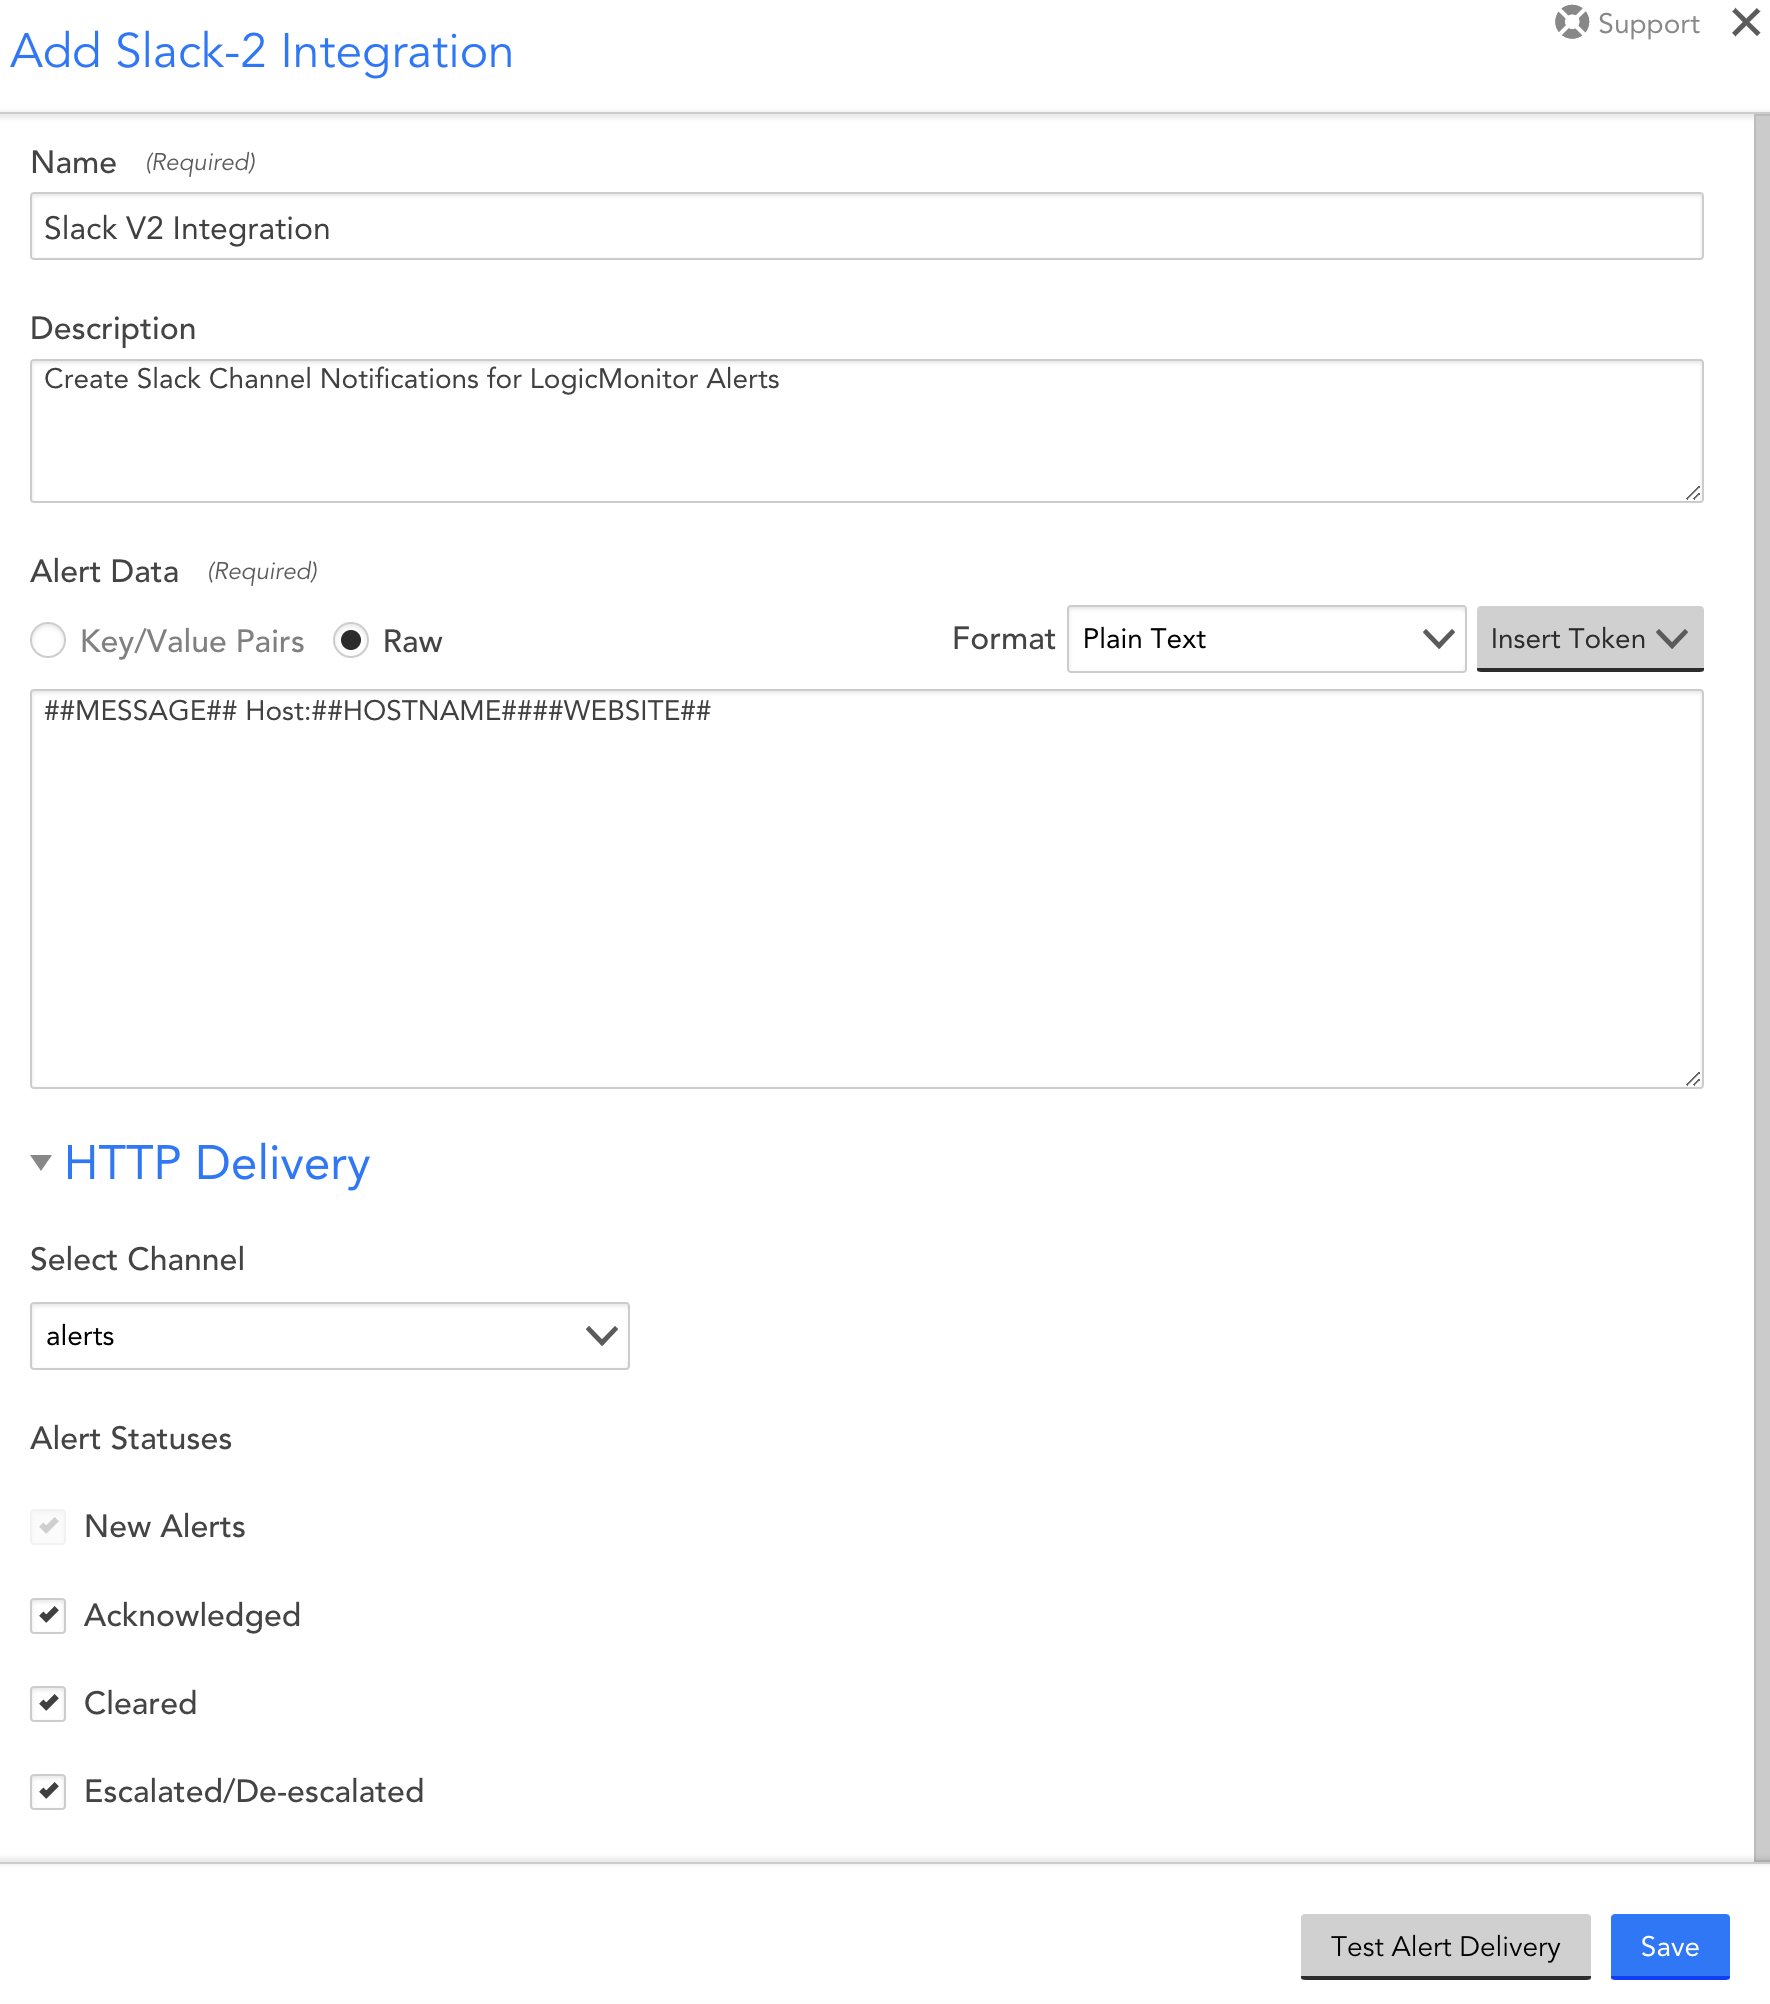
- Select the HTTP Delivery section to format and send the HTTP Post requests to create, update and/or close incidents.
By default, LogicMonitor will pre-populate four different HTTP requests, one for each of the following alert statuses:- New alerts (Active)
- Acknowledged alerts (Acknowledged)
- Cleared alerts (Cleared)
- Escalated alerts (Escalated)
- From the Select Channel dropdown menu, select the Slack channel to which LogicMonitor alert notifications will be routed. Only public channels are initially available from the dropdown; once set up, you could change a public channel to a private channel and it would persist as an option here.
Note: There is a one-to-one relationship between Slack integration records in LogicMonitor and Slack channels. To enable alert notifications to go to multiple channels in your Slack workspace, you must create additional integration records. For more information, see the Configuring Additional Slack Channels section of this support article.
- Select the alert statuses you would like routed to Slack. Receipt of new alerts is mandatory, but updates on the current alert status (escalated/de-escalated, acknowledged, cleared) are optional.
Note: For each request, you can select which alert statuses trigger the HTTP request. Requests are sent for new alerts (status: Active), and can also be sent for alert acknowledgements (status: Acknowledged), clears (status: Cleared) and escalations/de-escalations/adding note (status: Escalated). If the escalated status is selected and a note is added to the alert, an update request is sent whether the alert is active/cleared. If the escalated status is not selected and a note is added to the alert, a request is not sent.
- Select Save.
Note: The Test Alert Delivery button is not operational until after the initial LogicMonitor app installation process has been completed. If you’d like to send a synthetic alert notification to your new integration, open the record in edit mode after its initial creation. As discussed in the Testing Your Slack Integration section of this support article, you can come back to this dialog at any time to initiate a test.
Installation and Configuration from Slack
Follow these steps to initiate installation and configuration of the LogicMonitor app from within Slack:
- From the Slack App Directory, install the LogicMonitor app to your workspace.
- Depending on the level of permissions you have for your Slack workspace, Slack presents you with one of the following options:
- If you have the permissions necessary to install apps to your Slack workspace, click the Allow button to grant the LogicMonitor app access to your Slack workspace and proceed to the next step.
- If you do not have the permissions necessary to install apps to your Slack workspace, enter a note and click Submit to request install approval from a Slack app manager. Once permission has been granted, begin this set of steps again.
- You are redirected back to your Slack workspace. Open the LogicMonitor app from the left-hand menu where a direct message is waiting. Click the Get Started button from the direct message to configure the alert integration.

Note: This direct message is only available to the Slack user that performed the previous installation steps.
- At the Finish Your Install dialog, enter the name of your LogicMonitor portal into the Portal Name field. Your portal name can be found in the first portion of your LogicMonitor URL (for example, https://portalname.logicmonitor.com).
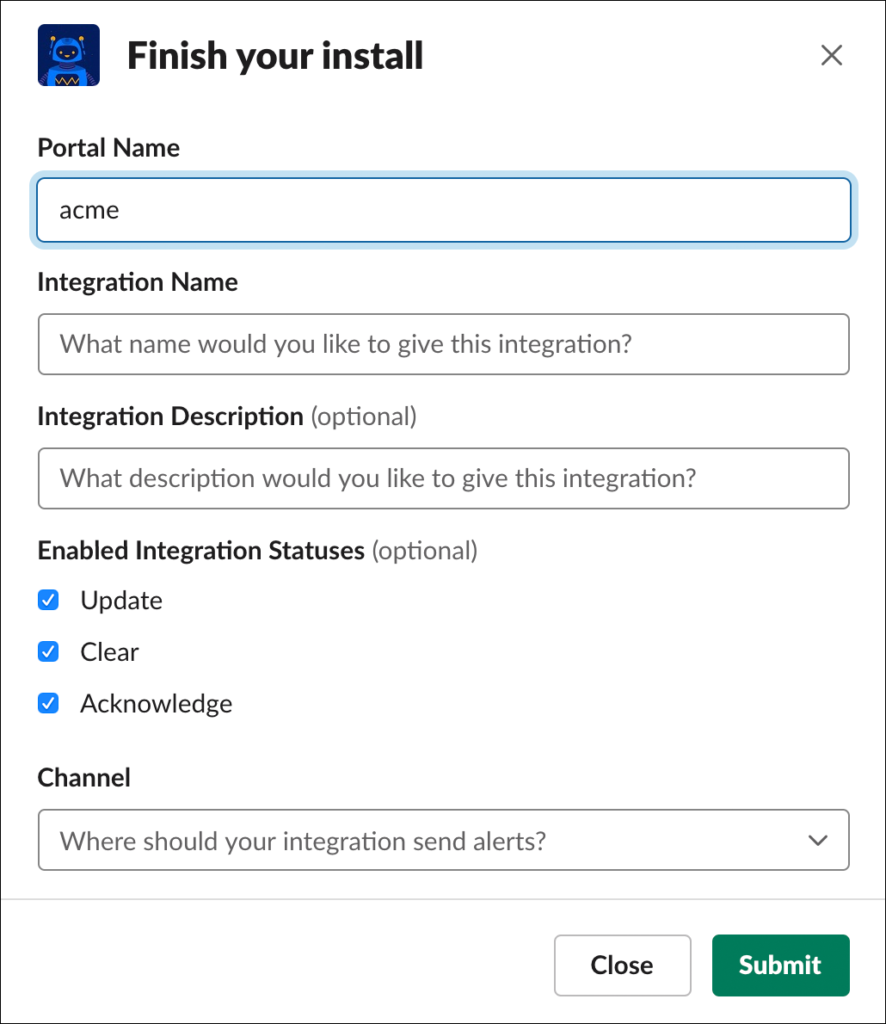
- In the Integration Name and Integration Description fields, enter a unique name and description for your Slack integration. The name entered here will be used as the title for the resulting integration record within LogicMonitor.
- Verify the alert statuses you would like routed to Slack. New alerts, which are not shown here for selection, are mandatory and part of the integration by default, but updates on the current alert status (escalated/de-escalated, acknowledged, cleared) are optional and can be disabled.
- From the Channel field’s dropdown menu, select the Slack channel to which LogicMonitor alert notifications will be routed.
- Click the Submit button. A new message displays to indicate successful creation of a LogicMonitor integration record for Slack. This new record can be viewed and edited in LogicMonitor by navigating to Settings | Integrations.
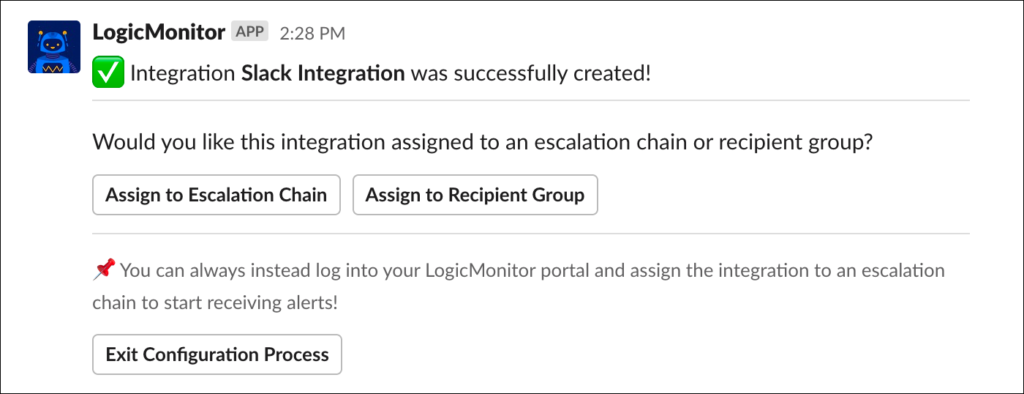
The success message also prompts you to optionally begin configuring alert routing conditions, which determines which alerts are delivered to the Slack channel that is associated with the integration. Because this workflow can be configured at a later time—via the LogicMonitor portal—you have the option to exit these configurations at any time by clicking the Exit Configuration Process button.
If you’d like to begin configuring alert routing conditions from Slack, you have two options from this dialog:
- Assign to Recipient Group. A recipient group is a single entity that holds multiple alert delivery recipients. Recipient groups are intended for use as time-saving shortcuts when repeatedly referencing the same group of recipients for a variety of different types of alerts. There is no requirement to make your Slack integration a member of a recipient group in order to have alerts routed to it; you can optionally directly reference the integration from an escalation chain if it doesn’t make sense to group alert delivery to Slack with other alert recipients. However, if a recipient group does make sense for your Slack integration, you can add your new Slack integration as a member of a new or existing recipient group. See the following Assigning Your Slack Integration to a Recipient Group section of this support article for more information.
- Assign to Escalation Chain. An escalation chain determines which recipients should be notified of an alert, and in what order. From Slack, you can add your new Slack integration as a stage in an existing escalation chain or you can create a new escalation chain. See the following Assigning Your Slack Integration to an Escalation Chain section of this support article for more information.
Assigning Your Slack Integration to a Recipient Group
There is no requirement to make your Slack integration a member of a recipient group in order to have alerts routed to it; you can optionally directly reference the integration from an escalation chain if it doesn’t make sense to group alert delivery to Slack with other alert recipients. For more information on the logic behind recipient groups, see Recipient Groups.
However, if a recipient group does make sense for your Slack integration, follow the next set of steps to add your new Slack integration as a member to a new or existing recipient group.
- Click the Assign to Recipient Group button to begin recipient group configuration.
- Indicate whether you’ll be adding this Slack integration as a member to an existing group or whether you’ll be creating a new recipient group.

- Update Recipient Group. To add this integration as a member to an existing recipient group, click the Update Recipient Group button and, from the Update a Recipient Group dialog that displays, select the recipient group from the provided dropdown. Slack limits dropdown menus to 100 selections, listed in alphabetical order; if your desired recipient group is not present due to this limitation, you can enter its name directly in the field below.
Note: By adding this integration to an existing recipient group, all escalation chains currently configured to route to that recipient group will automatically begin delivery to your Slack integration. This means that there may not be a need for any additional alert delivery configurations.
- Create Recipient Group. To add this integration as a member to a brand new recipient group, click the Create Recipient Group button. From the Add New Recipient Group dialog that displays, enter a unique name and description for the new recipient group.
Note: A brand new recipient group will eventually need to be assigned to an escalation chain in order for alerts to be routed to its members.
- Update Recipient Group. To add this integration as a member to an existing recipient group, click the Update Recipient Group button and, from the Update a Recipient Group dialog that displays, select the recipient group from the provided dropdown. Slack limits dropdown menus to 100 selections, listed in alphabetical order; if your desired recipient group is not present due to this limitation, you can enter its name directly in the field below.
- Click the Submit button. A new message displays to indicate successful assignment of the Slack integration to the new or existing recipient group. The recipient group record you just created or updated can be further edited in LogicMonitor by navigating to Settings | Alert Settings | Recipient Groups.
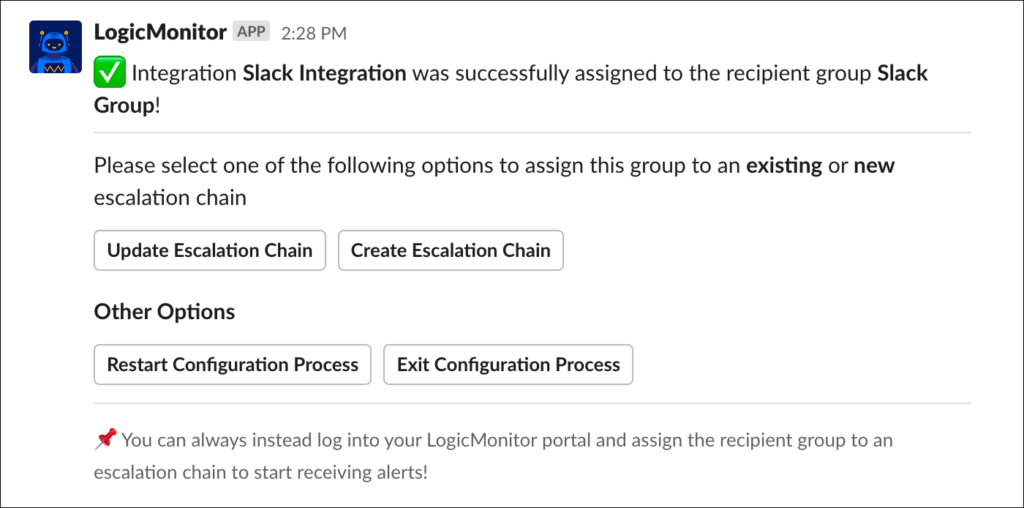
The success message also prompts you to optionally assign the recipient group you just edited/created to a new or existing escalation chain. Remember, if you just added your Slack integration to an existing recipient group, you may not necessarily need to perform any escalation chain configurations as all escalation chains currently configured to route to that recipient group will automatically begin delivering to your Slack integration. If you added your Slack integration to a brand new recipient group, the new recipient group will eventually need to be assigned to an escalation chain in order for alerts to be routed to its members.
If you’d like to assign your recipient group to a new or existing escalation chain, see the next section of this support article.
Assigning Your Slack Integration to an Escalation Chain
From Slack, you can add your new Slack integration (or a recipient group that contains your Slack integration) as a stage in an existing or new escalation chain. For more information on the role escalation chains play in alert delivery, see Escalation Chains.
The configuration of an escalation chain from within Slack can be arrived at in one of two ways:
- You chose to add your Slack integration directly to an escalation chain immediately after configuring a new Slack channel.
- You edited/created a new recipient group from Slack and are now adding that recipient group to an escalation chain.
Either way, whether you are adding your Slack integration directly to an escalation—or a recipient group containing your Slack integration as a member—the following set of steps is the same.
- Indicate whether you’ll be adding this integration/recipient group as a stage in an existing escalation chain or a new escalation chain.

- Update Escalation Chain. To add the integration/recipient group as a stage in an existing escalation chain, click the Update Escalation Chain button.
- From the Update a Chain dialog that displays, select the escalation chain from the provided dropdown. Slack limits dropdown menus to 100 selections, listed in alphabetical order; if your desired escalation chain is not present due to this limitation, you can enter its name directly in the field below. Click Next.
- Select the stage to which the integration/recipient group should be added from the provided dropdown.
Note: By adding this integration/recipient group to an existing escalation chain, all alert rules currently configured to route to that escalation chain will automatically begin delivery to your Slack integration. This means that there may not be a need for any additional alert delivery configurations.
- Create Escalation Chain. To add this integration/recipient group as a stage in a brand new escalation chain, click the Create Escalation Chain button and, from the Add New Escalation Chain dialog that displays, enter a unique name and description for the new escalation chain.
Note: The integration/recipient group is automatically assigned as the first stage of the new escalation chain. Escalation chains can have multiple stages and advanced configurations; to build on your new escalation chain, open it in LogicMonitor.
- Update Escalation Chain. To add the integration/recipient group as a stage in an existing escalation chain, click the Update Escalation Chain button.
- Click the Submit button. A new message displays to indicate successful assignment of the Slack integration or recipient group to the escalation chain. The escalation chain record you just updated/created can be further edited in LogicMonitor by navigating to Settings | Alert Settings | Escalation Chains.
The success message also prompts you to optionally assign the escalation chain you just edited/created to a new or existing alert rule. Remember, if you just added your Slack integration to an existing escalation chain, you may not necessarily need to perform any alert rule configurations as all alert rules currently configured to route to that escalation chain will automatically begin delivering to your Slack integration. If you added your Slack integration to a brand new escalation chain, the escalation chain will eventually need to be assigned to an alert rule in order for alerts to be routed through it.
If you’d like to assign your escalation chain to a new or existing alert rule, see the next section of this support article.
Assigning Your Escalation Chain to an Alert Rule
From Slack, you can assign your newly created/updated escalation chain to a new or existing alert rule using the following set of steps. (For more information on the role alert rules play in alert delivery, see Alert Rules.)
- From the success message that displays after editing/creating an escalation chain (see previous screenshot), indicate whether you’ll be assigning your escalation chain to an existing or new alert rule.
- Update Alert Rule. To assign the escalation chain to an existing alert rule, click the Update Alert Rule button and, from the Update an Alert Rule dialog that displays, select the alert rule from the provided dropdown. Slack limits dropdown menus to 100 selections, listed in alphabetical order; if your desired alert rule is not present due to this limitation, you can enter the name directly in the field below.
Note: Once this escalation chain is assigned to an existing alert rule, all alerts matching that alert rule will be delivered to your Slack integration.
- Create Alert Rule. To assign the escalation chain to a brand new alert rule, click the Create Alert Rule button and, from the Add New Alert Rule dialog that displays, configure the available settings.
Note: The settings available here (priority, alert level, escalation interval) mirror what is available within the LogicMonitor portal when creating a new alert rule. For a description of these settings, see Alert Rules.
- Update Alert Rule. To assign the escalation chain to an existing alert rule, click the Update Alert Rule button and, from the Update an Alert Rule dialog that displays, select the alert rule from the provided dropdown. Slack limits dropdown menus to 100 selections, listed in alphabetical order; if your desired alert rule is not present due to this limitation, you can enter the name directly in the field below.
- Click the Submit button. A new message displays to indicate successful assignment of the escalation chain to the alert rule.
- If you assigned the escalation chain to a brand new alert rule, you’ll need to open the alert rule in LogicMonitor (Settings | Alert Settings | Alert Rules) in order to additionally configure which resources/instances/datapoints will trigger alert rule matching.
Routing Alerts to Slack
Alert notifications are routed to Slack in the same way that all alert notifications are routed: via an escalation chain that is associated with an alert rule within LogicMonitor. Through these very flexible mechanisms, you have complete control over which alerts are delivered to the Slack channel that is associated with the integration.
If you installed the LogicMonitor app from Slack, you may have already configured the recipient group, escalation chain, and/or alert rule responsible for delivering alert notifications to Slack, as outlined in these three previous sections:
- Assigning Your Slack Integration to a Recipient Group
- Assigning Your Slack Integration to an Escalation Chain
- Assigning Your Escalation Chain to an Alert Rule
If you installed the LogicMonitor app from LogicMonitor (or if you installed from Slack but chose to exit out of these alert routing configurations), you can configure alert routing to Slack by creating escalation chains and alert rules in LogicMonitor, as discussed in Escalation Chains and Alert Rules respectively.
Adding/Inviting the App to a Slack Channel
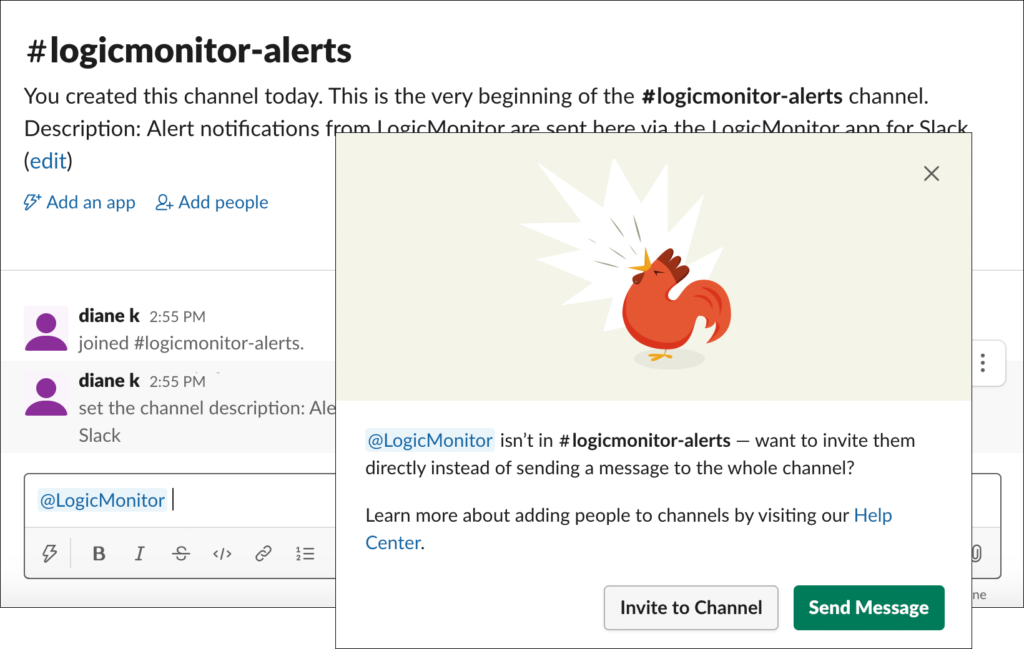
As with all Slack apps, the LogicMonitor app will not be allowed to send messages to your chosen Slack channel until it’s been added or invited to the channel. In the most cases, LogicMonitor will automatically add/invite the app to the Slack channel during install and configuration. The exception is if you’re creating an integration for a private channel that doesn’t already have the app added. In this rare instance, apps can be added to the private channel from the channel’s details or by opening the channel and mentioning the app (@logicmonitor) in a message, as shown next.
Configuring Additional Slack Channels (Optional)
As part of the app installation process, you will have configured one Slack channel to which alert notifications will be routed. This Slack channel is referenced by the resulting integration record that resides in LogicMonitor.
There is a one-to-one relationship between the integration records that reside in LogicMonitor and Slack channels. Therefore, if you’d like alert notifications to go to multiple channels within a single Slack workspace, you’ll need to create multiple integration records—one per channel. As with the installation process, this can be initiated from either your LogicMonitor portal or your Slack workspace.
Configuring Additional Slack Channels from LogicMonitor
To configure an additional Slack channel from LogicMonitor:
- Select Settings | Integrations | Add | Slack.
- In the configuration dialog, enter a unique name and description for your Slack integration.
- Click the Add Integration to Existing Workspace button.
- From the Select Workspace field’s dropdown menu, select the Slack workspace that will be assigned to the integration.
- From the Select Channel field’s dropdown menu, select the Slack channel to which LogicMonitor alert notifications will be routed.
Note: The channels available for selection correspond to the workspace selected in the previous field.
- Check the alert statuses you would like routed to Slack. Receipt of new alerts is mandatory, but updates on the current alert status (escalated/de-escalated, acknowledged, cleared) are optional.
- If you’d like to test your new integration before saving, click the Test Alert Delivery button to deliver a synthetic alert notification to the Slack channel specified on this dialog.
Note: As discussed in the Testing Your Slack Integration section of this support article, you can come back to this dialog at any time to initiate a test.
- Click Save.
- Don’t forget to configure alert notification routing to your new Slack channel (integration record), as discussed in the Routing Alerts to Slack section of this support article.
Configuring Additional Slack Channels from Slack
To configure an additional Slack channel from Slack:
- Open a Slack channel in the workspace in which the LogicMonitor app is installed and perform one of the following actions:
- Mention the LogicMonitor app (@logicmonitor) in a message and click the Get Started button from the direct message that the LogicMonitor app sends in response.
- Enter the slash command
/lm configure [integration name]. See the Slack Slash Commands section of this support article for more information on slash commands.
- Complete the fields presented on the Add a New Integration dialog.
Note: This dialog prompts you to complete the same fields requested when initially installing the LogicMonitor app (with the exception of the Portal Name field which is not necessary in this context). These fields are documented in the Installation and Configuration from Slack section of this support article.
- Click the Submit button. A new message displays to indicate successful creation of a LogicMonitor integration record for Slack. This new integration record can be viewed and edited in LogicMonitor by navigating to Settings | Integrations.
The success message also prompts you to optionally begin configuring alert routing conditions, which determines which alerts are delivered to the Slack channel that is associated with the integration. Because this workflow can be configured at a later time—via the LogicMonitor portal—you have the option to exit these configurations at any time by clicking the Exit Configuration Process button.
If you’d like to begin configuring alert routing conditions from Slack at this time, see the Installation and Configuration from Slack section of this support article where alert delivery configuration from Slack is documented in detail.
Testing Your Slack Integration
Once you’ve completed the required setup steps, you can test the connection between your Slack workspace and LogicMonitor portal by opening the integration record in LogicMonitor (Settings | Integrations) and clicking the Test Alert Delivery button. If successful, a synthetic read-only alert is sent to the Slack channel specified in the integration record.
Note: You can initiate a more thorough test, one that tests the entire chain of events from alert triggering to alert rule matching to alert delivery, from the resource or website whose alerts you want delivered to Slack. For more information, see Testing Alert Delivery.
Viewing and Responding to Alerts from Slack
Alert notifications are posted to your Slack channel with summary information that includes alert severity level, alert ID, alert message, and other key pieces of information.
As discussed in the following sections, there are several actions you can perform from alert notifications in Slack, depending upon the type of alert.
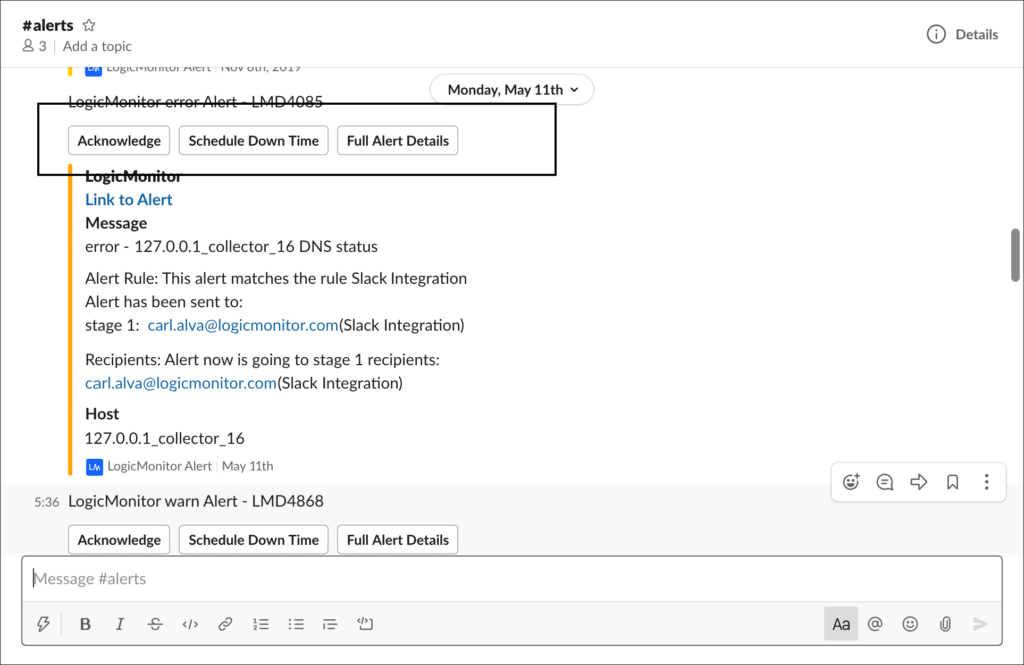
Note: A user must have the appropriate acknowledge and SDT permissions (as assigned on a resource group or website group basis) in LogicMonitor in order to perform these actions. For more information on assigning this level of permissions for resource and website groups, see Roles.
Open the Alert in LogicMonitor
Any alert notification can be directly linked to and opened in LogicMonitor by clicking the “Link to alert” hyperlink that is provided immediately above the alert message. The alert opens in the Alerts page. You will be prompted to log into LogicMonitor if you are not currently logged in.
Acknowledge the Alert
If viewing an active alert, you have the option to acknowledge the alert using the Acknowledge button. As discussed in Guidelines for Responding to Alerts, acknowledging an alert suppresses further routing of notifications for that particular alert.
Note: You can optionally enter the slash command /lm ack [alert ID] [comment - optional] to acknowledge an alert. See the Slack Slash Commands section of this support article for more information on available slash commands.
Upon successful acknowledgement, you will receive a confirmation message in Slack that the alert was acknowledged. If you attempt to acknowledge an alert that has since cleared or is inactive or has already been acknowledged, an ephemeral error message displays (visible only to you) explaining why the alert couldn’t be successfully acknowledged.
Assuming your Slack integration configuration was set up to include routing of alert notifications with an acknowledged status, you’ll also receive a new alert notification indicating acknowledged status.
Put the Resource or Instance Triggering the Alert into Scheduled Downtime (SDT)
If viewing an active alert, you have the option to put the resource (including a Collector resource) or instance that is triggering the alert into SDT using the Schedule Down Time button. As discussed in Guidelines for Responding to Alerts, SDT suppresses the routing of alert notifications for that resource or instance for the duration of SDT.
Note: You can optionally enter the slash command /lm sdt [alert ID] [comment - optional] to SDT an alert. See the Slack Slash Commands section of this support article for more information on available slash commands.
Upon successful scheduling of SDT, you will receive confirmation in Slack that the resource or instance was placed into SDT. If your attempt to schedule SDT is unsuccessful, an ephemeral error message displays (visible only to you) explaining why the alert couldn’t be successfully placed into SDT.
View the Full Details of the Alert
If viewing an active alert, you have the option to view additional details that aren’t initially presented by the alert notification using the Full Alert Details button. Upon clicking this button, an ephemeral message displays (visible only to you) with the additional details.
Slack Slash Commands
The following slash commands can be entered to interact with LogicMonitor alerts and integrations. With the exception of the SDT command, all commands can be performed from any channel in the Slack workspace, regardless of whether the LogicMonitor app has been invited to the channel.
Help Slash Command
Returns a message offering useful information, shortcuts to common actions, and links to a list of currently available slash commands and this support page.
Command: /lm help
Acknowledge Slash Command
Acknowledges a LogicMonitor alert.
Command: /lm ack [alert ID] [comment - optional]
Examples:
/lm ack LMD001/lm ack LMD001 investigating now
Schedule Downtime (SDT) Slash Command
Schedules downtime for a LogicMonitor alert, and its associated triggering resource or instance.
Command: /lm sdt [alert ID] [comment - optional]
Examples:
/lm sdt LMD001/lm sdt LMD001 scheduled sdt for 30 minutes
Note: Unlike the other slash commands which can be performed from any channel in the Slack workspace, this command requires that the LogicMonitor app be explicitly invited to the channel from which it is performed.
Configure Slash Command
Creates a new Slack integration or edits an existing Slack integration. The Update Integration dialog opens if this command is entered with the name of an existing Slack integration. Otherwise, the Add New Integration dialog opens.
Command: /lm configure [integration name - optional]
Examples:
/lm configure/lm configure Slack Alert Integration
Note: This command should only be used once the initial app installation is fully complete, after the workspace has been linked to your company via creation of the first integration record.
Uninstall Slash Command
Completely uninstalls the LogicMonitor app from the Slack workspace along with all associated Slack integration records for the workspace. See the App Uninstallation section of this support article for more details on uninstalling the LogicMonitor app.
Command: /lm uninstall
Note: This command should only be used once the app installation is fully complete and at least one Slack integration record exists in LogicMonitor.
Troubleshooting
Overall, the error messages returned by Slack and/or LogicMonitor when working with the Slack integration are specific and self explanatory. However, there are a couple that may require action on your end in order to resolve; these are discussed next.
Slack Username Mapping
Error message: Sorry, we couldn’t map your Slack username to a LogicMonitor account and couldn’t complete the requested action. A workaround will be available soon!
Error condition: When receiving requests from Slack (for example, acknowledge an alert or create an integration record), LogicMonitor attempts to authenticate the Slack username. If authentication cannot be made and the above error message is returned.
Solution: Contact customer support for guidance. (As the error message implies, LogicMonitor is working on improving the user validation process between Slack and LogicMonitor.)
Insufficient Permissions
Error message: You don’t have permission in LogicMonitor to perform this action. Please contact a LogicMonitor admin to obtain the needed permissions to resolve this issue.
Error condition: The user attempting to perform the action from Slack (for example, acknowledge or SDT an alert), configure an integration), doesn’t have the necessary permissions in LogicMonitor to perform the action.
Solution: Obtain the appropriate LogicMonitor permissions. In order to configure any aspect of a Slack integration, a LogicMonitor user must have manage-level permissions for integrations. In order to acknowledge or SDT alerts from Slack, a user must have acknowledge-level permissions for the resource or website group from which the alert is being triggered. For more information on these permissions, see Roles.
App Uninstallation
The LogicMonitor app can be uninstalled from a workspace via your LogicMonitor portal or via a Slack channel.
Uninstalling from LogicMonitor
A dialog box that warns of imminent app uninstallation will appear when you attempt to delete the only remaining Slack integration record associated with a particular Slack workspace. Confirming the delete action will effectively uninstall the app from the Slack workspace associated with the deleted integration record.
Uninstalling from Slack
The LogicMonitor app can be uninstalled from Slack by entering the slash command /lm uninstall. (See the Slack Slash Commands section of this support article for more information on available slash commands.)
Upon uninstalling from Slack, the app will be deleted from your Slack workspace and all Slack integration records that reside in LogicMonitor that are associated with the workspace will also be deleted. Additionally, any escalation chains, recipient groups and alert rules that exclusively reference these integrations will also be deleted, with the exception of escalation chains configured to deliver Collector down alerts.
Disclaimer: This content is no longer maintained and will be removed at a future time.
Group Chat Tools, such as 37Signals Campfire have been adopted by many companies for communication management. It is straightforward to configure LogicMonitor to deliver alerts to group chat rooms via a Custom HTTP Alert Delivery Method.
A good use of this integration is to both avoid email alert overload, and to increase responsiveness to an alert. Having alerts sent to Campfire requires:
- Getting an Authentication Token from Campfire
- Configuring a Custom HTTP Alert Delivery Method within LogicMonitor
- Adding the Custom HTTP Alert Delivery Method to an escalation chain
1. Getting an Authentication Token from Campfire
NOTE: We recommend that you make a separate campfire user named LogicMonitor which you will use to log in when generating the authentication token. This user will be the one shown as speaking the alerts into the room, and that user will not receive the alert in the chatroom unless they refresh the page.
Obtain a Campfire “Auth Token”
Login to Campfire from your web browser. From your home page click the “My Info” link at the top right. The token will be on this page.
The only other information that you will need from Campfire is the URL for the room you want to be alerted in, which you can copy directly from your browser while in the relevant room. For example:
https://yourcompany.campfirenow.com/room/570279
That’s all we need from Campfire. Now on to getting it into LogicMonitor!
2a. Adding your Campfire Auth Token to LogicMonitor
The Auth Token will be be used by a LogicMonitor Custom HTTP Alert Delivery Method to route the alerts into Campfire. While you could hardcode it directly into the Custom HTTP Alert Delivery Method, it is a better practice to define it as a Property within LogicMonitor, just as you would set other authentication credentials such as an SNMP community or a MySQL password.
The properties we will be setting are:
- campfire_api.pass
This property corresponds to the “Auth Token” gathered earlier from Campfire.
From the “Devices” tab in LogicMonitor, select Manage at the account level (click the company name in the navigation pane) and set the properties:
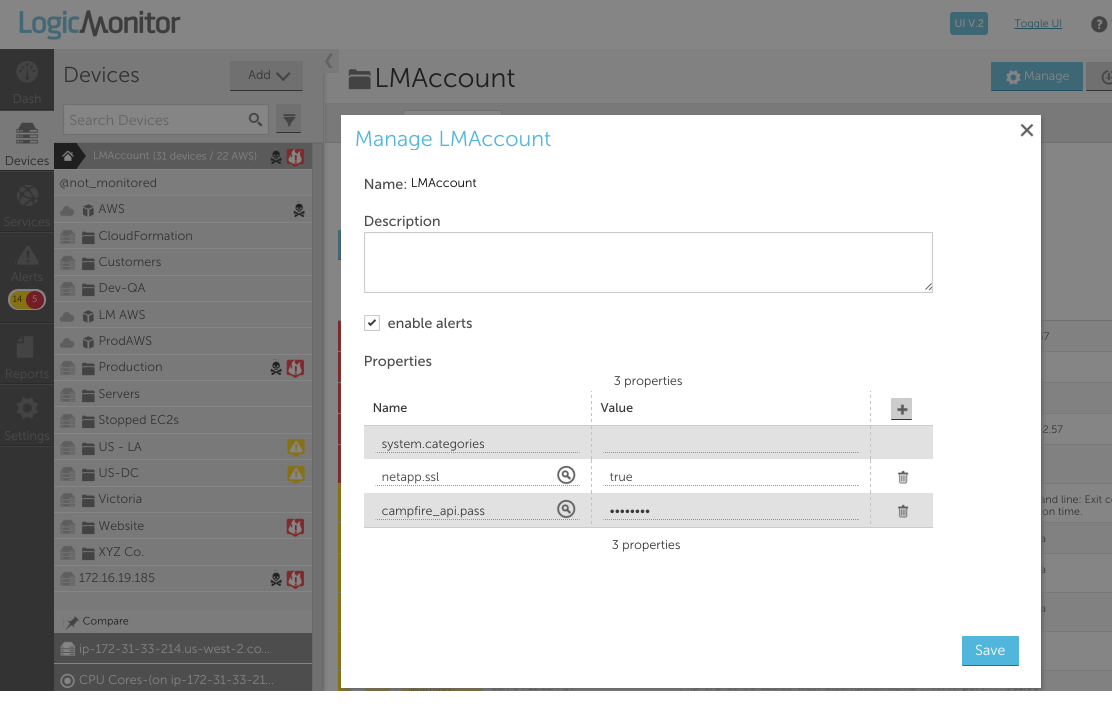
2b. Creating a Custom HTTP Alert Delivery Method
Add a custom HTTP alert delivery method from Settings | Integrations | Add | Custom HTTP Delivery Method:
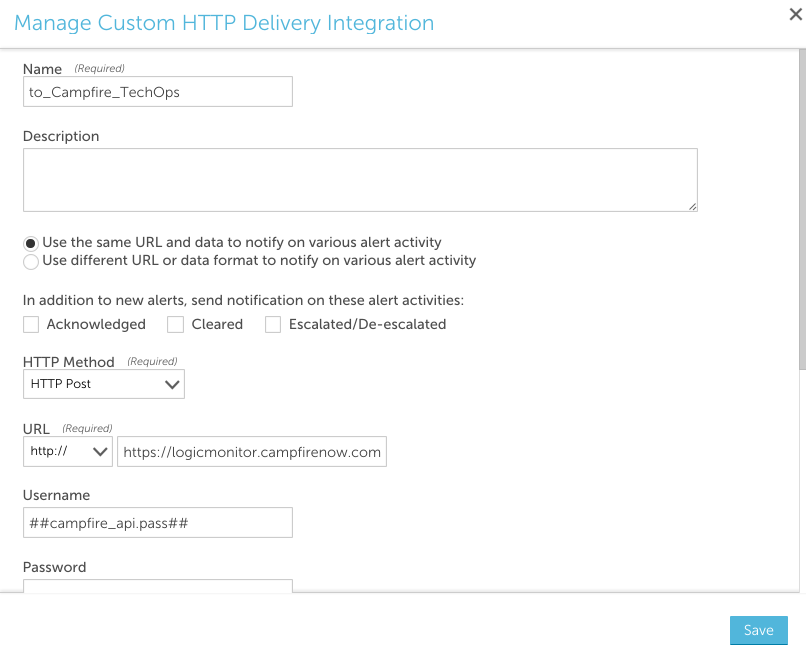
For each request, you can select which alert statuses trigger the HTTP request. Requests are sent for new alerts (status: Active), and can also be sent for alert acknowledgements (status: Acknowledged), clears (status: Cleared) and escalations/de-escalations/adding note (status: Escalated).
Note: If the escalated status is selected and a note is added to the alert, an update request is sent whether the alert is active/cleared. If the escalated status is not selected and a note is added to the alert, a request is not sent.
The following fields are set:
- HTTP Method: HTTP Post
- URL: https://yourcompany.campfirenow.com/room/570279/speak.xml Remember: This is the url from YOUR specific chat room and you need to append /speak.xml to the end
- Username: ##campfire_api.pass##
- Password: (you don’t need a password the authentication token counts as the username and password)
- Alert Data: <message><body>##ALERTID## ##LEVEL## ##HOST## ##DATASOURCE## ##DATAPOINT##: ##VALUE## ##THRESHOLD## (##ALERTSTATUS##) https://<MY-SITE>.logicmonitor.com/santaba/uiv3/alert_mobile/index.jsp#detail~id=LME254587&type=eventAlert </body></message>
- Data Format: XML Data
3. Configure an Alert Rule and Escalation Chain
The Custom HTTP Alert Delivery Method you just created (“to_Campfire_TechOps” in our example) is now a new alert destination for any user. For the purpose of Campfire, you will simply want to add one user with this new alert destination to any escalation chain in which you want a message to a Campfire room to be part of the chain. In the example below, we chose the user Bill. The only difference in using different users is if a reference is made to the “##ADMIN##” token in the Alert Data. If that token is present, than the user for which the alert is being generated will be substituted. In this case we are not referencing ##ADMIN##, so any active user will work:

Any alert that hits the “CampfireErrors” escalation chain (following the routing of the defined rules) will now send an alert message to the specified Campfire room (“TechOps: in our example)

Disclaimer: This content is no longer maintained and will be removed at a future time.
Puppet is IT automation software that enables system administrators to manage provisioning and configuration of their infrastructure. LogicMonitor’s Puppet module allows your Puppet infrastructure code to manage your LogicMonitor account as well.
Notes:
- This module is only compatible with linux servers. Windows compatibility may be added in future releases.
Module Overview
LogicMonitor’s Puppet module defines 5 classes and 4 custom resource types:
Classes
- logicmonitor: Handles setting the credentials needed to interact with the LogicMonitor API
- logicmonitor::config: Provides the default credentials to the logicmonitor class
- logicmonitor::master: Collects the exported lm_host resources and lm_hostgroup resources. Communicates with the LogicMonitor API
- logicmonitor::collector: Handles LogicMonitor collector management for the device. Declares an instances of lm_collector and lm_installer resources
- logicmonitor:host: Declares an exported lm_host resource
Resource Types
- lm_hostgroup: Defines the behavior of the handling of LogicMonitor device groups. We recommend using exported resources
- lm_host: Defines the handling behavior of LogicMonitor devices. Used only within the logicmonitor::host class
- lm_collector: Defines the handling behavior of LogicMonitor collectors. Used only with the logicmonitor::collector class
- lm_installer: Defines the handling behavior of LogicMonitor collector binary installers. Used only within the logicmonitor::collector class
Requirements
In order to use LogicMonitor’s Puppet Module, you’ll need to make sure you have the following:
- Ruby 1.8.7 or 1.9.3
- Puppet 3.X
- JSON Ruby gem (included by default in Ruby 1.9.3)
- Store Configs in Puppet
Store configs are required for the exported resources used by this module. To enable store configs, add storeconfigs = true to the [master] section of your puppet.conf file, like so:
# /etc/puppet/puppet.conf
[master]
storeconfigs = true
Once enabled, Puppet will need a database to store the config info. Puppet recommends PuppetDB, although other database solutions are available.
Device Configuration
As with your other LogicMonitor devices, the collector will need to communicate with the device in order to gather data. Make sure the correct properties and authentication protocols are configured as part of the Puppet installation.
Installing the LogicMonitor Puppet Module
You can install LogicMonitor’s original Puppet Module via GitHub:
$ cd /etc/puppet/modules
$ git clone git: //github.com/logicmonitor/logicmonitor-puppet.git
$ mv logicmonitor-puppet logicmonitor
Getting Started
Once you’ve installed LogicMonitor’s Puppet Module, you can get started using the following sections:
Create a new user for Puppet
We recommend you create a new user with administrator privileges in your Logic Monitor account that you will use exclusively within your Puppet nodes to track changes made by Puppet in the audit log.
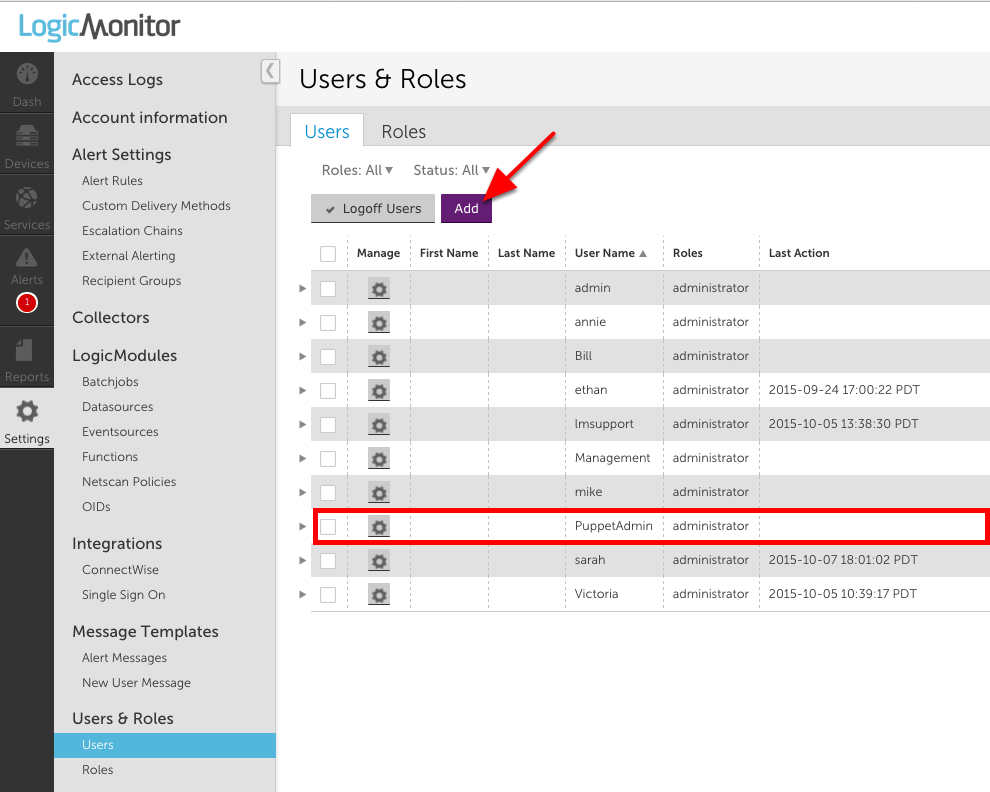
Configuration
- Class: logicmonitor (modules/logicmonitor/manifests/init.pp)
This is the top level class for the LogicMonitor module. It’s purpose is to set the LogicMonitor credentials to be used by all the child classes. Explicit declaration of this class will override the default credentials set in the logicmonitor::config class. This class does not need to be explicitly declared.
| Parameter | Description | Inputs |
| account | Your LogicMonitor account name For example, if you log in to https://mycompany.logicmonitor.com, your account should be “mycompany” | String Default to $account logicmonitor::config |
| user | The username of a LogicMonitor user with access to manage hosts, groups, and collectors. Actions taken by Puppet show up in the audit log as this user. We recommend creating a dedicated user for your Puppet account. | String. Default to $user in logicmonitor::config |
| password | The password associated with the LogicMonitor user Puppet will be making changes on behalf of. | String Default to $password in logicmonitor::config |
- Class: logicmonitor::config (modules/logicmonitor/manifests/config.pp)
This class is used to set the default LogicMonitor account credentials for your Puppet environment. This class does not need to be explicitly declared.
Parameters: None
- Class: logicmonitor::master (modules/logicmonitor/manifests/master.pp)
The master class enables communication between the LogicMonitor module and your LogicMonitor account for group and device management. This class acts as the collector for the lm_host and lm_hostgroup exported resources. This prevents conflicts and provides a single point of contact for communicating with the LogicMonitor API. This class must be explicitly declared on a single device. NOTE: All devices with the logicmonitor::collector and logicmonitor::master classes will need to be able to make outgoing http(s) requests.
Parameters: none
- Class: logicmonitor::collector (modules/logicmonitor/manifests/collector.pp)
This class manages the creation, download and installation of a LogicMonitor collector on the specified node.
- The only absolute requirement for a collector node is that is is Linux and can make an outgoing SSL connection over port 443
- We suggest the collector system have at least 1G of RAM
- If the collector will be collecting data for more than 100 hosts, it is a good idea to dedicate a machine to it
| Parameter | Description | Inputs |
| install_dir | The path to install the LogicMonitor collector. | A valid directory path. Default to “/usr/local/logicmonitor” |
Examples
To add collector to a node:
include logicmonitor::collectorIf you want to specify a specific location where you’d like to install a collector:
class{"logicmonitor::collector":
install_dir => $install_dir,
}
Class: logicmonitor::host (modules/logicmonitor/manifests/host.pp)
This class is used to add devices to your LogicMonitor account. Devices which are managed through Puppet will have any properties not specified in the device definition removed.
| Parameter | Description | Inputs |
| collector | The fully qualified domain name of the collector machine. You can find this by running hostname -f on the collector machine. | String. No Default (required) |
| hostname | The IP address or fully qualified domain name of the node. This is the way that the collector reaches this device. | String. Default to $fqdn |
| displayname | The human readable name to display in your LogicMonitor account. e.g. “dev2.den1” | String. Default to $fqdn |
| description | The long text description of the host. This is seen when hovering over the device in your LogicMonitor account. | String. No Default (Optional) |
| alertenable | Turn on or off alerting for the device. If a parent group is set to alertenable=false alerts for child hosts will be turned off as well. | Boolean, Default to True. |
| groups | A list of groups that the device should be a member of. Each group is a String representing its full path. E.g. “/linux/production” | List. No Default (Optional) |
| properties | A hash of properties to be set on the host. Each entry should be “propertyName” => “propertyValue”. E.g. {“mysql.port” => 6789, “mysql.user” => “dba1”} | Hash. No Default (Optional) |
Examples
class {'logicmonitor::host':
        collector => "qa1.domain.com",
        hostname => "10.171.117.9",
        groups => ["/Puppetlabs", "/Puppetlabs/Puppetdb"],
        properties => {"snmp.community" => "Puppetlabs"},
        description => "This device hosts the PuppetDB instance for this deployment",
      }

class {'logicmonitor::host':
        collector => $fqdn,
        displayname => "MySQL Production Host 1",
        groups => ["/Puppet", "/production", "/mysql"],
        properties => {"mysql.port" => 1234},
      }
Adding a Device Group:
Type: Lm_hostgroup Device groups should be added using an exported resource to prevent conflits. It is recommend device groups are added from the same node where the logicmonitor::master class is included. Devices can be included in zero, one, or many device groups. Device groups are used to organize how your LogicMonitor Devices are displayed and managed and do not require a collector . Properties set at the device group level will be inherited by any devices added to the group.
| Parameter | Description | Inputs |
| namevar | The puppet namevar is used to uniquely identify the resource. If the fullpath parameter is empty, the namevar is used as the fullpath. | String. No default (required) |
| fullpath | The full path of the host group. E.g. a host group “bar” with parent group “foo” would have the fullpath of “/foo/bar” | String. Default to $namevar. (required) |
| ensure | Puppet ensure parameter. | present/absent. No Default (required) |
| alertenable | Turn on/off alerting for the group. If alertenable is false, all child groups and hosts will have alerting disabled | Boolean. Default to True. |
| properties | A hash of properties to be set on the host. Each entry should be “propertyName” => “propertyValue”. E.g. {“mysql.port” => 6789, “mysql.user” => “dba1”}. The properties will be inherited by all child groups and hosts | Hash, No Default (optional) |
| description | The long text description of the host. This is seen when hovering over the group in your LogicMonitor account. | String. No Default (optional) |
To add and edit properties of device groups use lm_hostgroup, example below.
@@lm_hostgroup{"/parent/child/grandchild/greatgrandchild":
  ensure => present,
  alertenable => true,
  properties => {"snmp.community" => "n3wc0mm", "mysql.port" => 9999,"fake.pass" => "12345"},
  description => "This is the description that shows up in the yellow box from hover in your LM account",
}
For more examples of the module in action, check out logicmonitor-puppet/README.md.
LogicMonitor’s Custom Email Delivery integration allows you to format alert notification emails in a more consistent format, without explanatory text. Custom email delivery enables you to define the precise format of the email subject and body, so that it can be easily parsed by the recipient system.
Emails generated by this alert delivery method are not actionable. You cannot reply to them in order to acknowledge, SDT, or escalate an alert. Additionally, only new alerts and cleared statuses will trigger notifications to this type of integration.
Setting Up a Custom Email Delivery Integration
You can add a new Custom Email Delivery integration from Settings | Integrations. Click the Add button and then click Custom Email Delivery to open the Add Custom Email Delivery Integration configuration dialog, shown (and discussed) next.
Note: Once created, your Custom Email Delivery integration must be included as the contact method for a recipient in an escalation chain, and that escalation chain must be referenced by an alert rule in order for alert notifications to be delivered using this integration method.
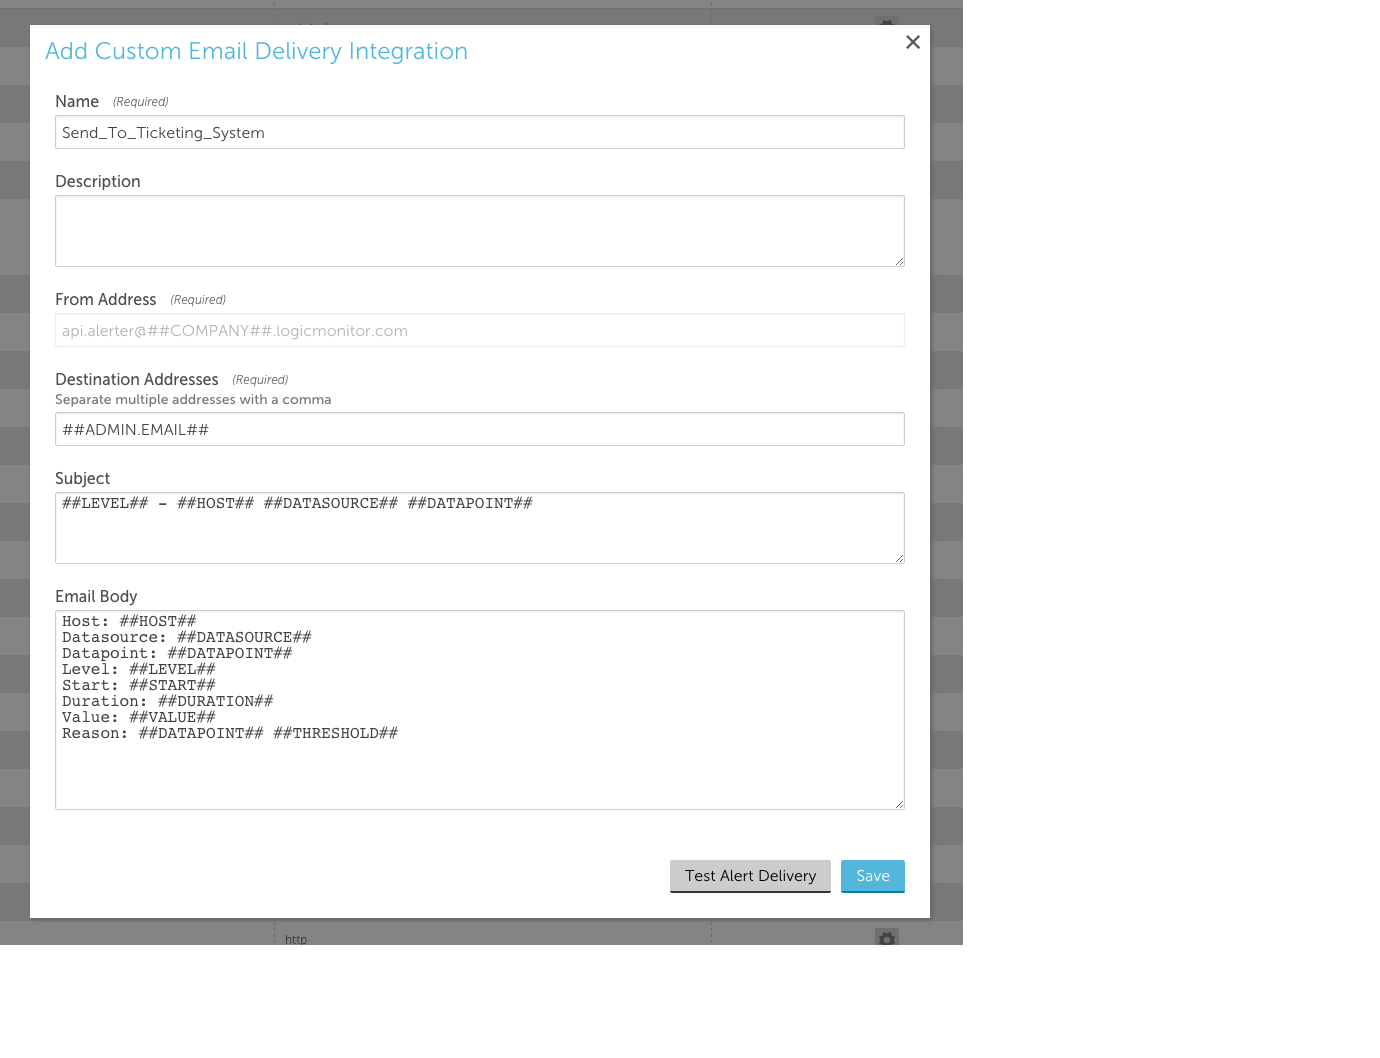
Name
The name of the integration.
Description
The description for the integration.
From Address
This field displays the email address from which your custom email notifications will be sent. It is auto-generated by LogicMonitor based on the parameters shown and is the same sender address used for all LogicMonitor alert notifications.
Destination Addresses
The email address(es) to which alert notifications will be sent. You can separate multiple addresses with commas.
Use the ##ADMIN.EMAIL## token to dynamically reference the email address associated with the user in the escalation chain to which the alert is routed.
Note:
- After adding a new email address to receive LogicMonitor emails, select the Save & verify button. An email is sent to the newly added email address with a verification link to verify the email address.
- The verification link is valid only for 24 hours from the time of receiving the email. If the link expires, the user has to request the administrator for the verification link. The administrator can select Save & verify to resend the verification email.
- Make sure to get the email address verified. If an email address is not verified, the LogicMonitor custom emails will not be sent to that email address.
- The verification email is sent only to the email address that is newly added to the custom email integration. Any existing email address in LogicMonitor is considered as verified and will not receive the verification email.
Subject and Email Body
Both the subject and body of the alert notification email support tokens. You can use any of the following tokens in these fields:
- LogicModule-specific alert message tokens, as listed in Tokens Available in LogicModule Alert Messages.
- ##ADMIN##. The user the alert was escalated to.
- ##MESSAGE##. The rendered text of the alert message. This token will also pass all relevant acked information (e.g. the user that acknowledged the alert, ack comments, etc.).
- ##ALERTTYPE##. The type of alert (i.e. alert, eventAlert, batchJobAlert, hostClusterAlert, websiteAlert, agentDownAlert, agentFailoverAlert, agentFailBackAlert, alertThrottledAlert).
- ##EXTERNALTICKETID##. The ticket ID generated by the external ticketing system.
Test Alert Delivery
This button sends a test alert and provides the response, allowing you to test whether the integration is configured correctly.
Note: Make sure to get the email address verified. If an email address is not verified, the Test alert delivery will not be sent to that email address.


