Overview
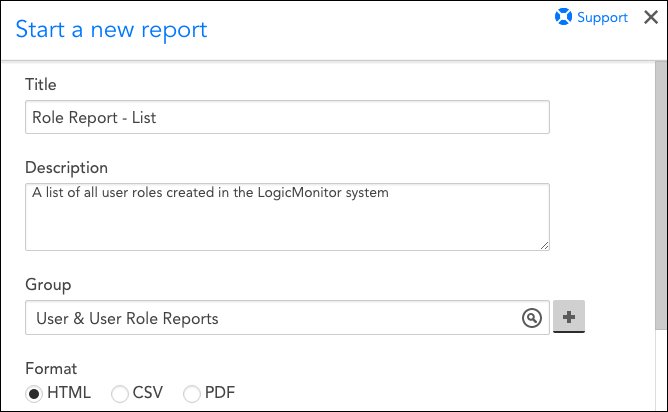
A Role Report lists details for all user roles that have been created in the LogicMonitor system. It’s an efficient way to overview the settings, privileges, and users assigned to your various user roles.
Configuring a Role Report
To configure a role report, select Reports | Add | Report | Role Report. A report dialog appears that allows you to configure various report settings.
Configurations Common to All Report Types
The first four settings, along with the final setting, that are found in the report dialog (Title, Description, Group, Format, and Generate this report on a schedule) are universal to all report types. To learn more about these global report settings, see Creating and Managing Reports.
Role Report Settings
In the Role Report Settings area of the report configuration dialog, select either the list or detail version of the report:
- List. The list version of this report displays basic overview information for all user roles including:
- Name
- Description
- Whether the role requires members to employ two-factor authentication or sign LogicMonitor’s end user license agreement (EULA)
- All users assigned to the role
- The label and URL, if applicable, for any custom help files members have access to from the navigation bar
- Detail. In addition to displaying all basic overview information for all user roles, the detail version of this report displays, at a granular level, the permissions granted across every area of LogicMonitor’s functionality.
Overview
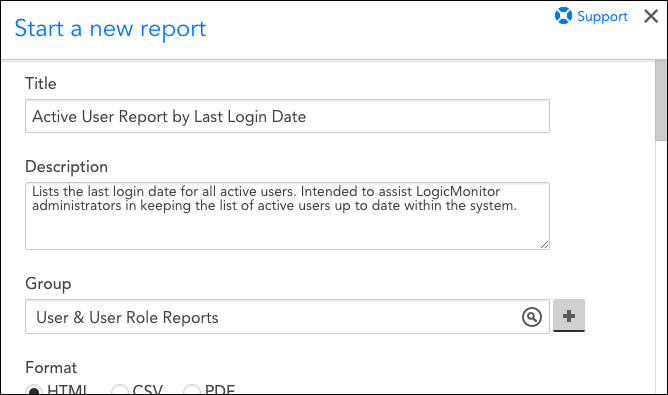
A User Report lists detailed data for LogicMonitor user accounts. It can be used to provide a global table of user account data or, through filter, sorting, and column customizations, it can narrow in on more specific user status and activity. For example, you could create a user report that highlights users’ most recent login dates in order to periodically identify (and potentially delete or suspend) those users that are no longer active in the system.
Configuring a User Report
To configure a User report, select Reports | Add | Report | User Report. A report dialog appears that allows you to configure various report settings.
Configurations Common to All Report Types
The first four settings, along with the final setting, that are found in the report dialog (Title, Description, Group, Format, and Generate this report on a schedule) are universal to all report types. To learn more about these global report settings, see Creating and Managing Reports.
User Report Settings
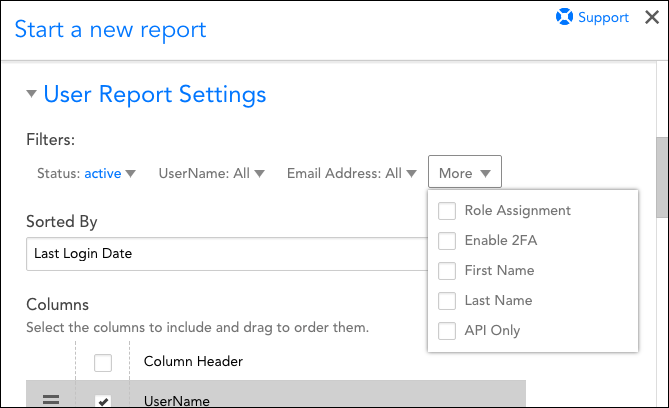
In the User Report Settings area of the report configuration dialog, establish the report’s filters, sorting, and column display.
Filters
There are several filters you can use to narrow the report’s output. As shown next, click the drop-down arrow next to the More field in order to view and select filters beyond the first three displayed.
Note: The UserName, Email Address, Role Assignment, First Name, and Last Name filters all support glob expressions for wildcarding and other advanced search expressions.
To learn more about the user account settings these filters correspond to, see Users.
Sorted By
Select the user property that should be used to sort displayed users.
Note: The values available here are determined by the columns selected for the Columns setting (i.e. you can’t sort by a data value that isn’t included as a column in the report’s output).
Columns
By default, all available user account data is included as a column in the report’s output. Uncheck any data values that are immaterial for your purposes.
To reorder columns, grab the icon to the far left of a column name and drag and drop the column into its new position.
Overview
The Dashboard report allows you to send a dashboard snapshot (either on a one-time basis or on a recurring basis using a schedule of your choosing) to stakeholders. This is particularly useful for distributing moment-in-time metrics of an environment’s health to those who don’t have access to the dashboard within the LogicMonitor platform.
Dashboard reports are distributed as web page URLs. You can enable the Allow Shared Reports access for sharing public and private URLs for generated reports. The generated report URL links are valid for 12 hours. For more information, see Accessing and Sharing Generated Reports.
Note: You can also configure dashboard snapshot sharing directly from an open dashboard, as discussed in Sharing and Exporting/Importing Dashboards.
Creating a Dashboard Report
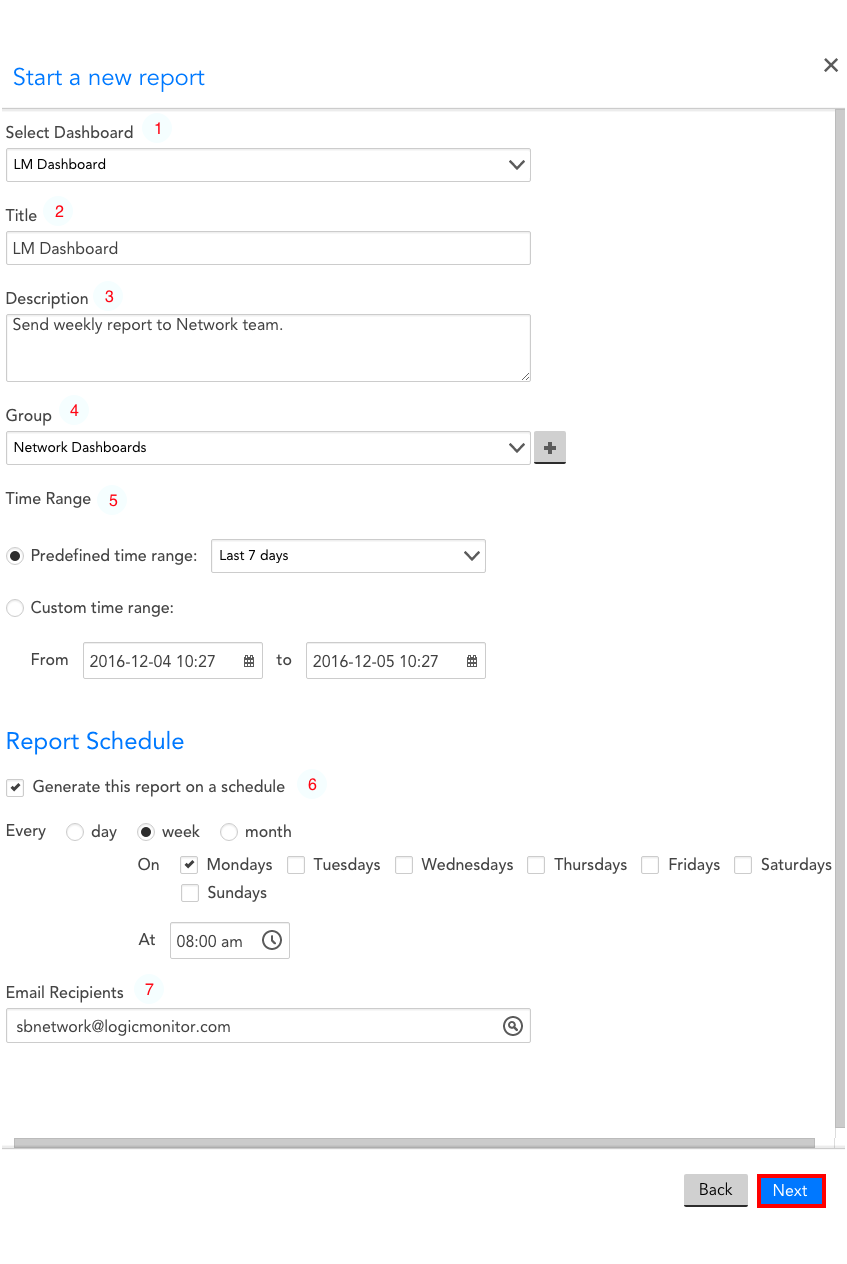
To create a new Dashboard report, navigate to Reports | Add | Report | Dashboard Report. From the Start a new report dialog, configure the following settings:
- Select Dashboard: from a dropdown menu, choose the Dashboard you would like to share as a report.
- Title: the title of the report as it will appear to recipients. This field will default to the name of the Dashboard you have selected. You may change the title, if necessary.
- Description: a brief description of your Dashboard Report. As a best practice, the description should include an overview of the report’s scope, contents, and schedule.
- Group: Select the report group to which the Dashboard Report will be assigned. It is helpful to organize reports based on related environment (ie. a particular office/datacenter location, related recipients, etc.). If you would like to create a new Report Group, select the “add” icon to the right of the “Group” field.
- Time Range: the time range from which this report will pull data from your Dashboard. Each widget in the Dashboard will be configured to reflect the time-range designated in this field.
- Report Schedule: If you select the “Generate this report on a schedule” checkbox, you will be asked to designate the recurring time/date on which this report will be generated and sent to recipients. If you would like to manually generate this report, leave this box unchecked.
- Email Recipients: This field will only appear if you have selected the “Generate this report on a schedule” checkbox. All emails associated with users in the LM account will appear as auto-suggestions. You can also add external emails manually. Note that if you are not generating this report on a recurring schedule, you will simply have to run the report and send it to users via the report’s URL.
Once you have configured each of these fields, click Next. You will be asked to run the report; after doing so, it will be auto-saved.
Receiving a Dashboard Report
Once generated, any designated recipients will receive an email resembling the one in the following graphic.
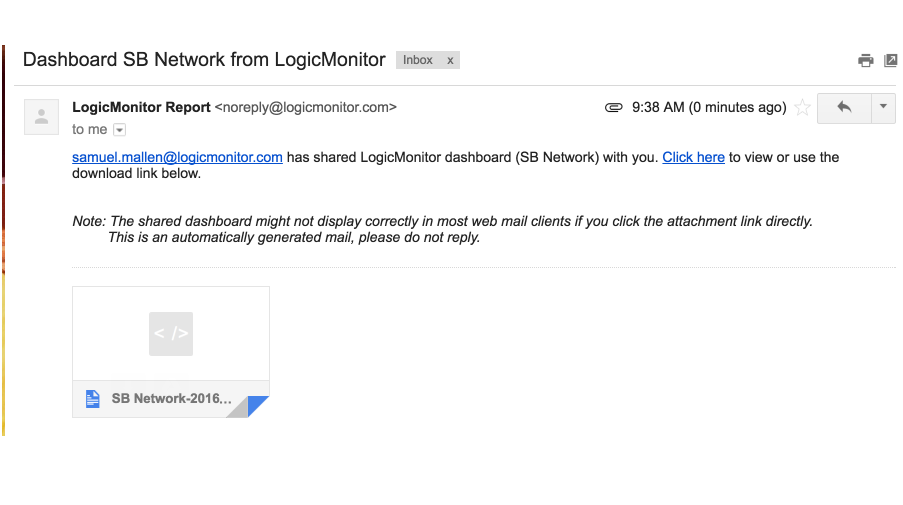
Note: Clicking the attachment directly will result in a distorted view in most web mail clients. For an accurate view, be sure to click the “Click here” embedded link or download the attachment.
Note: Dashboard report URLs expire after seven days. This is a limitation of the AWS authentication technology that LogicMonitor uses to generate these URLs.
Overview
The Alert Forecast report forecasts which datapoints are likely to go into alert within the next 30 days, using the static thresholds that are set for datapoints. It uses predictive analytics to review datapoints’ past trends and plot their future trajectories. To learn more about LogicMonitor’s data forecasting features, see Data Forecasting.
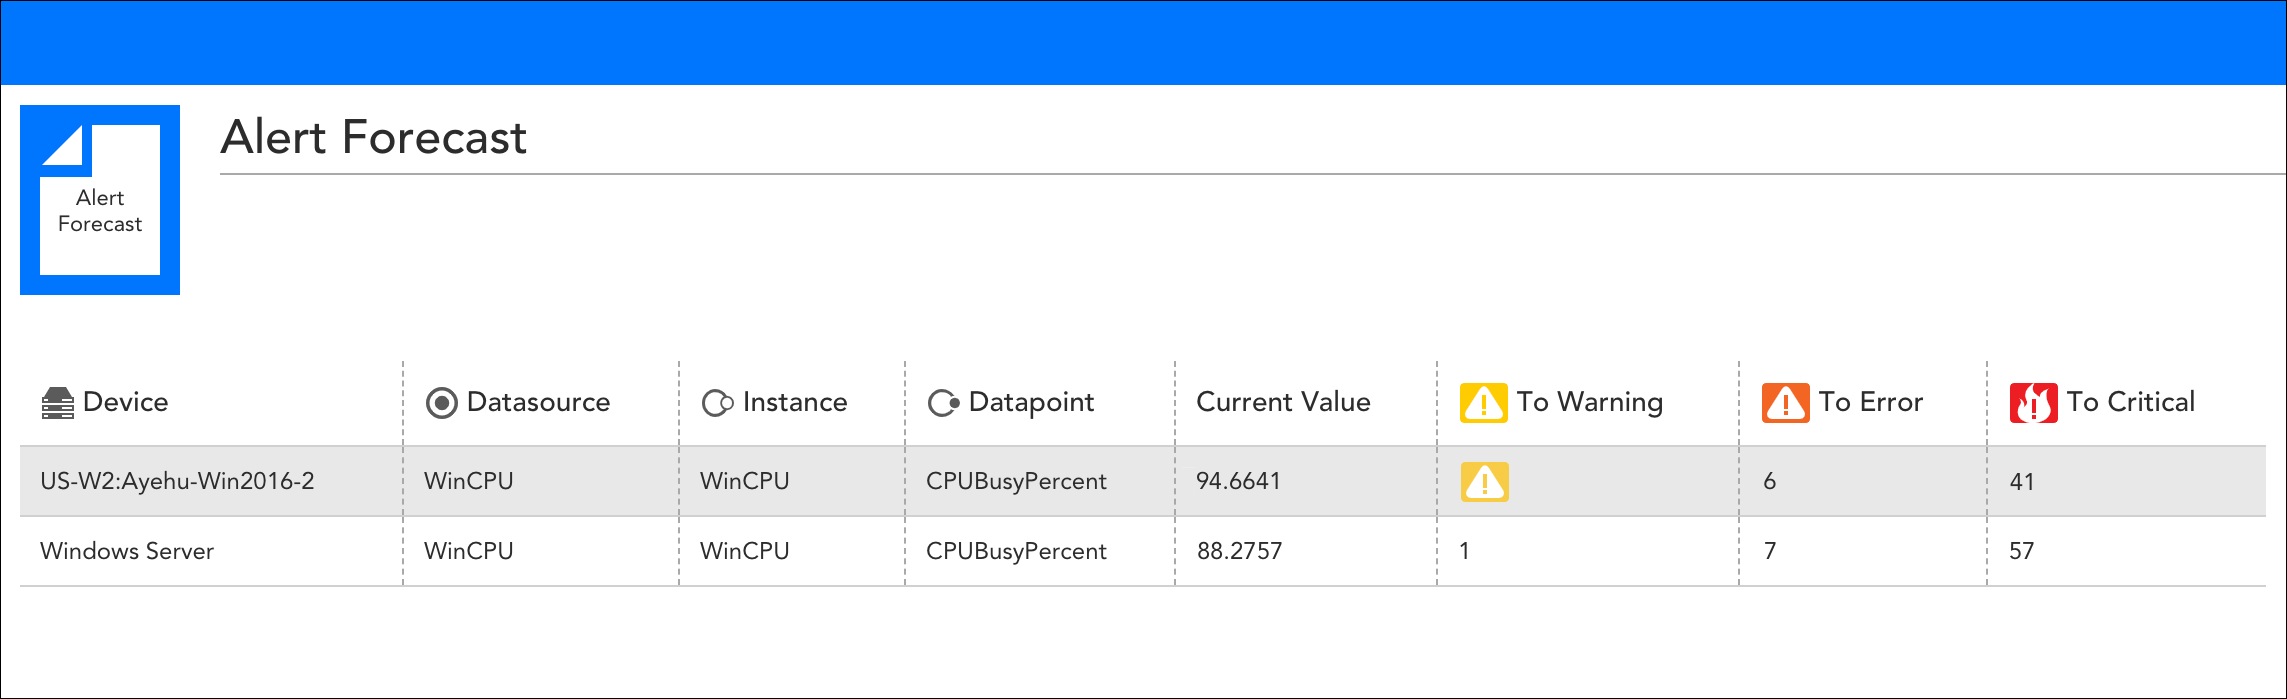
The Alert Forecast report features columns that indicate the number of days until a datapoint is projected to reach warning, error, and critical alert conditions. If a datapoint is currently in alert, as is the case with the first datapoint listed here, the alert severity level icon displays instead.
Configuring an Alert Forecast Report
To configure an Alert Forecast report, select Reports | Add | Report | Alert Forecast Report. A report dialog appears that allows you to configure various report settings.
Configuring Settings Common to All Report Types
The first four settings, along with the final setting, that are found in the report dialog (Title, Description, Group, Format, and Generate this report on a schedule) are universal to all report types. To learn more about these global report settings, see Creating and Managing Reports.
Configuring Alert Forecast Report Settings
In the Alert Forecast Report Settings area of the report configuration dialog, shown and discussed next, specify settings particular to the Alert Forecast report including which datapoints you would like to forecast and the forecast method you would like applied.
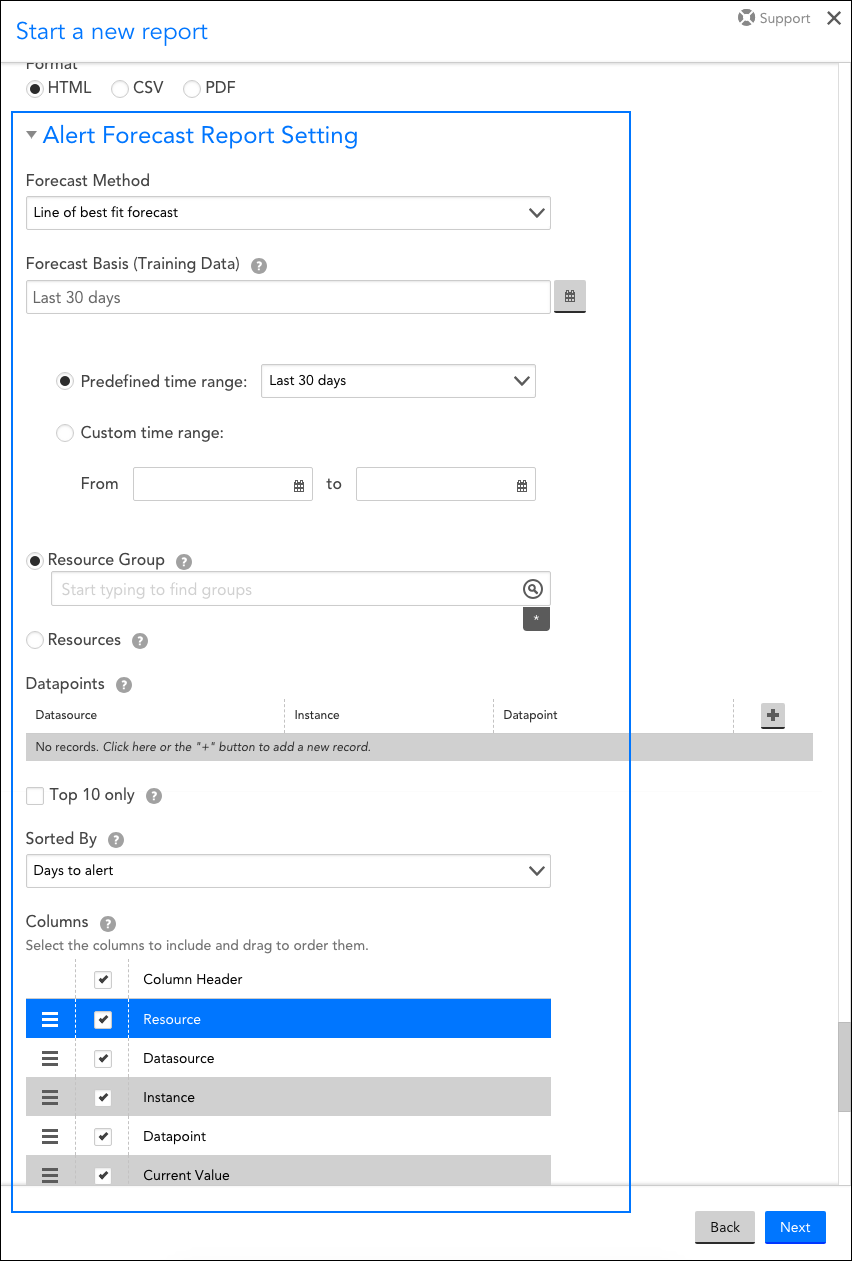
Forecast Method
From the Forecast Method field’s dropdown menu, select from one of two forecast methods:
- Line of best fit forecast
- 95% confidence forecast
For more information on these forecasting methods, see Data Forecasting.
Forecast Basis (Training Data)
In this field, indicate the duration of time from which data will be pulled and analyzed to predict future alerts.
Resource Groups / Resources
From the Resource Groups or Resources field, limit the resources to which this report will apply by designating one or more resource groups or resources. You can use explicit names or glob expressions in these fields.
Note: Multi-glob lookup is available in this field. You can select a combination of both glob and distinct values to specify your resources/resource groups. For more information on LogicMonitor’s support of glob, see Using Glob throughout your account.
Datapoints
From the Datapoints area of the dialog, enter one or more DataSource/instance/datapoint sets to indicate which datapoints you would like included in the report. These datapoints will be pulled only from the resource(s) you specified in the previous field.
Top 10 only
Select the Top 10 only checkbox to limit the report’s results to the top ten datapoints that are closest to alerting.
Sorted By
From the sorted by field’s dropdown menu, select the criteria that should determine the sort order of the report results.
Columns
Uncheck any columns that you would like to exclude from the report. To reorder columns, grab the icon to the far left of a column name and drag and drop the column into its new position.
Overview
The Audit Log report provides a filtered view of audit log entries which are found on the Audit Log page at Settings > Audit Logs. Available report filters include time range, user associated with the activity, and keyword criteria.
Note: The duration of time for which audit log entries remain available is determined by the “alert history storage” level associated with your LogicMonitor package. To save these records or a filtered subset for historical purposes, you can schedule recurring Audit Log reports. See About Audit Logs.
Configuring an Audit Log Report
To configure an Audit Log report, select Reports | Add | Report | Audit Log Report. A report dialog appears that allows you to configure various report settings.
Configuring Settings Common to All Report Types
The first four settings that are found in the report dialog (Title, Description, Group, and Format), along with the final setting (Generate this report on a schedule), are universal to all report types. To learn more about these global report settings, see Creating and Managing Reports.
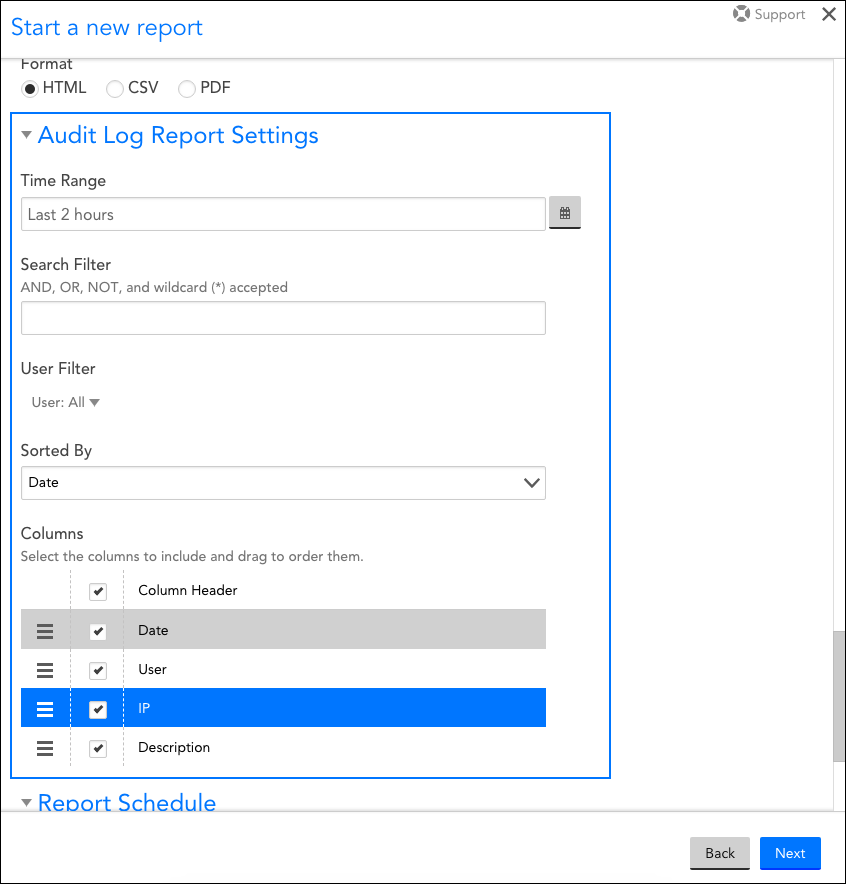
Configuring Audit Log Report Settings
In the Audit Log Report Settings, specify the details to include in the Audit Log report..
| Field name | Description |
| Time Range | In this field, indicate the duration of time for which data will be pulled for this report. |
| Search Filter | Filter the scope of your Audit Log report by entering filter criteria into the Search Filter field. Boolean logic (such as wildcards and operators) is permissible in this field. The search functionality available here is identical to that found on the Audit Logs page. See About Audit Logs for more details. |
| User Filter | Use the User Filter field to limit report output to one or more users. |
| Sorted By | Use the Sorted By field’s dropdown menu to sort based on user or activity date. |
| Columns | Uncheck any columns that you would like to exclude from the report. To reorder columns, grab the icon to the far left of a column name and drag and drop the column into its new position. |
To help you determine which report best suits your objective, we’ve divided them into several broad categories.
Reports that Display Alert Data
Reviewing some alerts via report can ultimately reduce the number of alerts that you and your team members are being notified for (via text, email or voice call). You can review various aspects of alert data using the following reports:
- Alerts report. The Alerts report allows you to review alerts across the resources (e.g. devices, websites, cloud resources) and/or groups of your choice for a specified time period. You can additionally include an alert count to see how many times each alert occurred during the time period.
- Alert Trends report. The Alert Trends report summarizes the number of alerts (broken out by severity level) that occurred for one or more resources or groups for a specified period of time.
- Alert SLA report. The Alert SLA report shows the amount of time that a set of resources were in warning, error and/or critical alert status over a specified period of time.
- Alert Forecast report. The Alert Forecast report forecasts which datapoints are likely to go into alert within the next 30 days.
- Website Overview report. The Website Overview report displays the percent time available, time not available, and alert information per checkpoint across one or more websites.
Reports that Display Monitored Data
You can review various aspects of monitored data (in both graphical and numerical formats) using the following reports:
- Resource Metric Trends report. The Resource Metric Trends report allows you to see minimum, maximum, average, and percent change values for any datapoint that is available for a resource (i.e. device, cloud resource, website) or resource group.
- Interface Bandwidth report. The Interface Bandwidth report displays maximum and average values for interface inbound and outbound throughputs across multiple resources.
- NetFlow Device Metric report. The NetFlow Device Metric report shows top flows, top source endpoints, top destination endpoints, and top talkers across multiple NetFlow enabled devices.
- Server CPU report. The Server CPU report displays minimum, maximum and average CPU values across multiple devices of different types (and with different CPU DataSources).
- SLA report. The SLA report shows the percentage of time that one or more datapoint values met or didn’t meet specified SLA thresholds.
- Dashboard report.The Dashboard report lets you schedule, run, and deliver any dashboard as a report.
- Website Overview report. The Website Overview report displays the percent time available, time not available, and alert information per checkpoint across one or more websites.
Reports that Display Resource Configuration Data
Quickly review various aspects of resource (i.e. device, cloud resource, website) configurations across your LogicMonitor account with these reports:
- Alerts Thresholds report. The Alerts Thresholds report allows you to see the datapoint thresholds in effect across multiple resources, and shows you where you have disabled alerting.
- Resource Inventory report. The Resource Inventory report provides system property details across one or more resource.
- Resource Group Inventory report. The Resource Group Inventory report displays properties across one or more groups of resources.
Reports that Display User Data
You can review various aspects of user data, including user roles and user activity, using the following reports:
- User report. The User report pulls data on each user in your LogicMonitor account, including their provisioned role as well as user-specific settings such as 2FA enablement, last login and action date, and contact information.
- Role report. The Role report lists details for all user roles that have been created in the LogicMonitor system. It’s an efficient way to overview the settings, privileges, and users assigned to your various user roles.
- Audit Log report. The Audit Log report provides a summary of audit log entries and, similar to the Audit Log page itself, can be filtered and sorted according to various criteria.
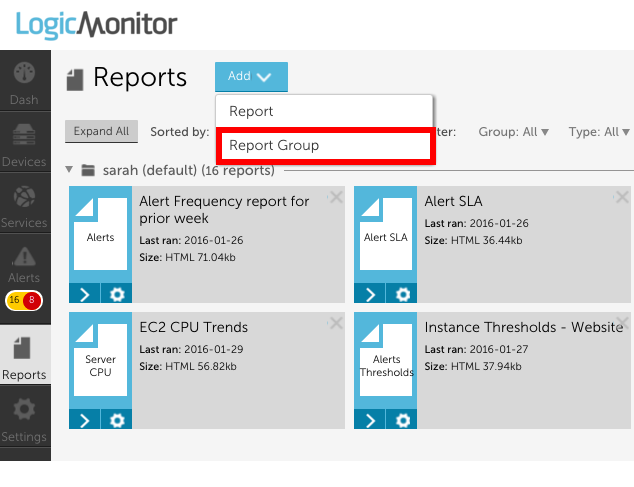
You can organize your reports into report groups to make report navigation faster and easier. To add a new report group, select Report Group from the Add drop down menu on the Reports Page:
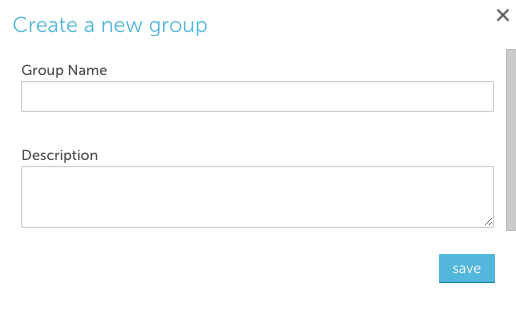
Group Name
The name of the report group. Note that report group names cannot include the operators and comparison functions used by LogicMonitor’s datapoint expression syntax, as discussed in Complex Datapoints.
Description
The description of the report group
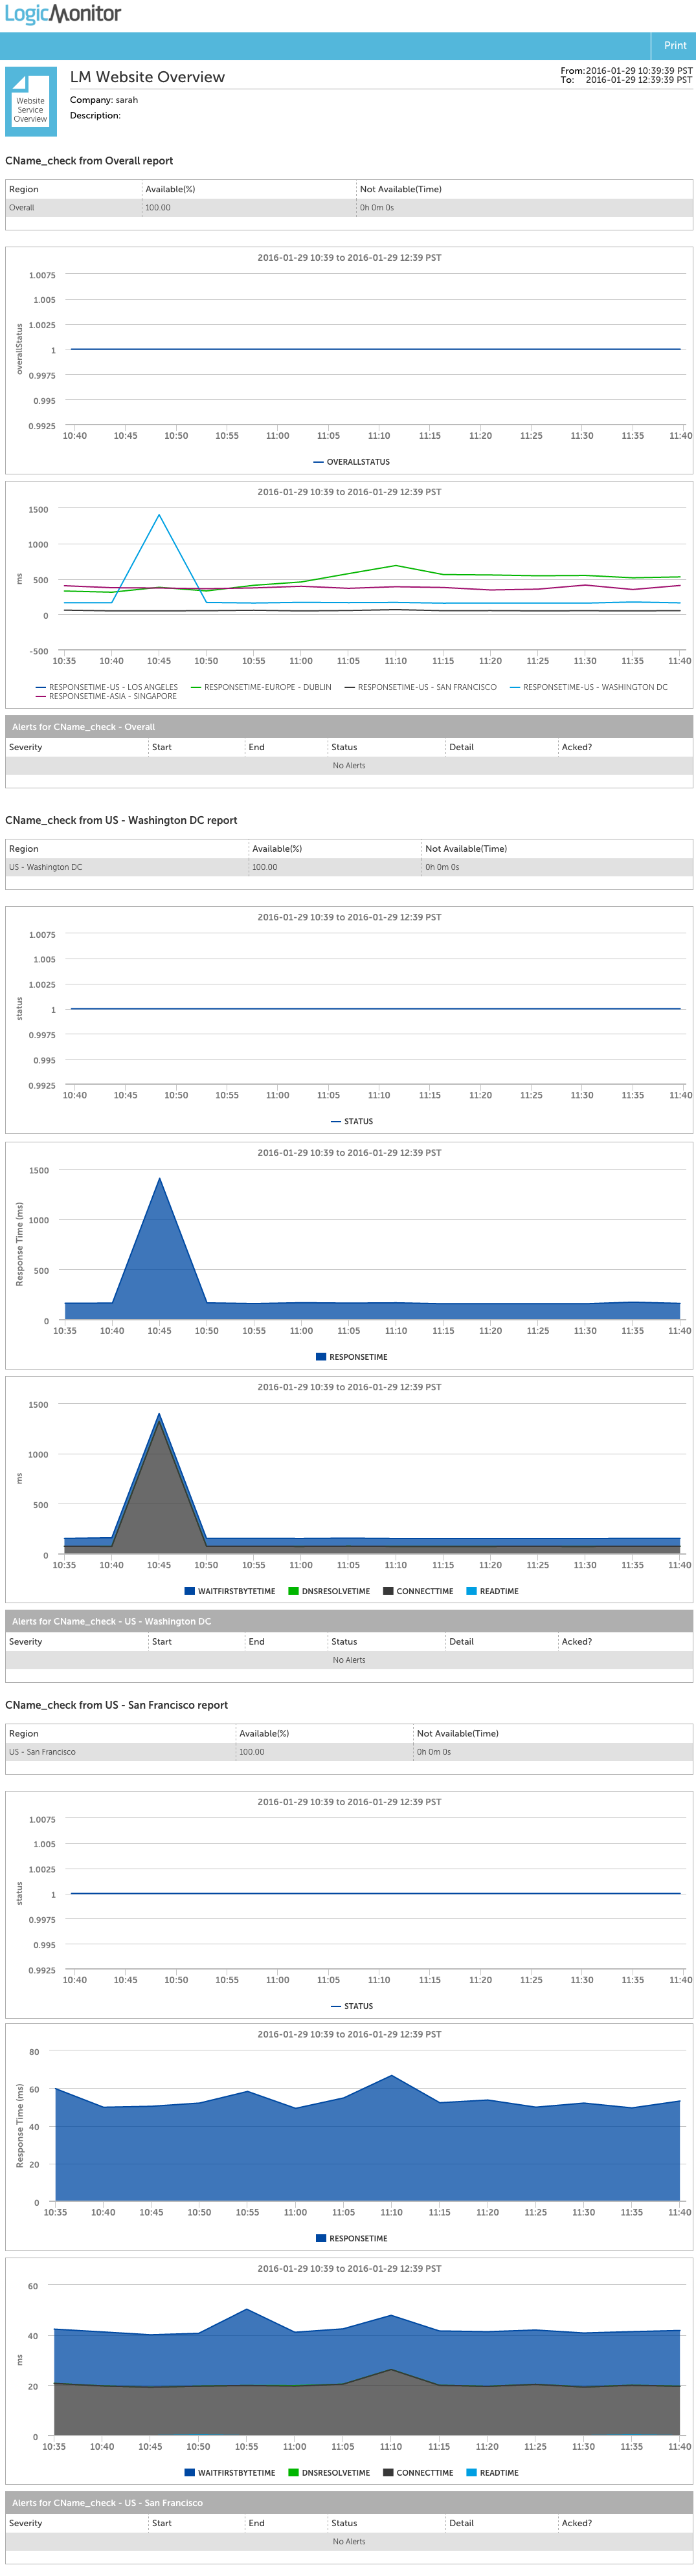
The Website Overview Report can display percent time available, time not available, and alert information per checkpoint for one or more external Web Checks (this report will not reflect Internal Web Checks). This information is displayed in a tabular data format and additionally includes graphs per checkpoint. Because the flexibility of this report allows you to view graphs and numerical data together for multiple websites, you may find this report useful for quickly reviewing availability metrics across a group of websites.
Configuration
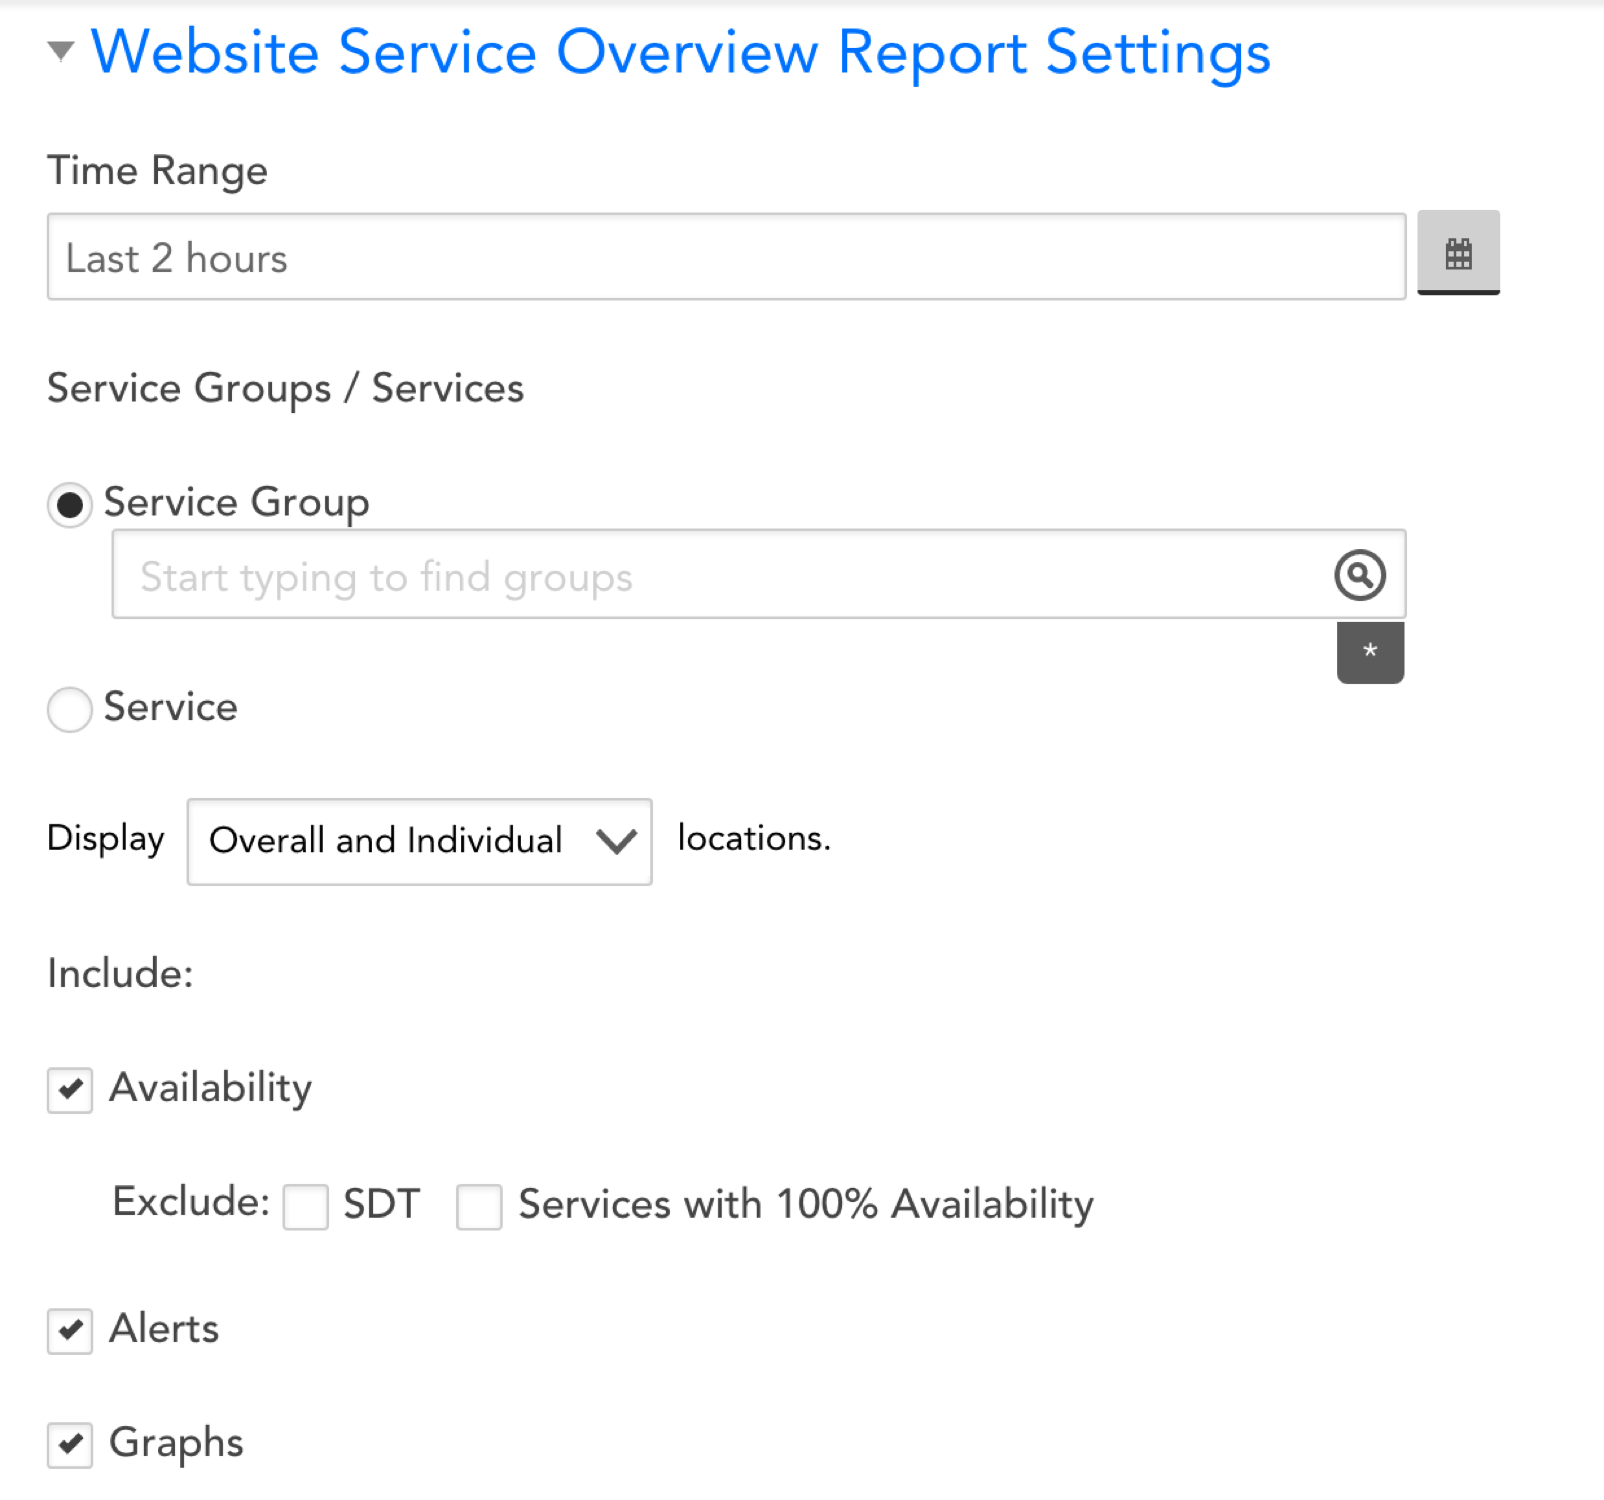
Time Range
Choose the time range for which you’d like to see website data.
Please note that for time ranges of two months or less, you will be able to include a maximum of 10,000 instances in your report. For time ranges of greater than two months, you will be able to include a maximum of 5,000 instances.
Website Groups / Websites
Select one or more websites or groups of websites that you’d like to see data for in the report.
Displayed Locations
Select whether you would like to only see overall data, or see overall data as well as data for each individual checkpoint location.
Include | Availability
You can choose whether to exclude scheduled downtime (SDT) from your Website Overview report. Checking this box will ensure that SDTs do not impact the overall percentage of your website’s availability.
You can also choose to ignore websites with 100% availability. Individuals may find this useful if they do not want data on websites that are functioning without downtime.
Include | Alerts/Graphs
Select whether you’d like to see percent time available, alerts, and/or graphs for the websites or website groups selected.
Checking “Calculate no data as Available” will include missing data as part of your website’s uptime.
The NetFlow Device Metric Report display top flows, top source endpoints, top destination endpoints, and top talkers for NetFlow-enabled devices. It provides an excellent overview of recent network traffic metrics across your NetFlow-enabled devices.
Configuring a NetFlow Device Metric Report
To configure a NetFlow Device Metric report, select Reports | Add | Report | NetFlow Device Metric. A report dialog appears that allows you to configure various report settings.
Configuring Settings Common to All Report Types
The first four settings, along with the final setting, that are found in the report dialog (Title, Description, Group, Format, and Generate this report on a schedule) are universal to all report types. To learn more about these global report settings, see Creating and Managing Reports.
Configuring NetFlow Device Metric Report Settings
In the NetFlow Device Metric Report Settings area of the report configuration dialog, specify settings particular to the NetFlow Device Metric report including time range and resources to be included in the report.
Include DNS Mapping
If you have uploaded a CSV that maps IP addresses to their respective DNS names, checking the Include DNS mappings option includes a table of this map in your report’s output. For more information on uploading IP-DNS mapping data, see Viewing, Filtering, and Reporting on NetFlow Data.
Time Range
Click the calendar icon located to the right of the Time Range field if you would like to set a duration other than the default “Last 2 hours” for the report.
Resource Groups / Resources
From the Resource Groups or Resources field, limit the resources to which this report will apply by designating one or more resource groups or resources. If you designate resource groups, the report output will include all NetFlow-enabled devices within the specified group(s). You can use explicit names or glob expressions in these fields.
Note: Multi-glob lookup is available in this field. You can select a combination of both glob and distinct values to specify your resources/resource groups. For more information on LogicMonitor’s support of glob, see Using Glob throughout your account.
Threshold Limits
Adhoc Requests Thresholds (Limit for number of Graphs)
| CSV | HTML | |
| 20 | 20 |
Scheduled Requests Thresholds
| CSV | HTML | |
| 600 | 600 |
Overview
The Server CPU report displays minimum, maximum, and average CPU values for one or more groups of devices, even if the CPU DataSources monitored for each of those devices are different (e.g. the Microsoft_Windows_CPU DataSource is used to monitor CPU for Windows servers and the NetSNMPCPUwithCores DataSource is used to monitor CPU for Linux servers). These values are presented in a tabular data format and additionally can include graphs per device. Because the flexibility of this report allows you to view graphs and numerical data together across multiple device types, you may find this report useful for quickly reviewing recent CPU performance across a group of devices.
Configuring a Server CPU Report
To configure a Server CPU report, select Reports | Add | Report | Server CPU Report. A report dialog appears that allows you to configure various report settings.
Configuring Settings Common to All Report Types
The first four settings that are found in the report dialog (Title, Description, Group, and Format), along with the final setting (Generate this report on a schedule), are universal to all report types. To learn more about these global report settings, see Creating and Managing Reports.
Configuring Server CPU Report Settings
In the Server CPU Report Settings area of the report configuration dialog, shown and discussed next, specify settings unique to the Server CPU report including time range and device group(s).
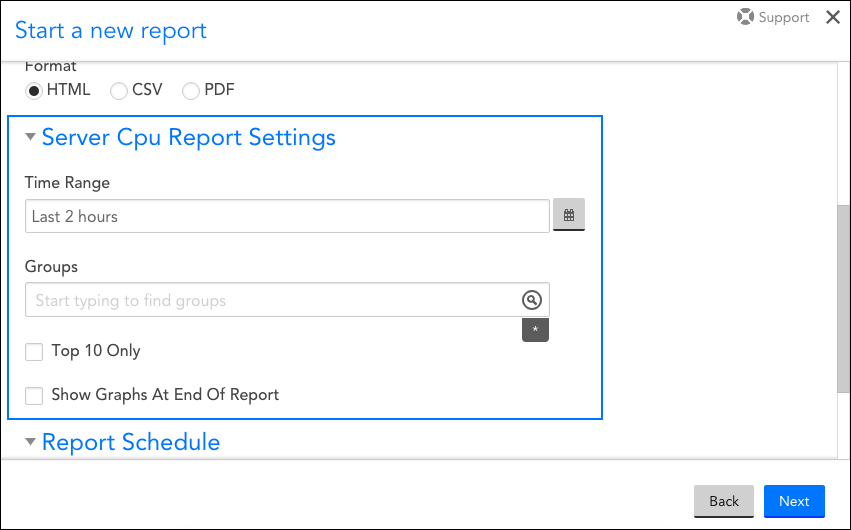
Time Range
In this field, indicate the duration of time for which you’d like to review CPU statistics.
Groups
From the Groups field, limit the devices to which this report will apply by designating one or more device groups. You can use explicit names or glob expressions in these fields.
Note: Multi-glob lookup is available here. You can select a combination of both glob and distinct values to specify your groups. For more information on LogicMonitor’s support of glob, see Using Glob throughout your account.
Top 10 Only
Select the Top 10 Only checkbox to limit the results that are displayed in the report to the top ten results.
Note: Graphs will only be displayed if this checkbox is selected.
Show Graphs At End Of Report
Select the Show Graphs At End Of Report checkbox to display all relevant graphs of CPU values at the bottom of your report (i.e. below the table of CPU values).
