Why Customizable Dashboards

Bring clarity to complexity

LogicMonitor’s dashboards help you translate raw monitoring data into real-time, role-specific insights—so your teams can stay ahead of issues, track KPIs, and make smarter decisions.

Fully customizable layouts

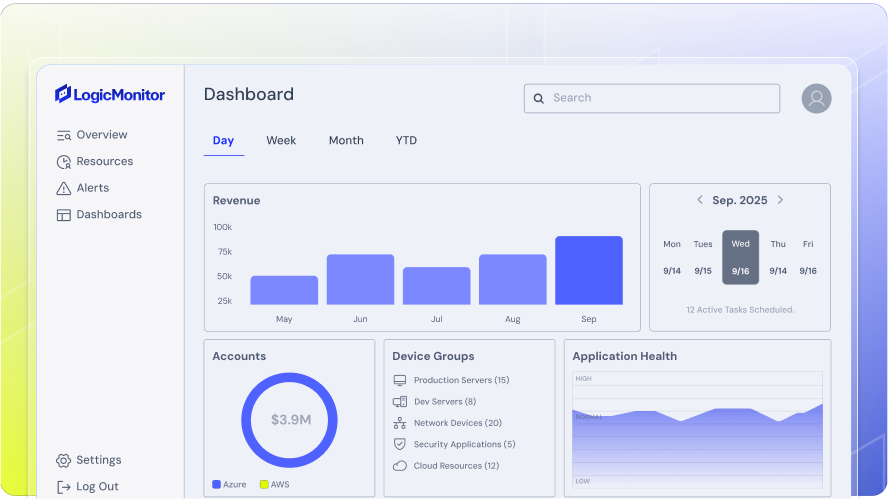
Build dashboards that fit your team’s workflows—choose from dozens of widget types, chart formats, and display options.

Learn how it works
Prebuilt dashboards included

Get started instantly with curated dashboards for popular technologies, from AWS and Kubernetes to Cisco and Windows.

See examples

What you can do with Customizable Dashboards

Dashboards that work the way your team does

Whether you’re in the NOC, on a platform team, or presenting to executives, LogicMonitor lets you build dashboards that surface the right data, in the right format, for the right audience.

Design your layout
Choose your widgets
Connect your data
Share and collaborate
Use prebuilt templates

Build dashboards with drag-and-drop ease

Rearrange, resize, and organize widgets to match your team’s needs. Easily adapt layouts to highlight the most important information.

  • Flexible grid system Position and scale widgets freely across a modular canvas.
  • Mobile-responsive Dashboards automatically adapt to fit any screen size.

Visualize any metric, any way

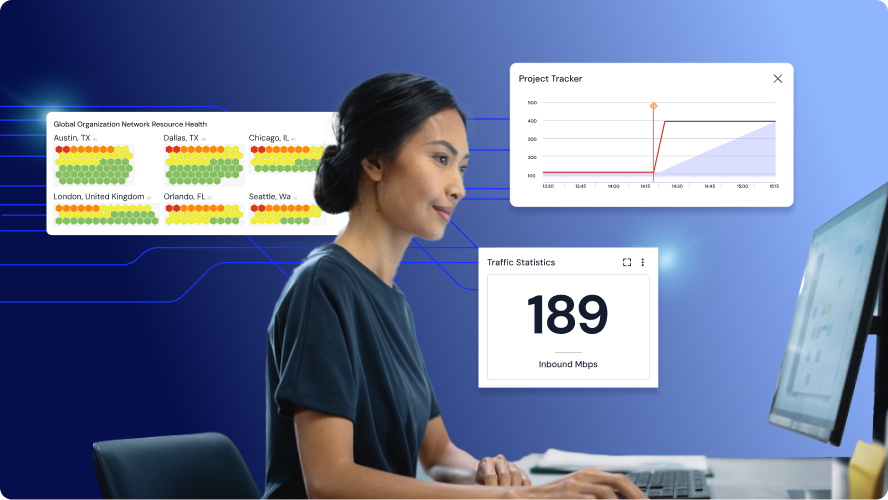
Choose from line charts, pie charts, gauges, tables, NOC views, map overlays, and more to tell the right story with your data.

  • Dozens of widget types Combine visualizations for infrastructure, apps, logs, and more.
  • Alert overlays and color coding See critical status changes instantly, without leaving the dashboard.

Pull from any monitored resource

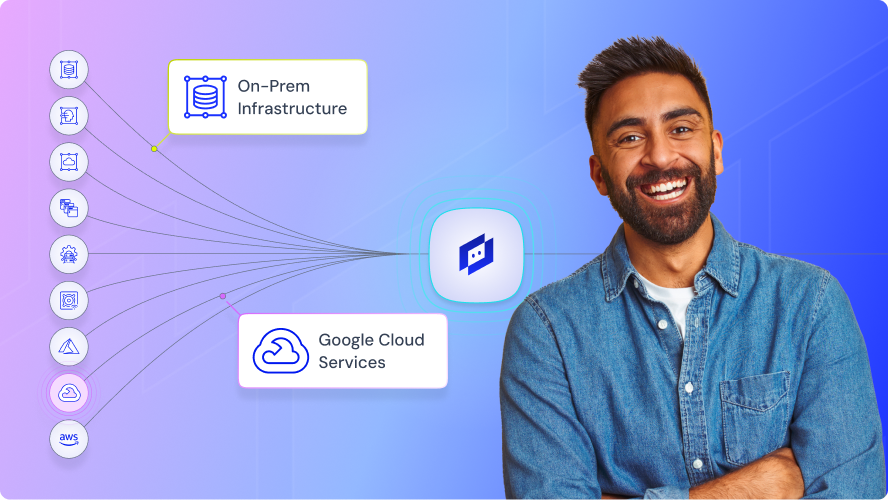
Populate dashboards with real-time data from devices, cloud platforms, containers, websites, logs, and third-party tools.

  • Unified data model Visualize everything LogicMonitor observes—no additional integrations required.
  • Real-time updates Dashboards refresh automatically so you always see current data.

Keep teams aligned with shared visibility

Make dashboards public, private, or group-based. Pin dashboards to views for NOCs, execs, or app teams.

  • Role-based access Control who can view, edit, or manage each dashboard.
  • Easy duplication Clone existing dashboards to customize for different teams or use cases.

Start fast with curated dashboards

Access hundreds of ready-made dashboards for common technologies, available directly from the LogicMonitor Exchange.

  • Organized by category Find templates for cloud, network, databases, apps, and more.
  • Fully editable Customize any template to match your environment and goals.