

Depending on how you use them and who sees them, Dashboards could be the most vital aspect of a monitoring application. To understand their importance, consider the following situations:
- On his or her periodic goodwill tour of your building, the CEO of your company strolls through the dark regions of your Ops dungeon where they espy the NOC dashboard that you so lovingly show on a large wall-mounted monitor, and he or she wants to know if they can see it on their computer.
- In order to head off unnecessary calls from your support folks, you gave them access to dashboards showing the current status of your network traffic, the status of your primary website pages, and an overview of the current call load.
- Sales, finance, and marketing managers want insight into real-time database statistics like sales volume, new customers this month, and renewals.
- You have to stare at dashboards all day and would generally prefer them to not suck.
Any of these situations (all of which we’ve heard from LM users) could make a serious impact on your livelihood, workload, and general happiness. And success for any of them relies on having dashboards that are well-designed and easy to understand
The good news is you (yes, you!) can create delightful dashboards by following a few simple guidelines. Just think of yourself as a storyteller. The dashboard is the story you’re trying to tell, and the viewers (yourself included) are the ones who have to read, understand, and hopefully enjoy it.
Full disclosure… this post is longer than most blogs but it contains very useful information!
Tell a Story that You Know
Remember writing essays in high school? The first step was to create an outline for your main idea and supporting arguments. If you skipped that step and just started writing it, in the end someone reading it didn’t really know what they had just read.
You need to be clear on what the dashboard is about. What message are you trying to convey? Some examples: the datacenter is operating perfectly (or not), the website is firing on all cylinders (or not), world peace is being accomplished (note: this would require a custom datasource).
Once you know what the purpose of your dashboard is, you can contemplate its “supporting arguments”. That is, what data would best help tell the story? And just as importantly, how much can you not show? That last point is vital. Dashboards should be more The Old Man and the Sea and less War and Peace. This is not the place to include every piece of data just to show how clever you are (everyone already knows that). This is the place to show that you’ve mastered your craft by showing just enough data to tell the story without losing the viewer in too many details. Many well-intentioned dashboards have been rendered useless because there was too much information to focus on.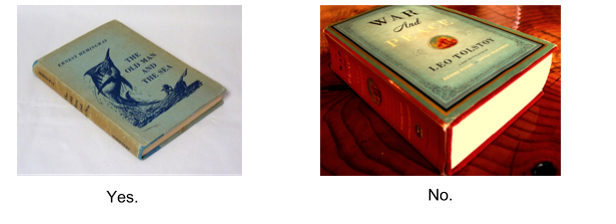
Consider your Audience
If you like poetry, nature, and love (because, you know, this is a tech blog), but haven’t read Wendell Berry, you should. His Country of Marriage is a masterpiece in whatever format you read it in, but Amazon recently sent me an email to let me know that my current Kindle version has just been replaced by one that’s formatted specifically for digital consumption. Amazon knows that the format in which you read their books (paper or digital) makes a difference and require some consideration. The same thing applies to dashboards: the way they’re viewed makes a difference. Viewing methods primarily fall into two categories: on the wall and off it.
On-the-wall Dashboard Displays
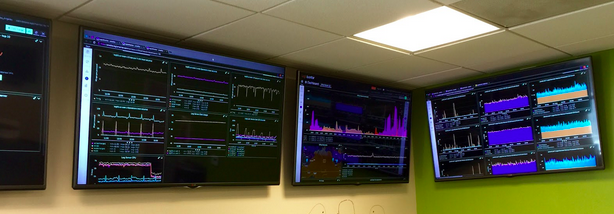
In our TechOps space (lucky for me, this is also where Product/Design team resides), we have a wall of monitors that are constantly rotating through various dashboards. Yes, it’s a little bit Fahrenheit 451, but I’ve come to embrace it. And if there’s a wireless keyboard and mouse connected to these displays, I’ve never seen it. That’s because they’re meant to be viewed and not interacted with.
Dashboards built for wall displays will need to be shorter (i.e. you shouldn’t have to scroll down) and more general. Viewers shouldn’t be expected to pick out individual points with any exactitude. Instead, an on-the-wall dashboard shows trends and relationships. An outlier, a spike, or a flatline should be visually obvious because it means someone needs to get on their desktop and investigate the problem.
Off-the-wall Dashboard Displays
Sadly, the pun I so badly want to make here doesn’t work because dashboards built to be seen on a desktop or laptop monitor are pretty common. These offer a little more flexibility because users can typically interact with them and see details more easily. Additionally, the dashboards can be a bit longer because the pages can be scrolled.
That being said, resist – resist! – the temptation to add things because you can. Brevity is the essence of wit – and well-designed dashboards.
Use the Right Tool for the Job
The best stories use the right literary devices to reveal the plot. Using foreshadowing, allegory, and metaphor (e.g. comparing storytelling with making dashboards) at the right time turns a list of things that happened into an engaging narrative.
Likewise, LogicMonitor offers you a veritable cornucopia of widgets for use in your dashboards. The trick is using the right one at the right time. Our help site has a fantastic guide to all our widgets and which one works for different types of data. It’s aptly titled, “Which widget should I use?” and I recommend that every would-be dashboard virtuoso should read it.
Once you’ve got a handle on the different widget types and their appropriate use, it’s time to revisit that outline you made of what data to show on your dashboard. Now you have some choices to make, depending on what you want to show.
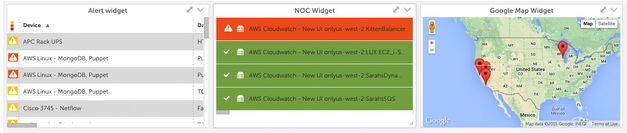
- Status. With status-based dashboard widgets, you’re not worried about displaying the actual value of the item so much as whether it’s working or not. Your primary choices here are the Alert Widget, NOC widget, or Map widget.
- History and Trends. The most obvious choice for this is a line or area graph (Custom Graph Widget), but remember that a Gauge Widget can also show the recent peak along with the current value of something, which is a much simpler display of history. Other choices include Device Instance graphs and the various Service graphs (NOC, Individual, and Overall).
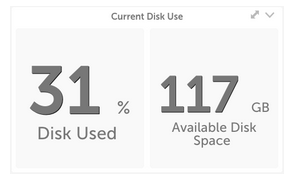
- Current Value. If you want to keep it simple and know about one thing right now, the Big Number Widget and the aforementioned Gauge Widget are your best choices.
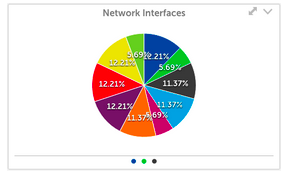
- Comparisons. Sometimes, the best way to know if something is working correctly is when you see it in comparison to something else. This is when a Pie Chart Widget can come in handy because it’s easy to quickly identify if one slice of the pie is significantly larger than all the others. If you need trending or history, Custom Graph Widgets will work as well. And the Big Number Widget can show up to 4 individual values in one widget.
- Custom Stuff. The HTML widget allows you to display more or less whatever you want, so long as the content allows for cross-origin (cross-domain) access. You can use it to display iframe-based widgets from other systems, youtube videos, and a clever dashboard aficionado (like yourself) could use the LogicMonitor API and some basic front-end development skills to make some truly impressive custom widgets.
Stay tuned for a cool example of this in a coming blog post.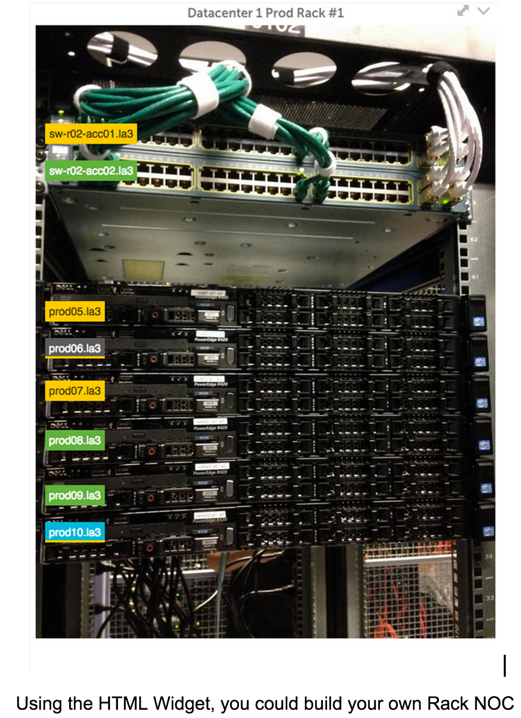
Pick Your Hero
Think of your favorite stories. What makes most of them so enjoyable are the great main characters – the hero or heroine – around which the plot and all supporting characters revolve. Great Dashboards are built the same way.
You need to pick a primary widget: one widget to rule them all. This is the hero of your story, the widget that sets context and meaning for all the others on the page, the one that viewers will want to look at first. But how do you denote a widget as the primary one? By employing a few basic design rules:
- Location, location, location. Most users tend to scan the screen from the top left corner to the bottom right. You can give visual priority to a widget by placing it in the top left corner. But by using some of these other techniques, you could get away with putting it in the top center or even the absolute center of the dashboard.
- Size matters. Making a widget the biggest one on the screen will immediately draw visual attention because it’s the easiest to see (we’re all lazy, whatever we claim to the contrary).
- Colorful metaphors. Some of the widget types are naturally more colorful than others, but you can really emphasize a widget (and de-emphasize others) by judiciously using stronger color schemes. All the widgets allow you display them with purple, blue, gray, or white backgrounds or borders. Choosing a solid color background says, “Look here! This one is important!”
Caution: a little solid color goes a long way, so only use them when it’s important. Too much color? Try giving your primary widget a border and removing the border from all the others. - Simplicity sells. As I stated above, our eyes are lazy. We naturally gravitate to the thing that is easiest to read. So viewers will naturally be attracted to something like a Big Number Widget or a NOC widget, as opposed to a complicated line graph.
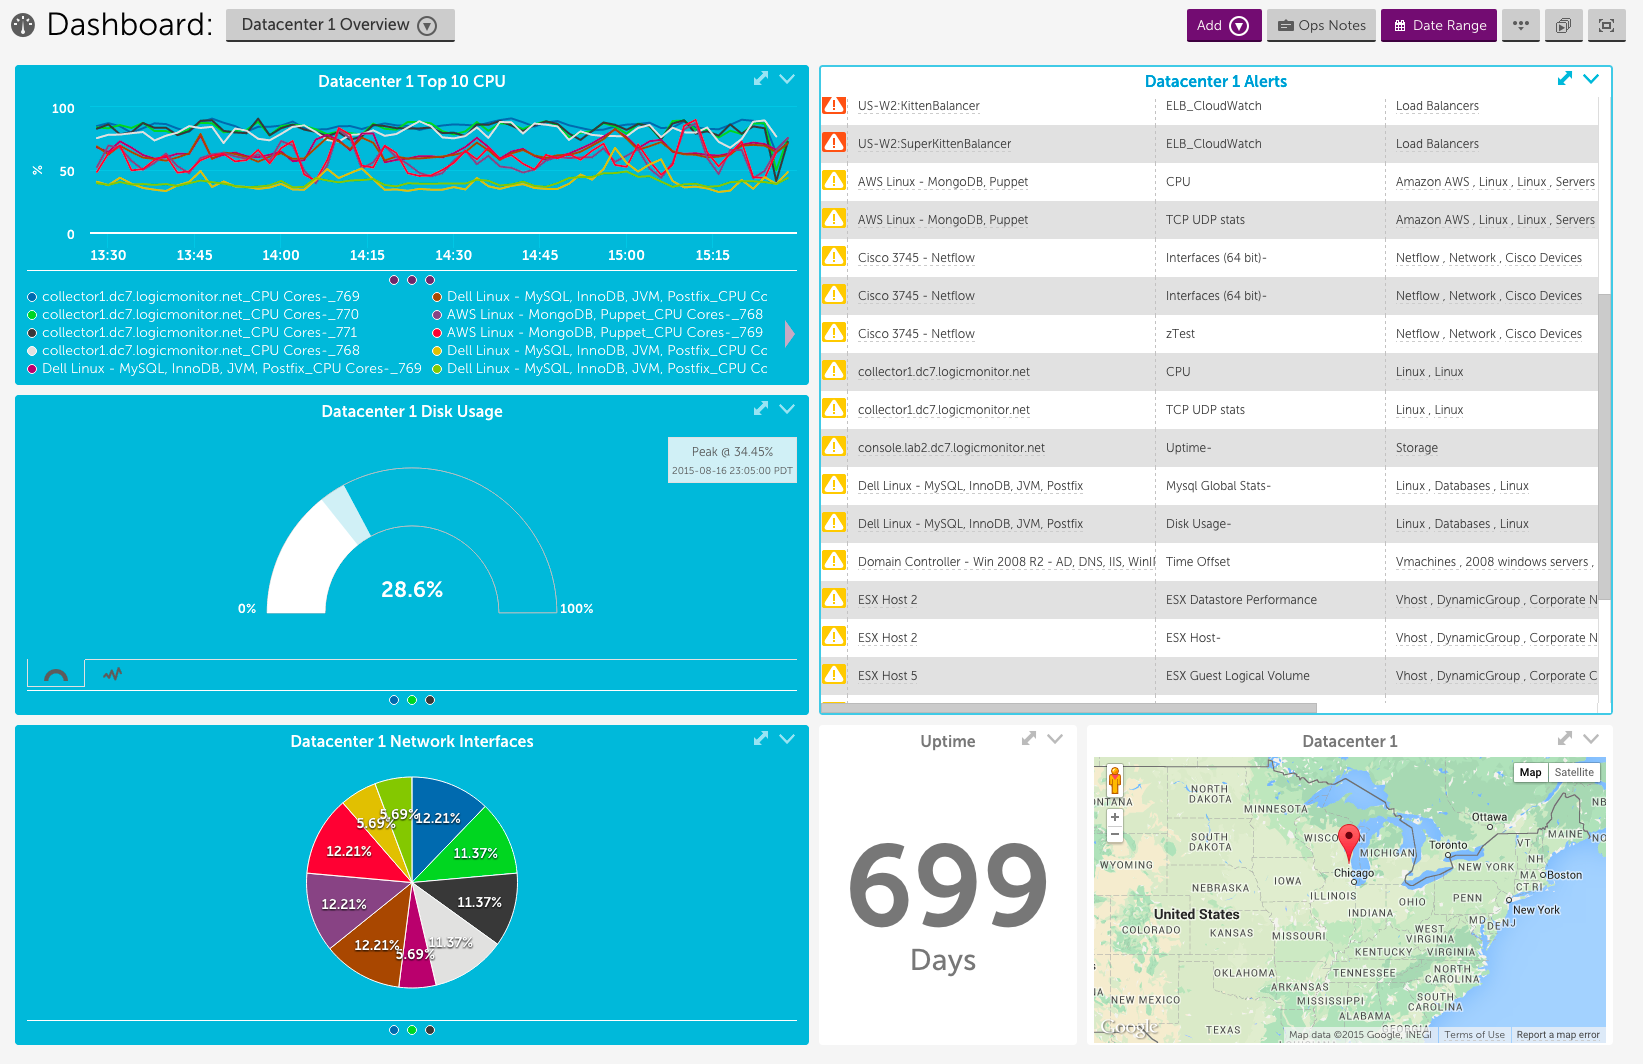
Consider these two dashboards, which have the exact same graphs showing various high-level aspects of a datacenter. What is the hero of each of these dashboards? What story are they telling and who are they built for?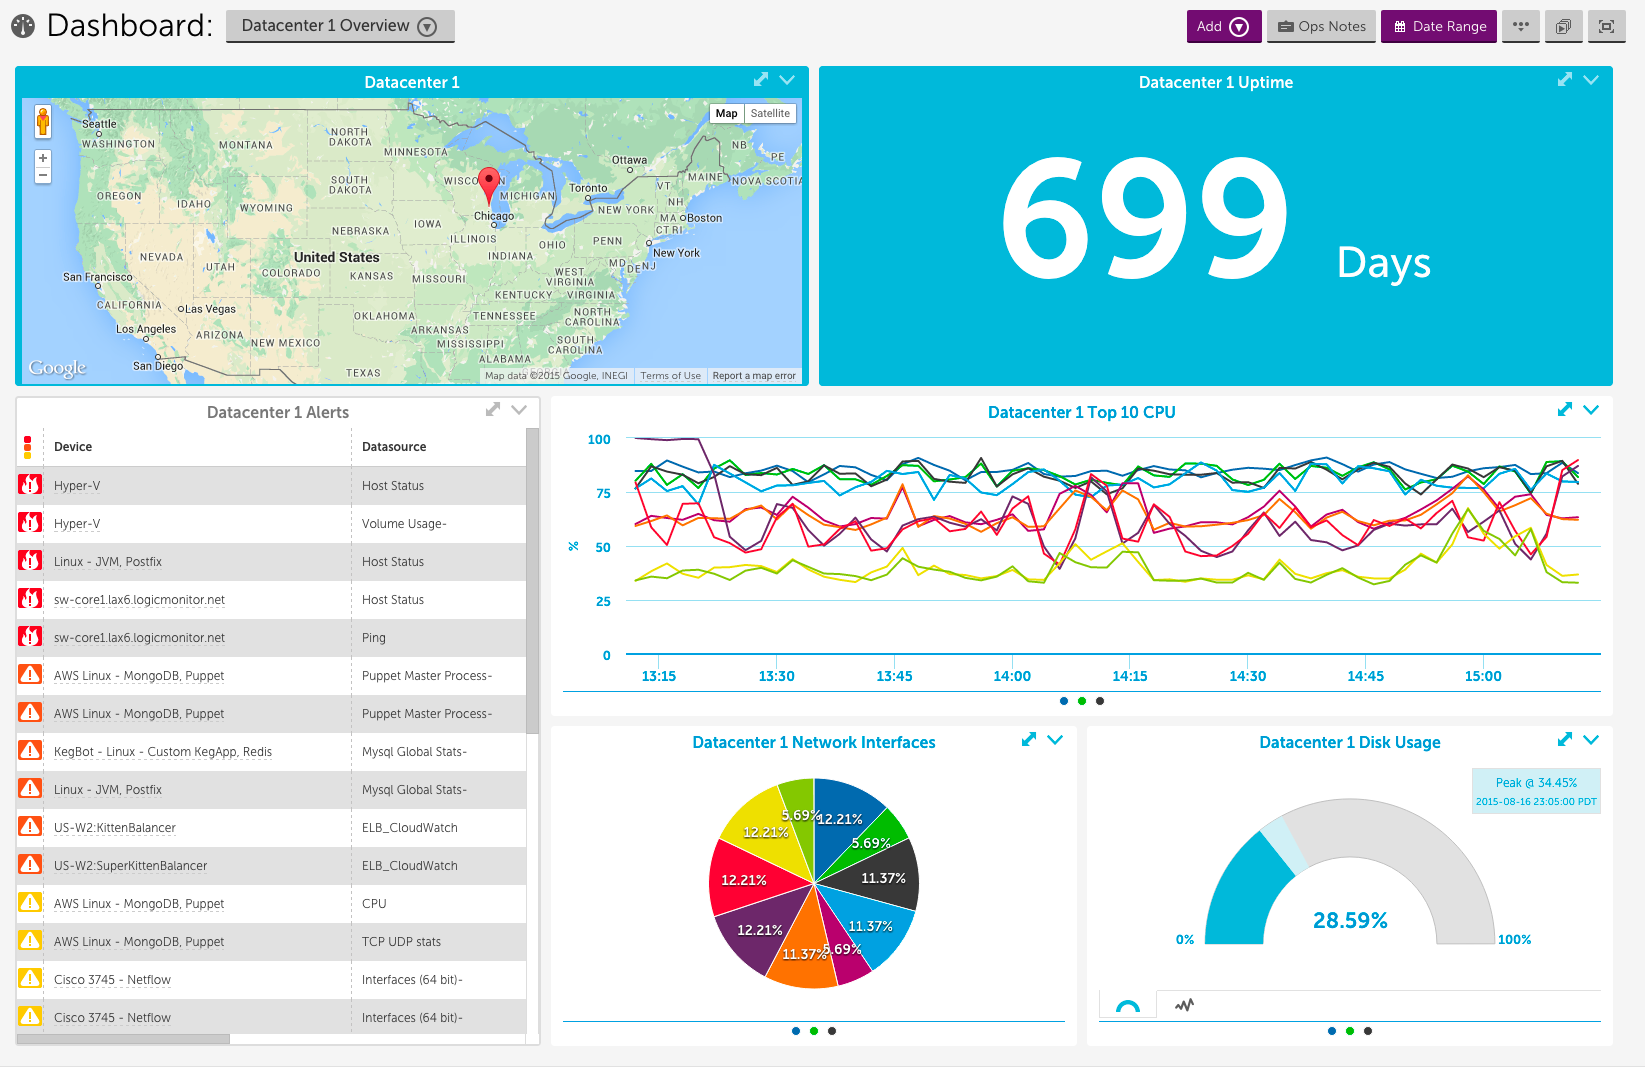
The left dashboard highlights two widgets (Map and Big Number), but while the map is in a higher priority location (top left), the simplicity and high contrast of the Big Number widget would draw viewers’ eyes more easily. So this dashboard says, “Hey look! Datacenter 1 (in Wisconsin) has been up for almost two years! (oh and, by the way, here’s some other interesting data)”.
With the dashboard on the right, viewers’ eyes would tend to start with the CPU (Custom Graph Widget) at the top, but instead of moving diagonally to the bottom right, the strong colors would keep their eyes on the left side of the dashboard. This dashboard is obviously geared towards a more technical audience who is more interested in details and would only look at the map widget as an occasional reminder of the datacenter’s location.
Comedy Relief
Even the darkest dramas need moments of levity. And I wouldn’t be mentioning that if it weren’t also true for creating delightful Dashboards. You, the weaver of the story being told in the dashboard, need to interject a little fun and have some fun yourself. Some ideas:
- Invert the data and re-label. Have you learned about using Virtual Datapoints in your widgets yet? You should. They allow for all sorts of fun, both technical and otherwise (some of the simpler widgets just have the option to “Add Expression”, but it’s the same thing).Start with adding a Big Number widget to your dashboard and map it t
o some datasource related to device uptime. Use a virtual datapoint to subtract that time from the current time and then simply add a label saying “…since the last apocalypse”. Alternatively, subtract a “percent disk space used”-like datapoint from 100 and label it, “Until the phones light up”. Any ideas like these will get more notice than their bland counterparts. - Custom datasources = good times. Okay, the act of creating a custom datasource isn’t exactly party time (it’s on my UX Improvements to-do list), but the things you can do with them could be. One guy in our office created a datasource to check Twitter for when Jimmy Fallon tickets get announced. Another office genius monitors his kegerator. I created a datasource to track my Strava rides (using the Strava API) with the goal of opening it up to the rest of the bicyclists and runners in the office and displaying it on a community dashboard. If you’re displaying LogicMonitor dashboards anyway, why not use them to make your company (even) more fun?
- Display like a development hipster. My favorite British-accented user in Boston (talking about you, Mick!) insists that they’re just silly, but inverted color schemes are all the rage in coding environments and some folks like to carry those into their dashboards. True, LogicMonitor hasn’t actually released a color scheme like that, but you can usually make this happen on the monitor or computer itself.
- Make your own mayhem with HTML Widgets. Host some custom HTML on your own server, point to it with the HTML widget. Hilarity ensues. It only takes a little widget in the corner of your dashboard with “that” picture of a co-worker to remind people both that you’re a dashboard demigod and that it is, after all, just technology.
Put It All Together
Let’s summarize. Clearly know what your dashboard is about and how it’s going to be displayed. Use the right widget to display your data. Give the important stuff on your dashboard visual priority. Have fun and it make it both enjoyable and delightful for your viewers.
So there you have it. Put these pieces together and your dashboards will be works of art. You can put on your beret and storm out of meetings yelling things like “How can I work like this?! I am an artEEST!”
Or you can just sleep better knowing that you’ve made dashboards that are readable, enjoyable and actually being used!


