Autonomous agents introduce decision integrity risk that traditional monitoring cannot detect. Learn how agentic observability traces reasoning, correlates interactions, and makes AI-driven workflows measurable and governable.
Agentic observability is the instrumentation and correlation needed to explain and control AI agent behavior across multi-step workflows.
Legacy observability focuses on runtime health and service behavior. These monitor metrics like CPU usage, memory, latency, and error rates to confirm that applications and infrastructure are functioning as expected. When a workflow degrades, the proximate cause is often a crash, timeout, permission error, or resource constraint.
AI agents introduce a second failure surface: decision quality.
These enterprise agents don’t only execute fixed logic. They analyze inputs, generate responses, select actions, and sometimes coordinate with other agents or tools. Even when the surrounding system is healthy — infrastructure stable, APIs responsive, workflows executing correctly — the agent can still reach the wrong conclusion, misinterpret context, or choose an inappropriate action.
The system can stay green while outcomes degrade.
In agentic systems, operational risk shifts from system failure to decision quality. The critical question becomes:
Did the agent interpret the input correctly?
Did it choose the right action?
Did its reasoning align with policy and business intent?
Agentic observability makes that reasoning layer visible. It helps teams understand what an agent did, why it did it, and whether that decision should be trusted.
The quick download:
Agentic observability makes autonomous decision-making measurable, traceable, and governable at scale.
Agent-driven systems add decision integrity risk on top of infrastructure risk
Multi-agent complexity increases through interaction density, not just agent count
Effective observability requires behavior-centric metrics across performance, cost, reliability, and compliance
Correlating signals across agents is necessary to trace decision chains and understand impact
LLM Observability vs. AIOps vs. Agentic Observability
The main difference between LLM observability, AIOps, and agentic observability is that:
LLM observability measures model output quality
AIOps applies analytics and automation to IT to reduce noise and accelerate response
Agentic observability traces decision-making and action paths across autonomous workflows
As these domains evolve, their boundaries overlap, but their primary focus remains distinct.
LLM Observability
LLM observability operates at the model level. It analyzes prompt structure, response quality, latency, hallucination rates, and cost metrics. Its goal is to evaluate whether a single-model interaction yields an acceptable output.
AIOps
AIOps applies machine learning to infrastructure telemetry. It detects anomalies, correlates alerts, and can automate remediation. The system being observed is a traditional IT infrastructure.
Agentic Observability
Agentic observability extends beyond single model outputs. It tracks how AI agents interpret context, select tools, chain actions together, and influence downstream systems. The risk is no longer just incorrect output — it’s incorrect decisions propagating across workflows.
Here’s a tabular comparison between these three:
Category
Primary Focus
Core Question It Answers
What It Monitors
LLM Observability
Model output quality
Did the interaction meet defined quality and safety thresholds?
Prompts, token usage, latency, hallucinations, and evaluation scores
AIOps
IT operations optimization
Is the infrastructure healthy and responding efficiently?
Metrics, logs, alerts, anomaly detection, and automated remediation
Agentic Observability
Decision integrity across workflows
Did the agent choose the right action, for the right reason, across systems?
Multi-step reasoning, tool use, workflow coordination, and downstream impact
Why Traditional Observability is Insufficient for Agentic Operations
Legacy observability answers infrastructure questions, but it does not explain why an agent selected an action, how it interpreted context, or whether it violated policy. Here are some of the limited questions it can answer:
Is the service reachable?
Are response times within threshold?
Are dependencies returning expected codes?
Those signals remain necessary. But they don’t explain why an agent selected one action over another, why it escalated incorrectly, or why two agents diverged in their interpretation of shared context.
When AI agents become decision-makers inside workflows, uptime alone is not a sufficient signal of correctness. You can maintain 99.99% availability and still degrade service quality through flawed automated decisions.
How Observability Architecture Changes in Agentic Systems
Now that we understand the limits of traditional observability, let’s look at how agentic observability overcomes those limitations.
From Component Health to Decision Tracing
In agentic systems, observability monitors how decisions are made rather than whether components are running. It does this by capturing inputs, retrieved context references, intermediate step outputs, tool invocations and results, policy/guardrail evaluations, state transitions, and final actions.
Unlike traditional tools that trace only service dependencies and detect technical faults, agentic observability reconstructs how an action plan formed and how each step affected downstream systems.
In deterministic systems, troubleshooting asks:
Which component failed?
Which dependency caused the error?
Where did the latency spike?
In agent-driven systems, the diagnosis asks:
What context was evaluated?
What intermediate conclusions were formed?
Which tools or agents were involved?
How did those decisions propagate?
These questions define the new observability layer — the agentic observability layer — one that records how decisions evolve across systems.
Agentic systems need more than infrastructure telemetry. They need a way to connect operational signals to the decisions an agent made, the context it used, and the actions that followed.
Traditional observability platforms collect and organize telemetry across metrics, logs, events, and traces. They help teams understand system health, investigate incidents, and correlate infrastructure behavior across services and dependencies. That foundation still matters in agent-driven environments.
What changes in agentic systems is the object of analysis. The question is no longer limited to whether a service was healthy or a dependency responded on time. Teams also need to understand how an agent interpreted context, selected a tool, chose an action, and affected downstream systems.
To do that, agentic observability captures decision-layer artifacts alongside operational telemetry, including:
The context the agent received
Retrieved knowledge or reference material
Intermediate evaluations or reasoning steps
Tools, APIs, or agents it invoked
Policy checks and guardrail outcomes
State transitions and final actions
Downstream impact and outcome
These signals are then linked under a shared workflow or execution ID so teams can reconstruct the full path from input to outcome. Instead of reviewing a CPU spike, an error log, or a service trace in isolation, they can examine the complete decision sequence around a specific action.
This produces a reviewable record of how the workflow progressed, what the agent considered, what it did, and what happened next.
MELT Framework
The MELT framework still applies in agentic systems, but each signal now reflects decision behavior — not just system performance.
Traces reconstruct multi-agent workflows — how context moved, which agents participated, and how decisions propagated.
The difference lies in what the signals represent: without correlation, telemetry appears as isolated signals — a metric spike, an alert, a log entry. When linked, those signals explain intent, action, and impact.
From Agent Count to Interaction Density
In agentic systems, complexity scales with interaction density (the number of ways agents exchange context, coordinate actions, and influence outcomes), not with the number of agents.
Adding more agents increases the possible decision paths between them. Each new connection then introduces additional context exchanges, delegation patterns, fallback logic, and coordination scenarios.
An agent may consume upstream context, reinterpret it, and pass a modified state to another agent. That second agent may invoke tools, trigger additional workflows, or adjust parameters that influence infrastructure behavior. Each additional participant multiplies the number of possible decision paths.
As a result, complexity grows through relationships, so system behavior cannot be inferred from individual agent metrics alone.
Multi-agent systems typically coordinate through one of three models:
Orchestration: A central controller assigns tasks and governs execution flow. Observability must track workflow state, delegation logic, and bottlenecks in coordination.
Choreography: Agents respond independently to shared events. Observability must capture event propagation timing and unintended interactions.
Hybrid coordination: Centralized direction combined with peer-to-peer collaboration. Observability must correlate workflow context with decentralized activity.
Across all three models, agentic observability must trace interactions, not just individual agents. Because when observability maps interaction graphs instead of isolated components, IT teams can see how system-level behavior emerges and where collaboration diverges from intent.
LogicMonitor’s Edwin AI correlates alerts, topology, incidents, and automation actions through a context graph so teams can trace how signals become actions and impact services.
As a result, you get visibility into how signals evolve into actions rather than isolated snapshots of system state.
The agent’s planned action appears in real time before execution
The observability layer detects active sessions and flags risk
Engineers see the full context, including what the agent evaluated, planned, and prioritized
A less disruptive fix is approved and executed in minutes
The full decision trail is logged for fast, accurate review
When organizations gain real-time visibility into agent decisions, operational improvements compound.
With Edwin AI, IT teams report 80% reduction in alert volume, 88% reduction in alert noise, and a
67% drop in overall incident rates after implementing intelligent observability. Fewer incidents mean less downtime, fewer customer escalations, and stronger retention.
Every hour shaved off incident resolution is an hour of revenue and customer experience protected.
These improvements translate directly into business outcomes: faster resolution reduces downtime. Reduced downtime lowers customer escalations and protects revenue.
Edwin AI reduced alert noise by 80% and sped up incident resolution by 30%.
When AI agents move from experimentation into production workflows, the risk profile changes. Failures no longer originate primarily from infrastructure instability but from automated decisions.
Unlike deterministic systems, where faults are typically localized and observable through performance degradation, agent-driven systems can introduce risk while infrastructure metrics remain healthy. The exposure lies in how decisions are formed, propagated, and executed.
Three categories of operational risk dominate in agent ecosystems:
Cost Overruns
Agents that misinterpret task scope, retry excessively, or trigger unnecessary downstream processes can rapidly increase infrastructure consumption and API usage. Without visibility into why actions were taken and how they escalated across workflows, financial impact can accumulate before teams detect abnormal patterns.
Compliance Exposure
Many regulatory frameworks require explainability for automated decisions. If an organization cannot reconstruct how an agent reached a conclusion — including the context evaluated and intermediate reasoning steps — audit defensibility weakens. Even technically correct outcomes may fail compliance standards if the decision path cannot be demonstrated.
Reliability Degradation
Agent behavior can drift gradually. Small inaccuracies, repeated at scale, become systemic service degradation. Unlike outages, this deterioration may not trigger traditional threshold-based alerts. Customer experience declines while infrastructure dashboards remain green.
These risks compound because actions propagate across workflows faster than humans review them. Agentic observability captures decision intent, interaction chains, and downstream impact.
Measuring Agentic Systems
To operationalize agentic observability, you must define measurable indicators of decision quality, cost, reliability, and compliance.
What to Measure in Agentic Systems
Focus on four metric pillars:
Performance: Measures whether the agent produces correct results within acceptable timeframes. Track task success rate, decision latency, and end-to-end goal completion.
Cost: Measures resource efficiency relative to output. Track token usage, API calls, and compute cost per task.
Reliability: Measures consistency under varying conditions. Track retry rate, escalation frequency, and failure patterns.
Compliance: Measures traceability and adherence to policy. Track audit trail completeness, policy adherence, and decision traceability.
These pillars give you a structured way to evaluate autonomous systems beyond traditional service metrics.
Edwin AI operationalizes agentic observability by combining:
Agent tracing
Decision visibility
Context-aware alert correlation
Cross-system root cause analysis
Edwin surfaces alerts and connects agent behavior with infrastructure state, service impact, and historical context across hybrid environments.
Agent-Specific Metrics You Should Track
Beyond the four pillars, certain metrics are specific to agent-driven systems. These metrics focus on how agents behave and how reliably they produce outcomes, not just whether the system remains online:
Metric
What You Should Measure
Why It Matters
Task Success Rate
Percentage of tasks completed correctly
Core indicator of effectiveness
Decision Latency
Time between input and action
Affects workflow speed
Retry Rate
Frequency of repeated attempts
Signals ambiguity or unstable logic
Escalation Rate
Frequency of human handoff
Indicates confidence boundaries
Goal Completion Rate
Percentage of multi-step workflows fully resolved
Measures end-to-end reliability
Drift Rate
Deviation from established behavior patterns
Early signal of degradation
Audit Trail Completeness
Percentage of decisions fully traceable
Required for governance and compliance
Baseline Ranges by Agent Role
Agent metrics do not have universal thresholds. What is acceptable depends on the agent’s role, risk exposure, and workflow impact.
Different agent types require different baselines:
Conversational agents tolerate slightly lower success rates because they operate in open-ended contexts.
Analytical agents may take longer to respond due to data processing.
Execution agents require the tightest thresholds because their actions directly affect systems or customers.
Agent Type
Task Success Rate
Decision Latency
Escalation Rate
Conversational
85–95%
< 3 seconds
5–15%
Analytical
90–98%
5–30 seconds
2–8%
Action / Execution
95–99%
< 10 seconds
1–5%
These ranges should be treated as starting points. You should calibrate them based on workflow criticality, volume, and risk tolerance.
Why Metrics Must Be Read Together
Individual metrics in isolation are misleading. A low decision latency looks great until you realize it correlates with a high retry rate, meaning the agent is moving fast and getting things wrong. A strong task success rate means little if audit trail completeness is low and you can’t explain how those successes were reached.
The most useful signal comes from correlations: cost vs. success rate, latency vs. reliability, escalation rate vs. drift score. This is also why static thresholds don’t suit autonomous agents.
An action agent spiking to a 12% retry rate during a novel task type is very different from the same spike appearing in a well-established workflow. Context determines what the number means, and context is exactly what traditional monitoring discards.
Agentic Observability Implementation Best Practices
When implementing agent observability, focus on practical foundations rather than full-system coverage on day one:
Start with business-critical agents: Prioritize agents tied to revenue, compliance exposure, or core operations. Tools like Edwin can help identify which agents drive the most correlated alerts or downstream impact.
Establish baselines before optimizing: Define normal ranges for task success, latency, retries, and cost before tuning performance or spend.
Design for cross-agent correlation: Monitor decision chains and dependencies across agents, not just individual components. Correlating events, alerts, and anomalies reveals shared patterns and cause-and-effect relationships.
Plan for interaction-driven data growth: More agents create more relationships and signals. So, design storage, retention, and analysis models accordingly.
Build compliance from the start: Governance should be part of system design to capture decision traces, context history, and policy validation early.
Governance and Compliance Requirements
In agent-driven systems, observability becomes a governance requirement because organizations must prove how automated decisions were made.
Agent decisions can influence customer outcomes, financial transactions, and regulatory exposure. Without transparent visibility into how those decisions are made, you may struggle to demonstrate accountability.
Several regulatory frameworks formalize these expectations:
EU AI Act (high-risk AI systems)
The EU AI Act requires high-risk AI systems to maintain:
Traceability of decisions
Technical documentation of system behavior
Human oversight mechanisms
Logging of system activity
Agentic observability supports these requirements by capturing decision history, contextual inputs, workflow interactions, and system logs over time.
National Institute of Standards and Technology AI Risk Management Framework
Your IT teams must capture real-world system behavior to meet these principles.
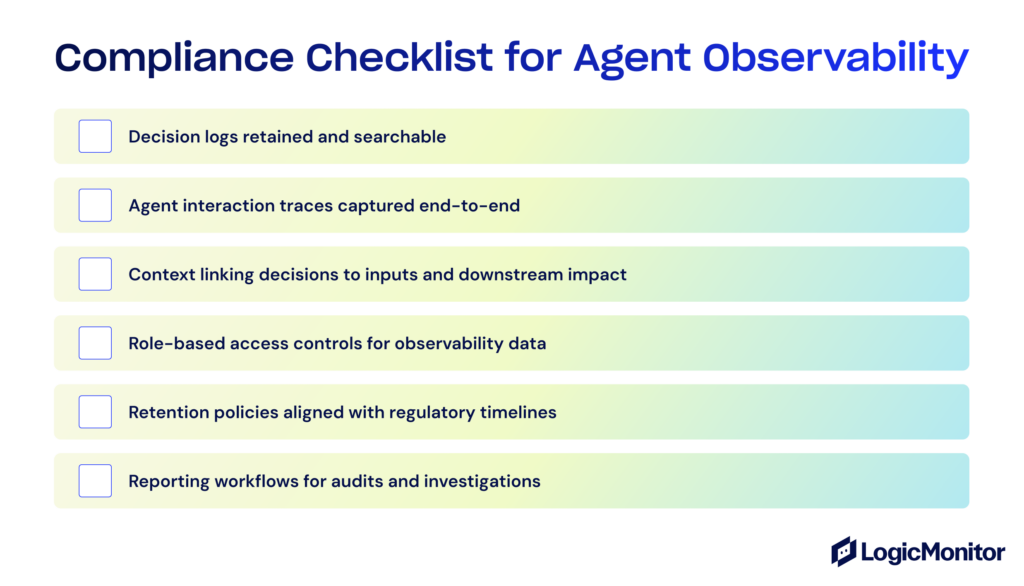
Note: Use this quick checklist to evaluate agentic observability readiness:
The Future of Agentic Observability
As agents move deeper into production workflows, “green” dashboards stop being a useful signal. The real questions become: what changed, what caused it, and was the action appropriate? Answering those questions consistently is what separates teams that scale confidently from teams that scale cautiously.
Three shifts will define how this space matures.
Observability and governance will converge: Agent actions will be treated like production changes — each step tracked with a unique ID, a record of inputs evaluated, tools invoked, policy checks passed or failed, and outcomes verified. This is the minimum required to debug effectively and survive an audit. Without it, incident reconstruction is guesswork.
Data volume will force discipline: Agentic workflows generate dense, high-cardinality telemetry. Capturing everything is neither practical nor useful. The mature approach is selective: full traces for high-risk workflows, lightweight summaries for routine runs, strict retention policies, and access locked to those who need it. The goal is signal density, not data volume.
Control will become as important as visibility: Visibility tells you what happened. Control determines what’s allowed to happen next. The teams that operationalize this well will gate high-risk actions before execution, verify outcomes rather than trusting model confidence, and use observability data to continuously refine policies and permissions. That’s how you extend agent autonomy safely and pull it back quickly when you can’t.
Takeaway: Treat observability as a design requirement, not an afterthought. Instrument decisions alongside infrastructure, establish the audit trail before you scale, and build the feedback loop that lets your agents earn more autonomy over time.
Turn Agentic Observability Into Real Operational Outcomes with Edwin AI
To turn agentic observability into operational control, take measurable actions that connect agent decisions to business impact:
Identify the agents that directly impact revenue, compliance, or customer experience.
Define baseline metrics for success rate, latency, retries, and cost.
Correlate agent decisions with infrastructure signals and downstream outcomes.
Capture full decision traces and interaction histories for audit readiness.
Reduce alert noise by prioritizing correlated, workflow-level signals.
When you connect agent behavior to system impact, you shift from monitoring automation to controlling it.
Edwin AI helps with just that.
It operationalizes agentic observability by linking agent events, metrics, logs, topology, and incidents into a unified view. This allows your teams to trace how a decision moves across systems and measure its operational and business impact in real time.
Edwin AI brings agentic observability to life across real IT operations
See how context-aware correlation and AI-powered insights help teams monitor, understand, and optimize agent-driven environments with confidence.