Cost Optimization in Action: How We Cut Amazon SQS Costs by 87%
An inside look at how LogicMonitor reduced AWS SQS spend by 87% by embedding cost data directly into observability workflows, aligning performance, reliability, and financial efficiency.
JC,the Director of Software Engineering, Cloud at LogicMonitor, shares how Cost Optimization enabled his team to shift to Cost-Intelligent Observability and tackle an unexpected and growing cloud bill.
LogicMonitor reduced AWS SQS costs by 87% by embedding cost data directly into observability workflows.
Correlating cost, performance, and usage metrics enabled faster, data-driven optimization without SLA tradeoffs.
Cost-Intelligent Observability turns cloud spend into a real-time engineering signal — not a month-end surprise.
As engineers, we live and breathe performance. We obsess over latency, reliability, and uptime, the hallmarks of a healthy system. But there’s another metric that’s becoming just as critical: cost.
In today’s cloud-dependent world, scale and spend are inseparable. The more you grow, the easier it is for small inefficiencies to snowball into big bills. And unless cost data is part of your observability picture, you’re flying blind when it comes to optimizing for efficiency. That’s why, at LogicMonitor, my team and I started practicing what we call Cost-Intelligent Observability, which completely changed how we approach engineering decisions.
Read about the Cost-Intelligent Observability philosophy— the framework that enables cost optimization through collaboration and visibility.
Traditional observability is all about performance telemetry: metrics, logs, and traces that tell you how your systems are behaving. Cost-Intelligent Observability adds a new layer that connects those signals directly to the dollars behind them. Through LogicMonitor’s Cost Optimization tool, we integrated our cloud cost data directly into our monitoring environment. This eliminated tedious spreadsheets and tool switching.
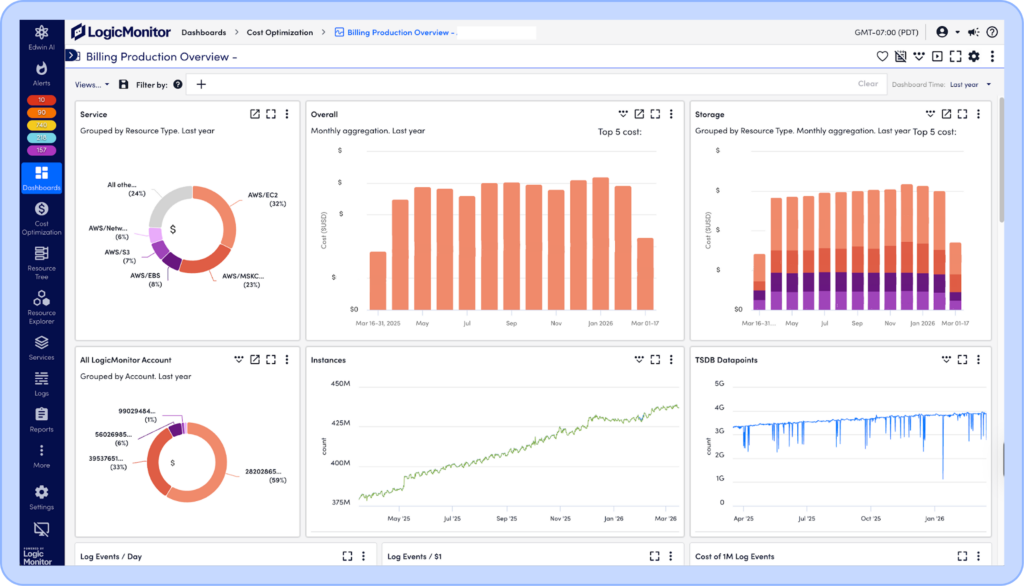
LogicMonitor dashboard correlating performance telemetry with AWS cost data, enabling engineers to analyze system health and cloud spend in a single view.
By embedding cost data into our observability workflows, we started correlating spend with performance, usage, and reliability. Every time we tweak a service, deploy new infrastructure, or change message batching behavior, we immediately see how it affects both our SLAs and our AWS bill. No more end-of-month surprises, just a real-time performance signal.
Why We Switched to Cost-Intelligent Observability
The Challenge: An Expensive Surprise in Amazon SQS
During one of our monthly cost reviews last year, we spotted something unexpected. Our Amazon Simple Queue Service (SQS) spend had quietly climbed to around $40,000 per month across two of our running services.
Cloud-Collector: about $24,000 per month
Site-Monitor: about $16,000 per month
Surprisingly, this was a much higher bill than it should have been given the throughput and SLA targets. I hadn’t budgeted for this, and I needed to get back on track as quickly as possible, before finance was alerted.
The goal was clear: find out why and figure out how to optimize without a reliability tradeoff.
Then we would establish best practices to prevent similar surprises from happening again.
How We Tackled It
Utilizing LogicMonitor’s Cost Optimization tool, we integrated Amazon SQS cost data directly into our observability dashboards. In a single, side-by-side view, we could analyze cost, performance, and usage metrics. As we implemented changes, we were tracking the immediate impacts to performance and ensuring our costs were decreasing. With this new approach, we could act faster and with more confidence.
We used the principles of an iterative optimization loop to reduce costs for our Cloud-Collector service:
Establish a Baseline: We benchmarked cost per message, queue depth, and performance.
Experiment with Batching: We tested different message batching strategies to reduce API calls without affecting SLA latency.
Correlate and Validate: We visualized real-time cost-to-performance relationships in our LogicMonitor dashboards to connect how performance impacted costs. We were able to validate our optimization changes for confident scaling.
This closed-loop workflow became our new standard and helped us define Cost-Intelligent Observability.
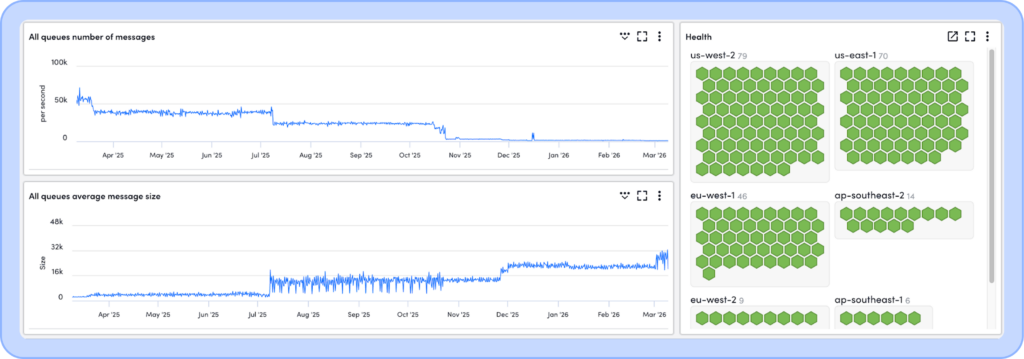
Widgets tracking queue size, message volume, and overall service health to monitor system stability while adjusting queue configurations.
The Result: 87% Cost Reduction and No Performance Trade-Off
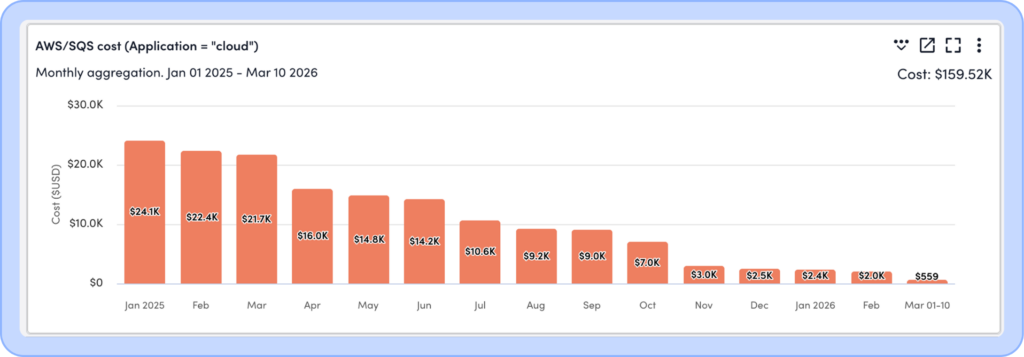
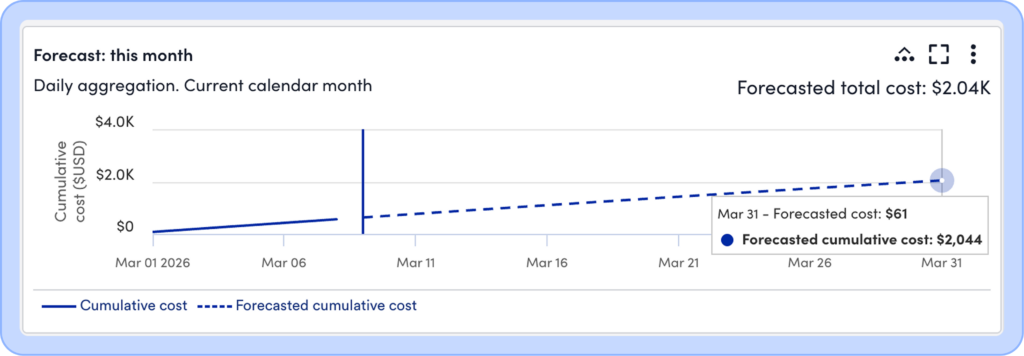
With a successful closed-loop workflow, we reduced Amazon SQS costs for Cloud-Collector by 87%, from about $24,000 down to $3,000 per month, all while maintaining the same throughput and latency targets. The insights into on-going tracking of performance and cost data from LogicMonitor’s Cost Optimization gave us the data we needed to validate each iteration and quantify the real savings, helping us make confident adjustments without risking performance. We’ve been applying the same approach to Site-Monitor and have already reduced costs by 25%. The budget is back on track and with billing forecast widgets integrated into my dashboards, I can see unexpected costs climbing before a monthly cost review.
Visualization of AWS SQS cost reductions as optimization changes are implemented and monitored in real time.Billing forecast widget predicting future cloud spend so teams can detect cost spikes before monthly billing reviews.
What I Learned From the Process
Visibility Is Everything
When cost data lives in the same place as your performance data, engineers start thinking about efficiency as naturally as uptime.
Optimization Should Be Data-Driven
Guessing about what is expensive rarely works. Correlating cost, usage, and SLA metrics makes the optimization process precise and repeatable.
Validate, Don’t Assume
It is easy to think a change will save money, until it breaks something or shifts costs elsewhere. Continuous validation keeps you honest.
Culture Follows Visibility
Once your team can see the cost impact of decisions, cost awareness stops feeling like a finance concern and starts feeling like good engineering.
Why This Matters
This experience reinforced a simple truth: observability isn’t just about uptime anymore. If your tools only tell you whether things are running, not what it costs to keep them running, you are missing half the picture.
Cost-Intelligent Observability shows the full picture, and LogicMonitor’s Cost Optimization makes cost into an actionable metric. This integrated approach helps teams scale confidently, optimize intelligently, and make every dollar of cloud spend count toward delivering real business value.
That’s the future we are building at LogicMonitor, one where performance, reliability, and financial efficiency go hand-in-hand.
Eliminate surprise cloud spend with built-in cost intelligence.
Explore interactive billing dashboards and cost optimization recommendations to see how Cost-Intelligent Observability could support your cloud optimization efforts.
Jean-Charles Thouin is a Director of Software Engineering at LogicMonitor, where he leads Cloud Monitoring and Cost Optimization. With 16 years of experience and over 5 years at LogicMonitor, he focuses on building high-performing teams that deliver scalable, customer-centric cloud solutions.
Passionate about leadership and product thinking, Jean-Charles believes great engineering starts with deeply understanding customer needs. Outside of work, he’s a licensed pilot who loves flying and enjoys spending time skiing in the mountains.
Disclaimer: The views expressed on this blog are those of the author and do not necessarily reflect the views of LogicMonitor or its affiliates.