Integrations
VMware

VMware Monitoring Software

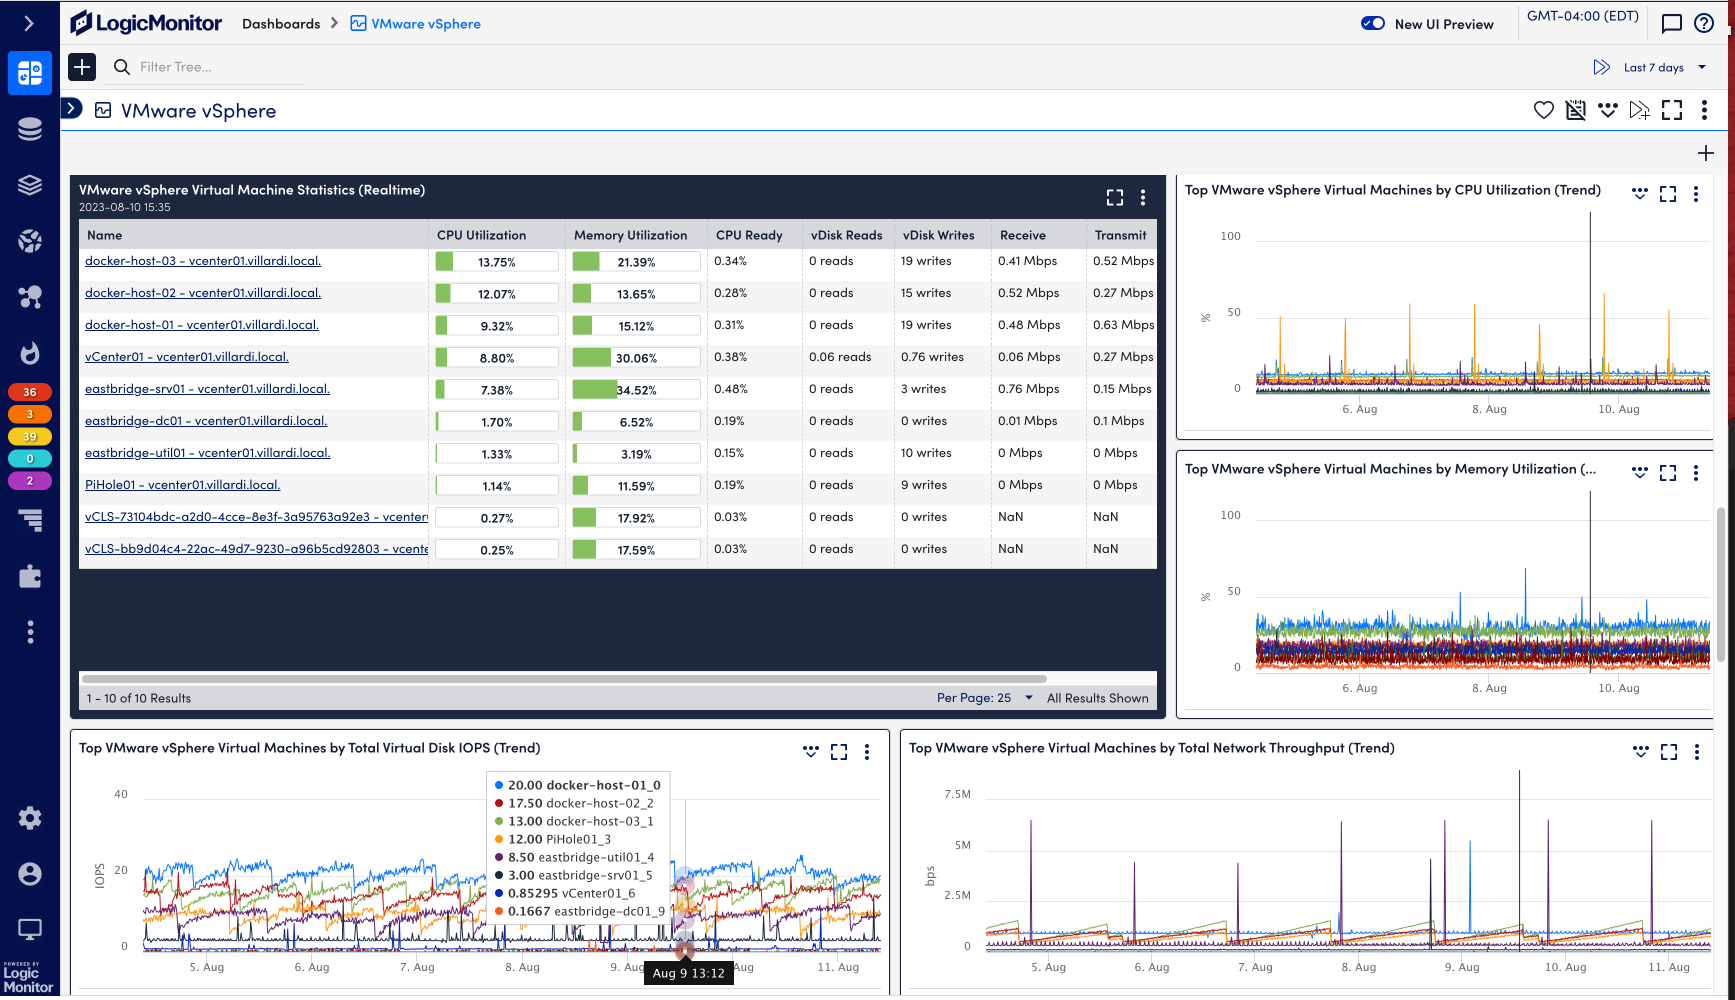
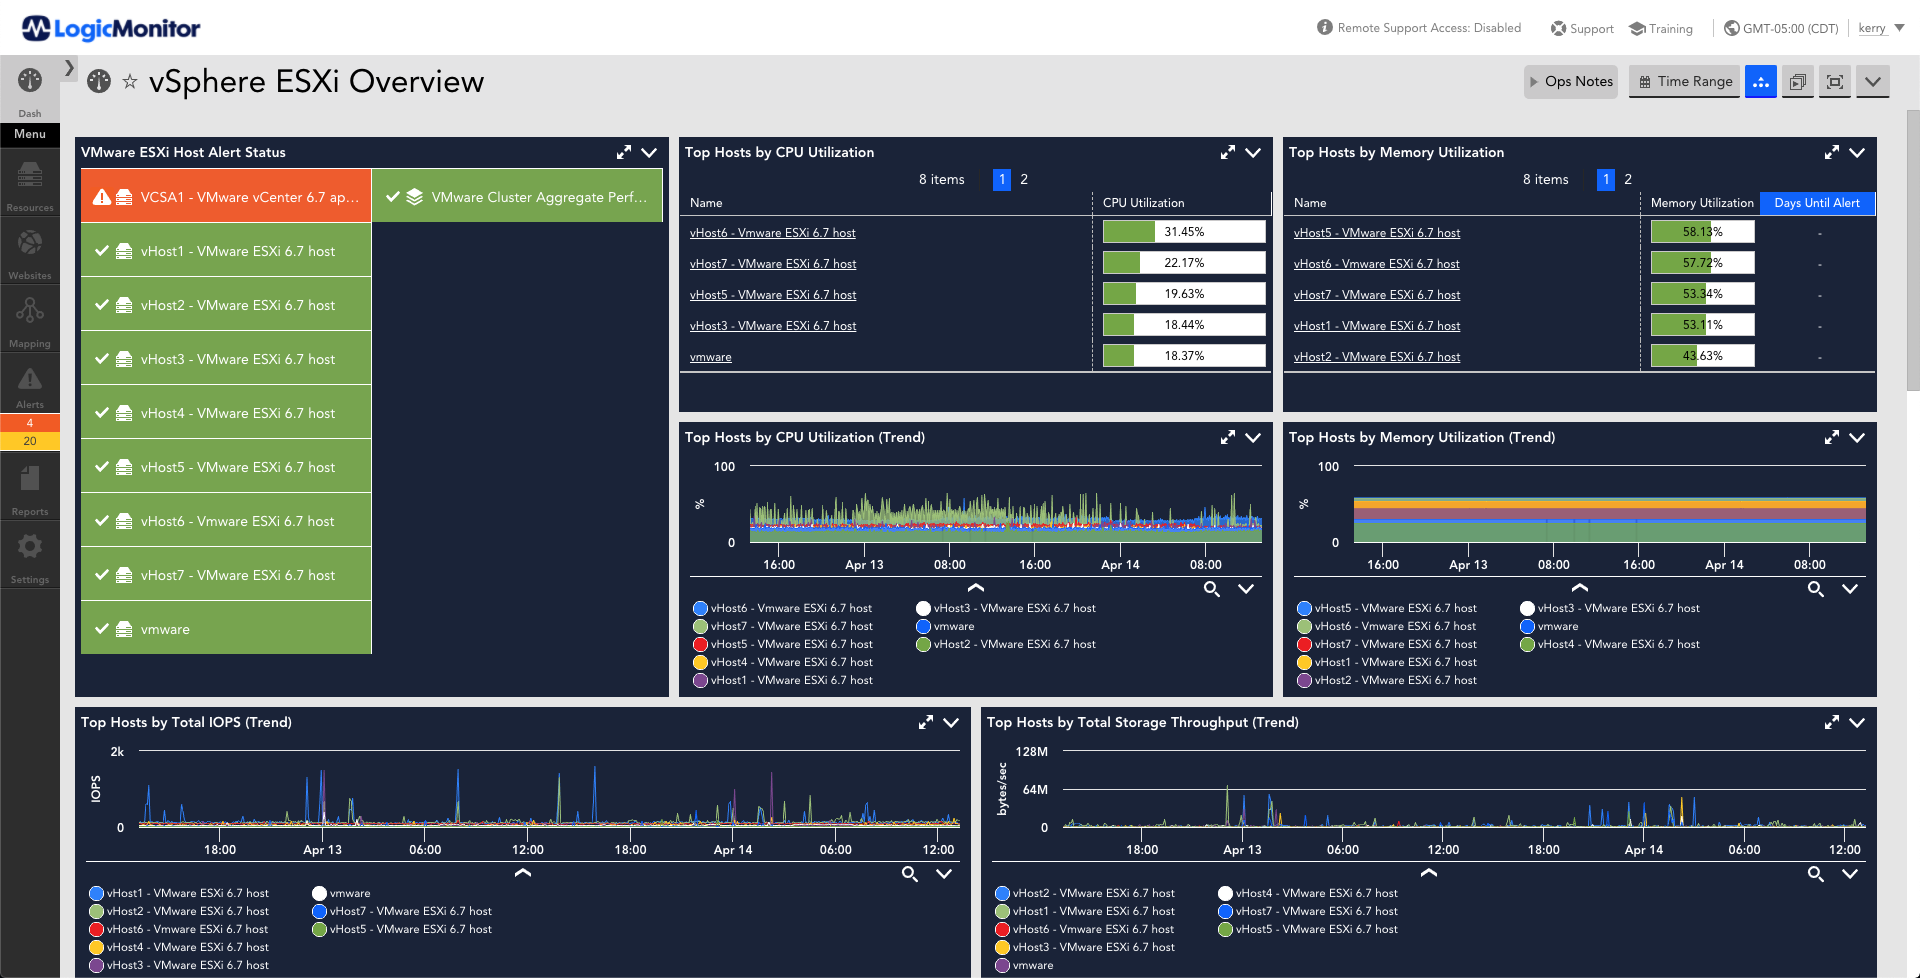
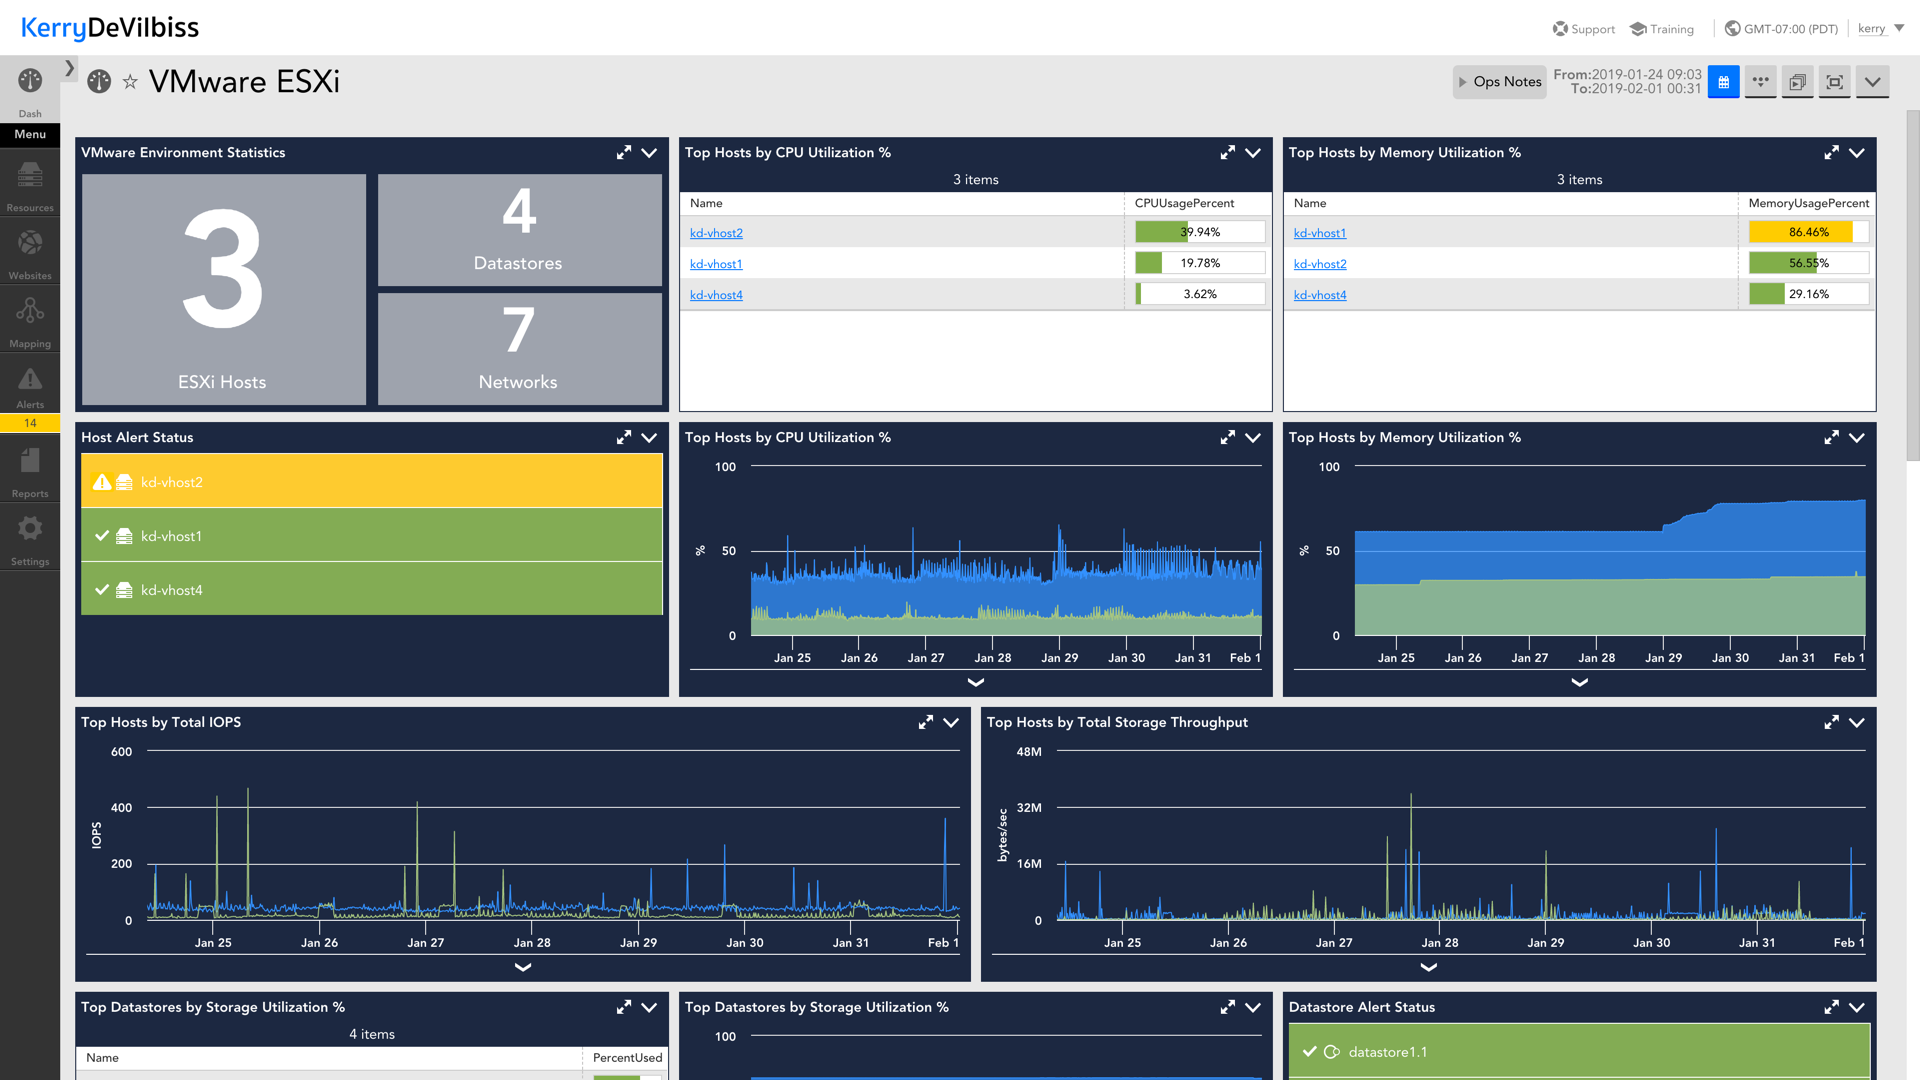
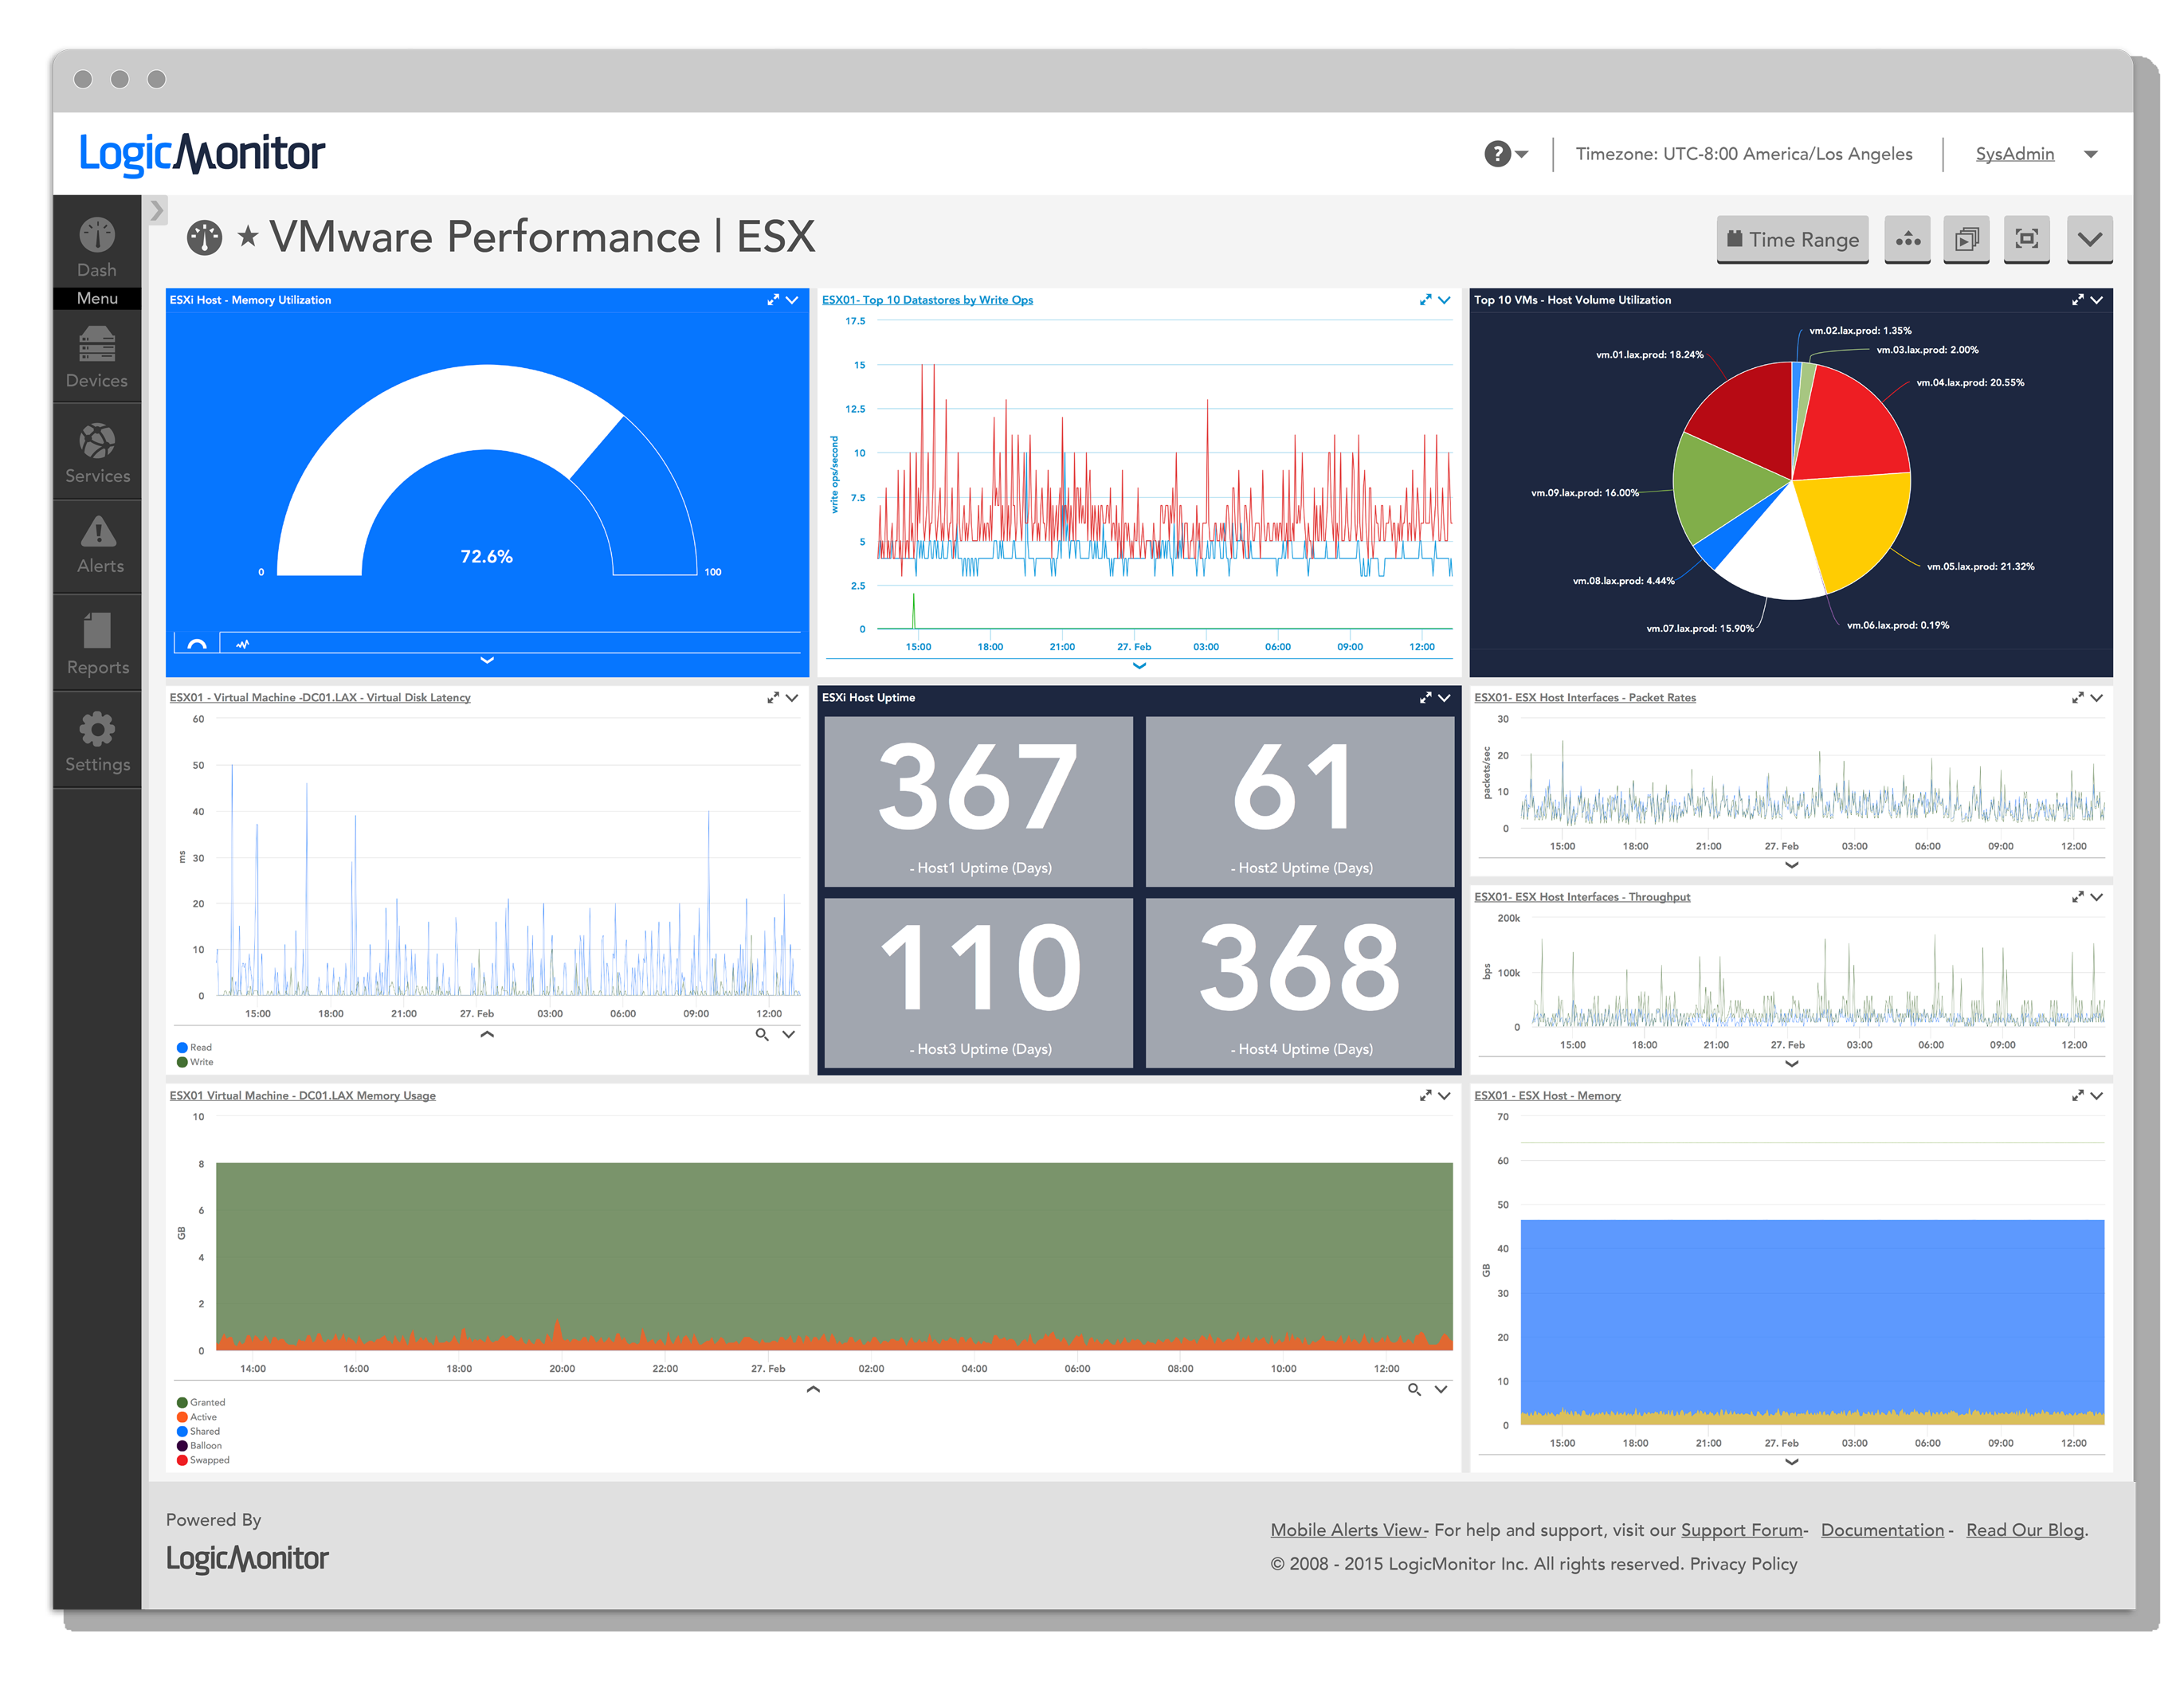
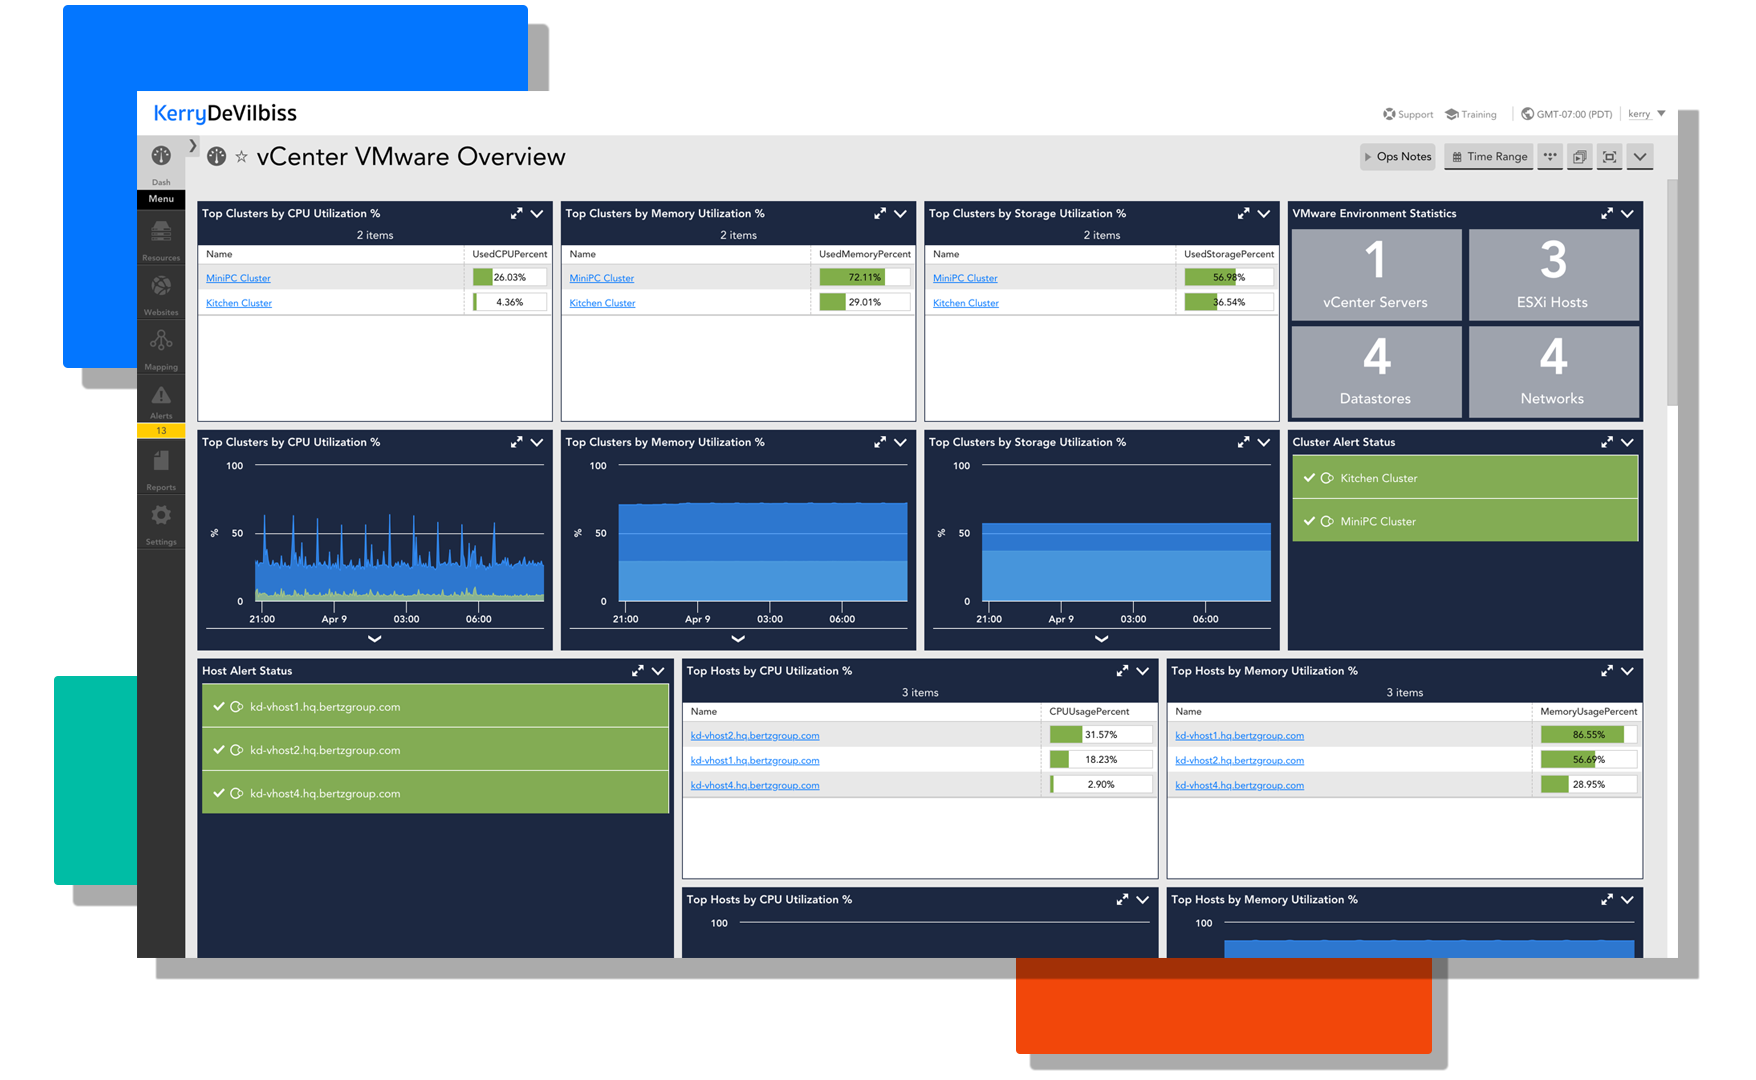
LogicMonitor provides in-depth, agentless monitoring of your entire VMware ecosystem in a snap. Just provide your vCenter / vSphere hostname, and we automatically discover your virtualization environment and begin monitoring. No manual configuration or additional hardware needed. Just the end-to-end analysis and visualization you need, all within minutes. Deliver uptime that gives you downtime with LogicMonitor’s unified observability and monitoring platform.

VMWare vsphere logicmonitor dashboard

A better way to collaborate, communicate, and automate

clarity graphic

So much forecasting, so little downtime

Monitor your entire VMware ecosystem within a single system. Get server consolidation and improved utilization of your compute resources while staying ahead of impending issues that can affect your virtual machines. Get recommendations without you having to be an expert in VMware monitoring. Use LogicMonitor’s unique “Top 10” visualizations to identify problem hypervisors before they impact service health. When you have a service outage and need immediate root-cause analysis, get visibility into the entire environment with LogicMonitor.

dependencies

Get data into the right hands at the right time

Dynamically generate topology maps that show how data flows among complex resources. See alerts within your infrastructure to streamline troubleshooting and reduce MTTR. Pinpoint anomalies for a monitored resource and compare that anomaly to key historical signals – with LogicMonitor you can quickly understand where any performance issues lie. LogicMonitor can also monitor the network devices that connect your environment together: Cisco, Juniper, HP, Extreme Networks, Dell, PaloAlto, Brocade, F5, Citrix Netscaler, and others.

header image

SaaS-based and thriving

Our monitoring platform is exceptionally easy to deploy and manage, so you can work easier, faster, and smarter. We’re not just a platform; LogicMonitor is a true partner. Leverage our 24×7 support or utilize custom LM Professional Services engagements that cover a wide range of customer needs and onboarding goals, designed to enable faster and more successful deployments. Accelerate your business growth with award-winning Professional Services today. 

VMware:

Maintain up to 100% performance

Monitor VMware metrics for all your ESXi hosts and see critical visualizations of memory usage, swap rate, CPU load, disk latency, and other hardware statistics. Intelligent thresholds built on machine learning warn you of impending issues and advise on how to improve performance and meet your SLAs.

This dashboard provides an a listing of various metrics that are monitored for vSphere ESXi Overview. The metrics displayed are status, real-time CPU utilization, real-time memory utilization, CPU utilization over time, memory utilization over time, total IOPS over time, total storage throughput over time.

VMware vCenter:

More vCenter insights in less time

LogicMonitor uses the VMware API to comprehensively monitor VMware vCenter in minutes. Our agentless collectors go beyond baseline performance monitoring to map the dependencies of your VMs, the applications running on them, and the backend infrastructure your VMware services rely on. Track VM performance and mitigate issues quickly with detailed statistics and AI-powered alerts.

This dashboard provides an a listing of various metrics that are monitored for vSphere ESXi Overview. The metrics displayed are status, real-time CPU utilization, real-time memory utilization, CPU utilization over time, memory utilization over time, total IOPS over time, total storage throughput over time.

VMware Horizon:

Keep your end-users connected

Get real-time data on virtual desktops and remote workstations deployed through VMware Horizon, so you can keep your end-users and customers online.​ Improve your virtual desktop infrastructure (VDI) by monitoring persistent disks, datastore state, desktop pools, vSphere host state, and more.

VMware VCSA:

Support any deployment in any location

No matter where or how you deploy VMware, LogicMonitor has you covered. We provide full coverage for both Windows and Linux-based VMware environments out-of-the-box so you can easily monitor CPU usage, file system capacity, disk performance, memory, and much more.

Add’l Infrastructure:

Know more about your infrastructure than anyone else

Monitor the health and performance of your storage systems, network devices, logs, applications, and more. With out-of-the-box monitoring support for more than 2,000 technologies, LogicMonitor makes it easy to keep track of all the critical pieces that hold your infrastructure environment together.

This dashboard provides an a listing of various metrics that are monitored for vSphere ESXi Overview. The metrics displayed are status, real-time CPU utilization, real-time memory utilization, CPU utilization over time, memory utilization over time, total IOPS over time, total storage throughput over time.

Get the metrics that matter

Easily monitor and improve Virtual Machine performance within a single system – whether your resources are hosted on-premises or in the cloud, in multiple geographic regions or data centers. From high-level impressions down to the most granular data, LogicMonitor provides a unified view of all the metrics that matter.

Explore VMM
unification graphic

Save time, money, and resources

The continuous growth of VMs and their usage can negatively affect application performance and server operating times – draining important resources. Utilizing LogicMonitor’s out-of-the-box under-utilized and over-utilized resource dashboards, you can identify and right size your virtual machine infrastructure in real time to reduce excess capacity and save money.

Explore Dashboards
retail icon

Proactively prevent outages with intelligent monitoring

With powerful AI features built in, keeping your virtualized infrastructure optimized and available has never been easier. Detect issues sooner with dynamic thresholds, reduce MTTR with root cause analysis, proactively prevent issues, and plan future resource allocation with automated forecasting.

Reduce MTTR
clarity graphic