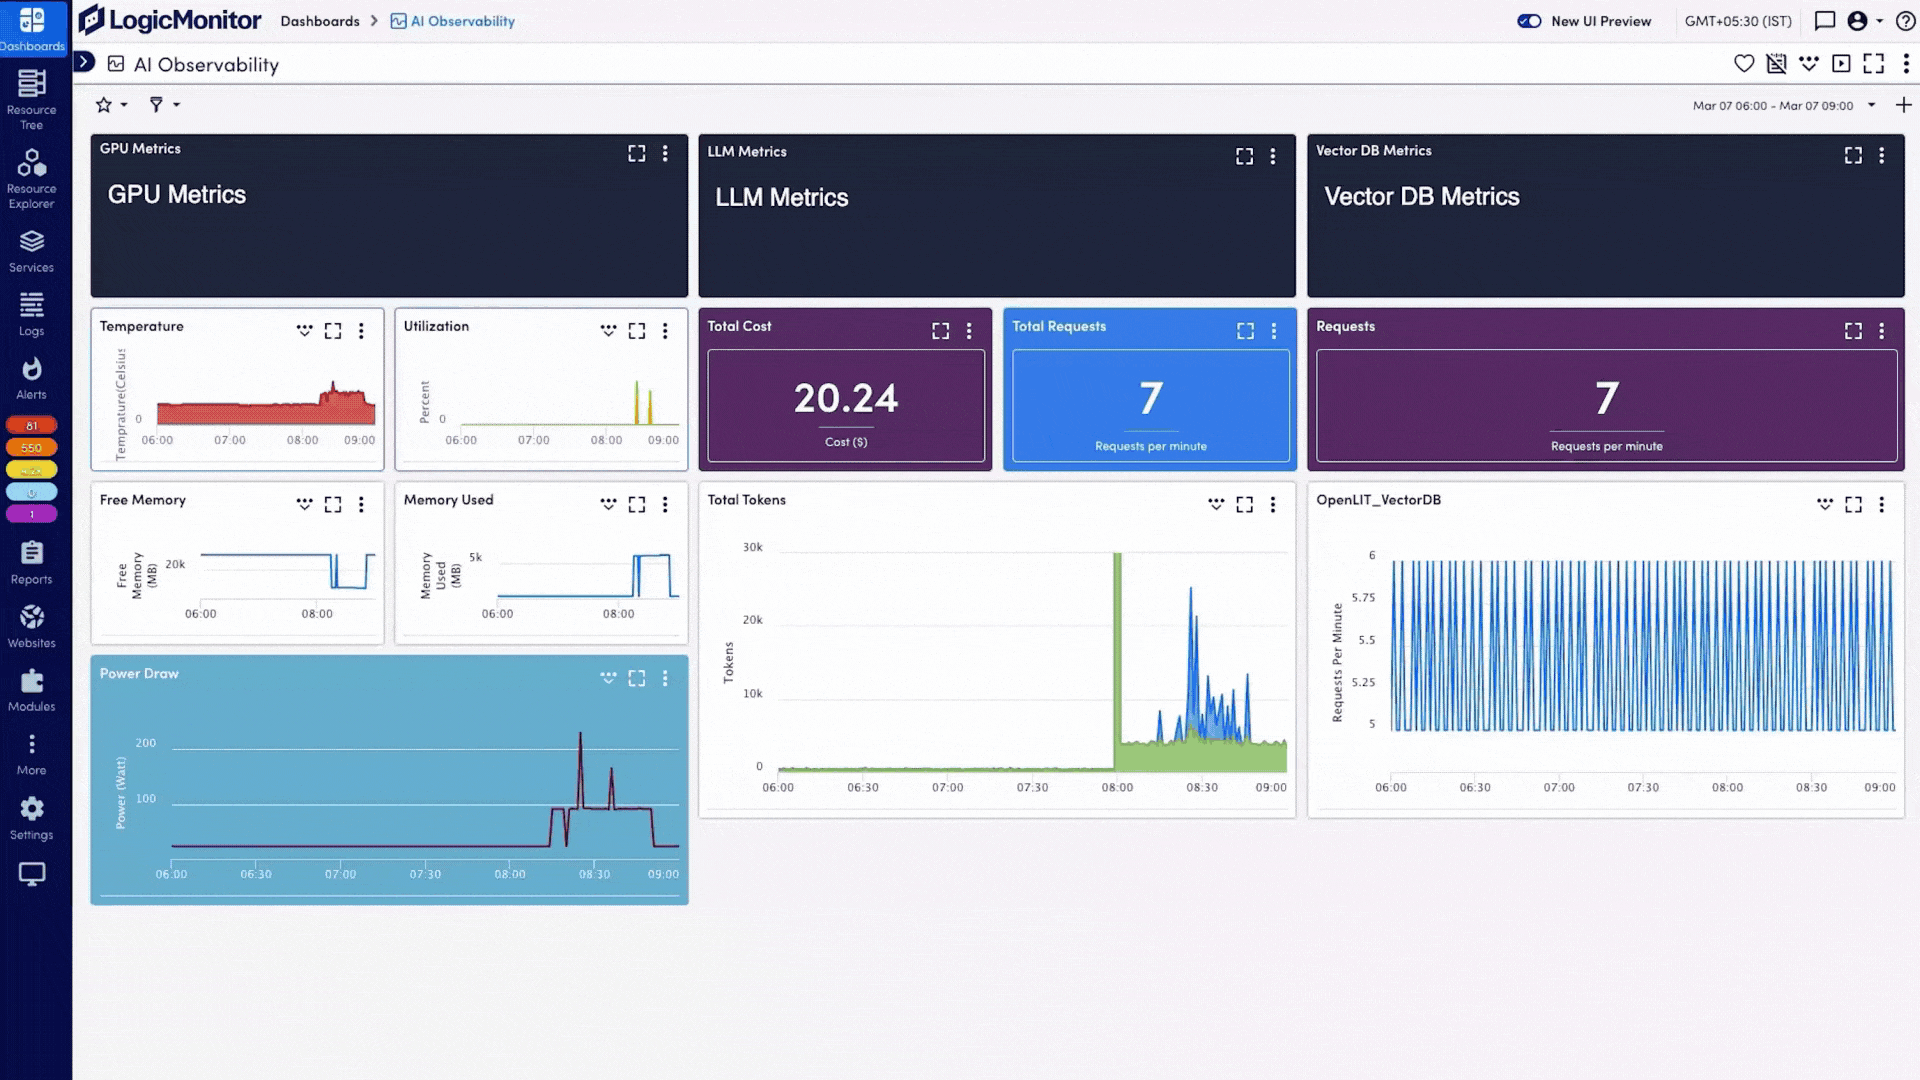
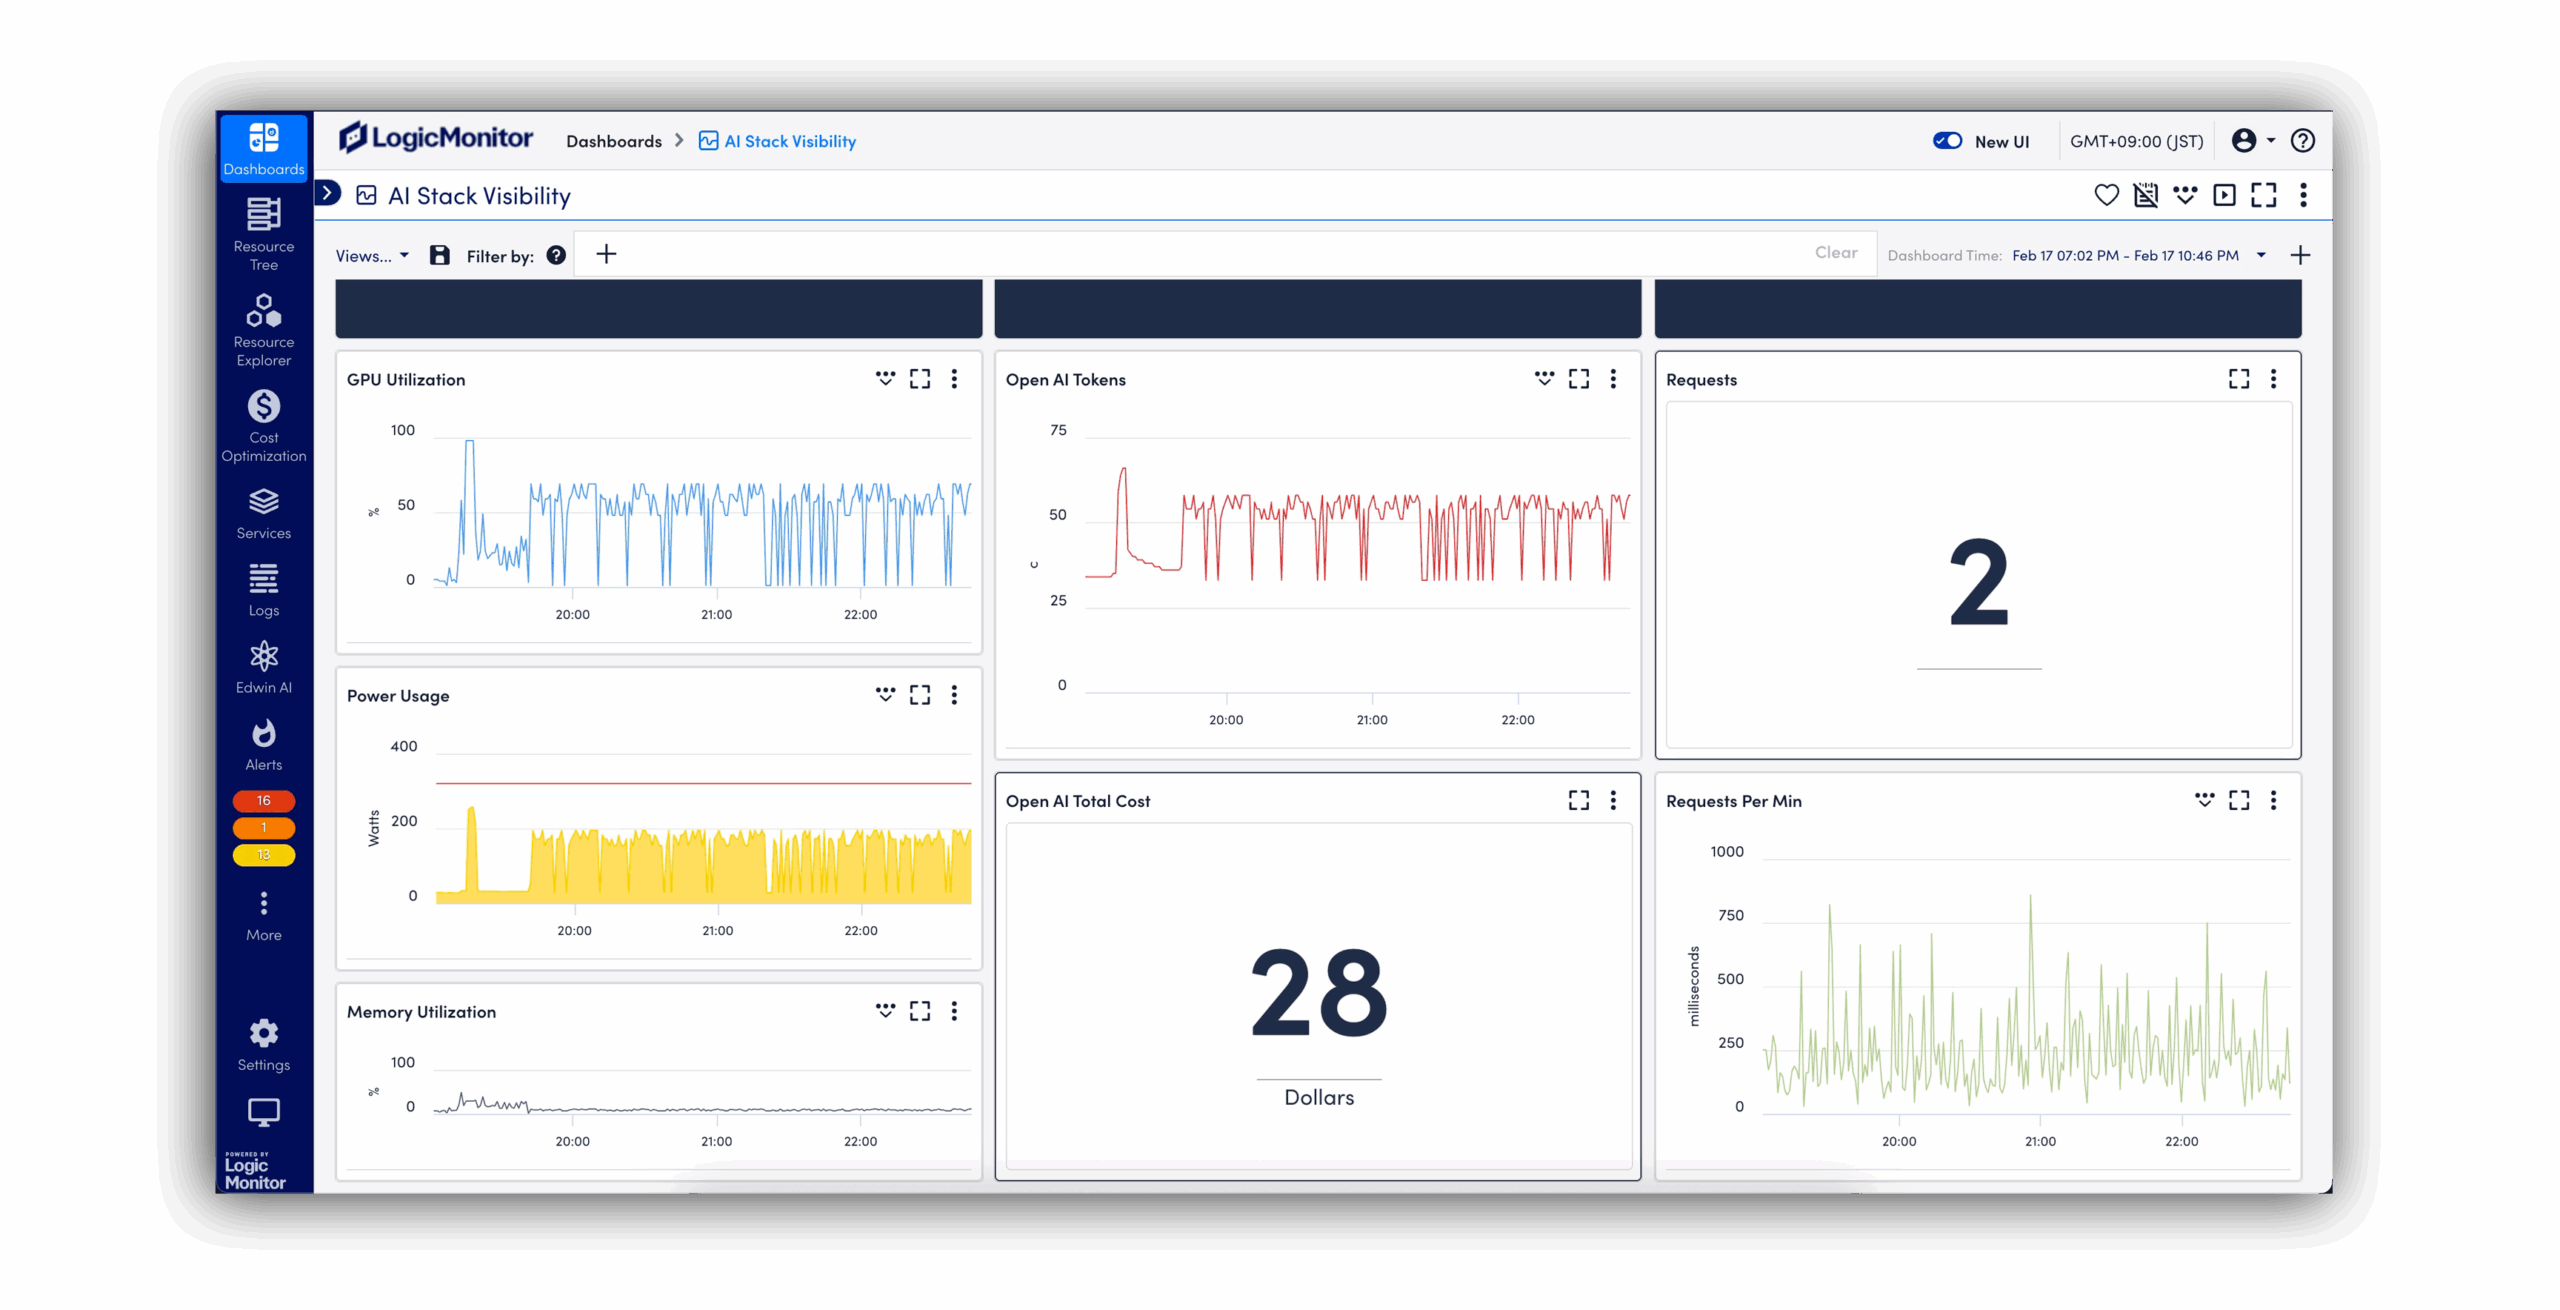
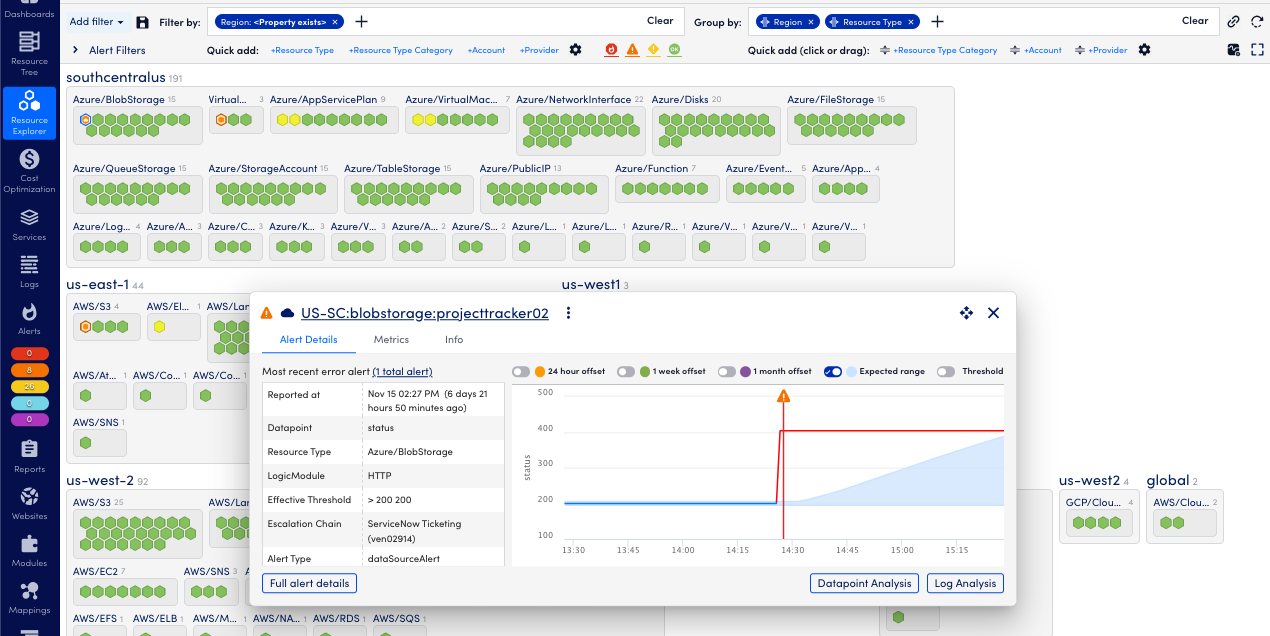
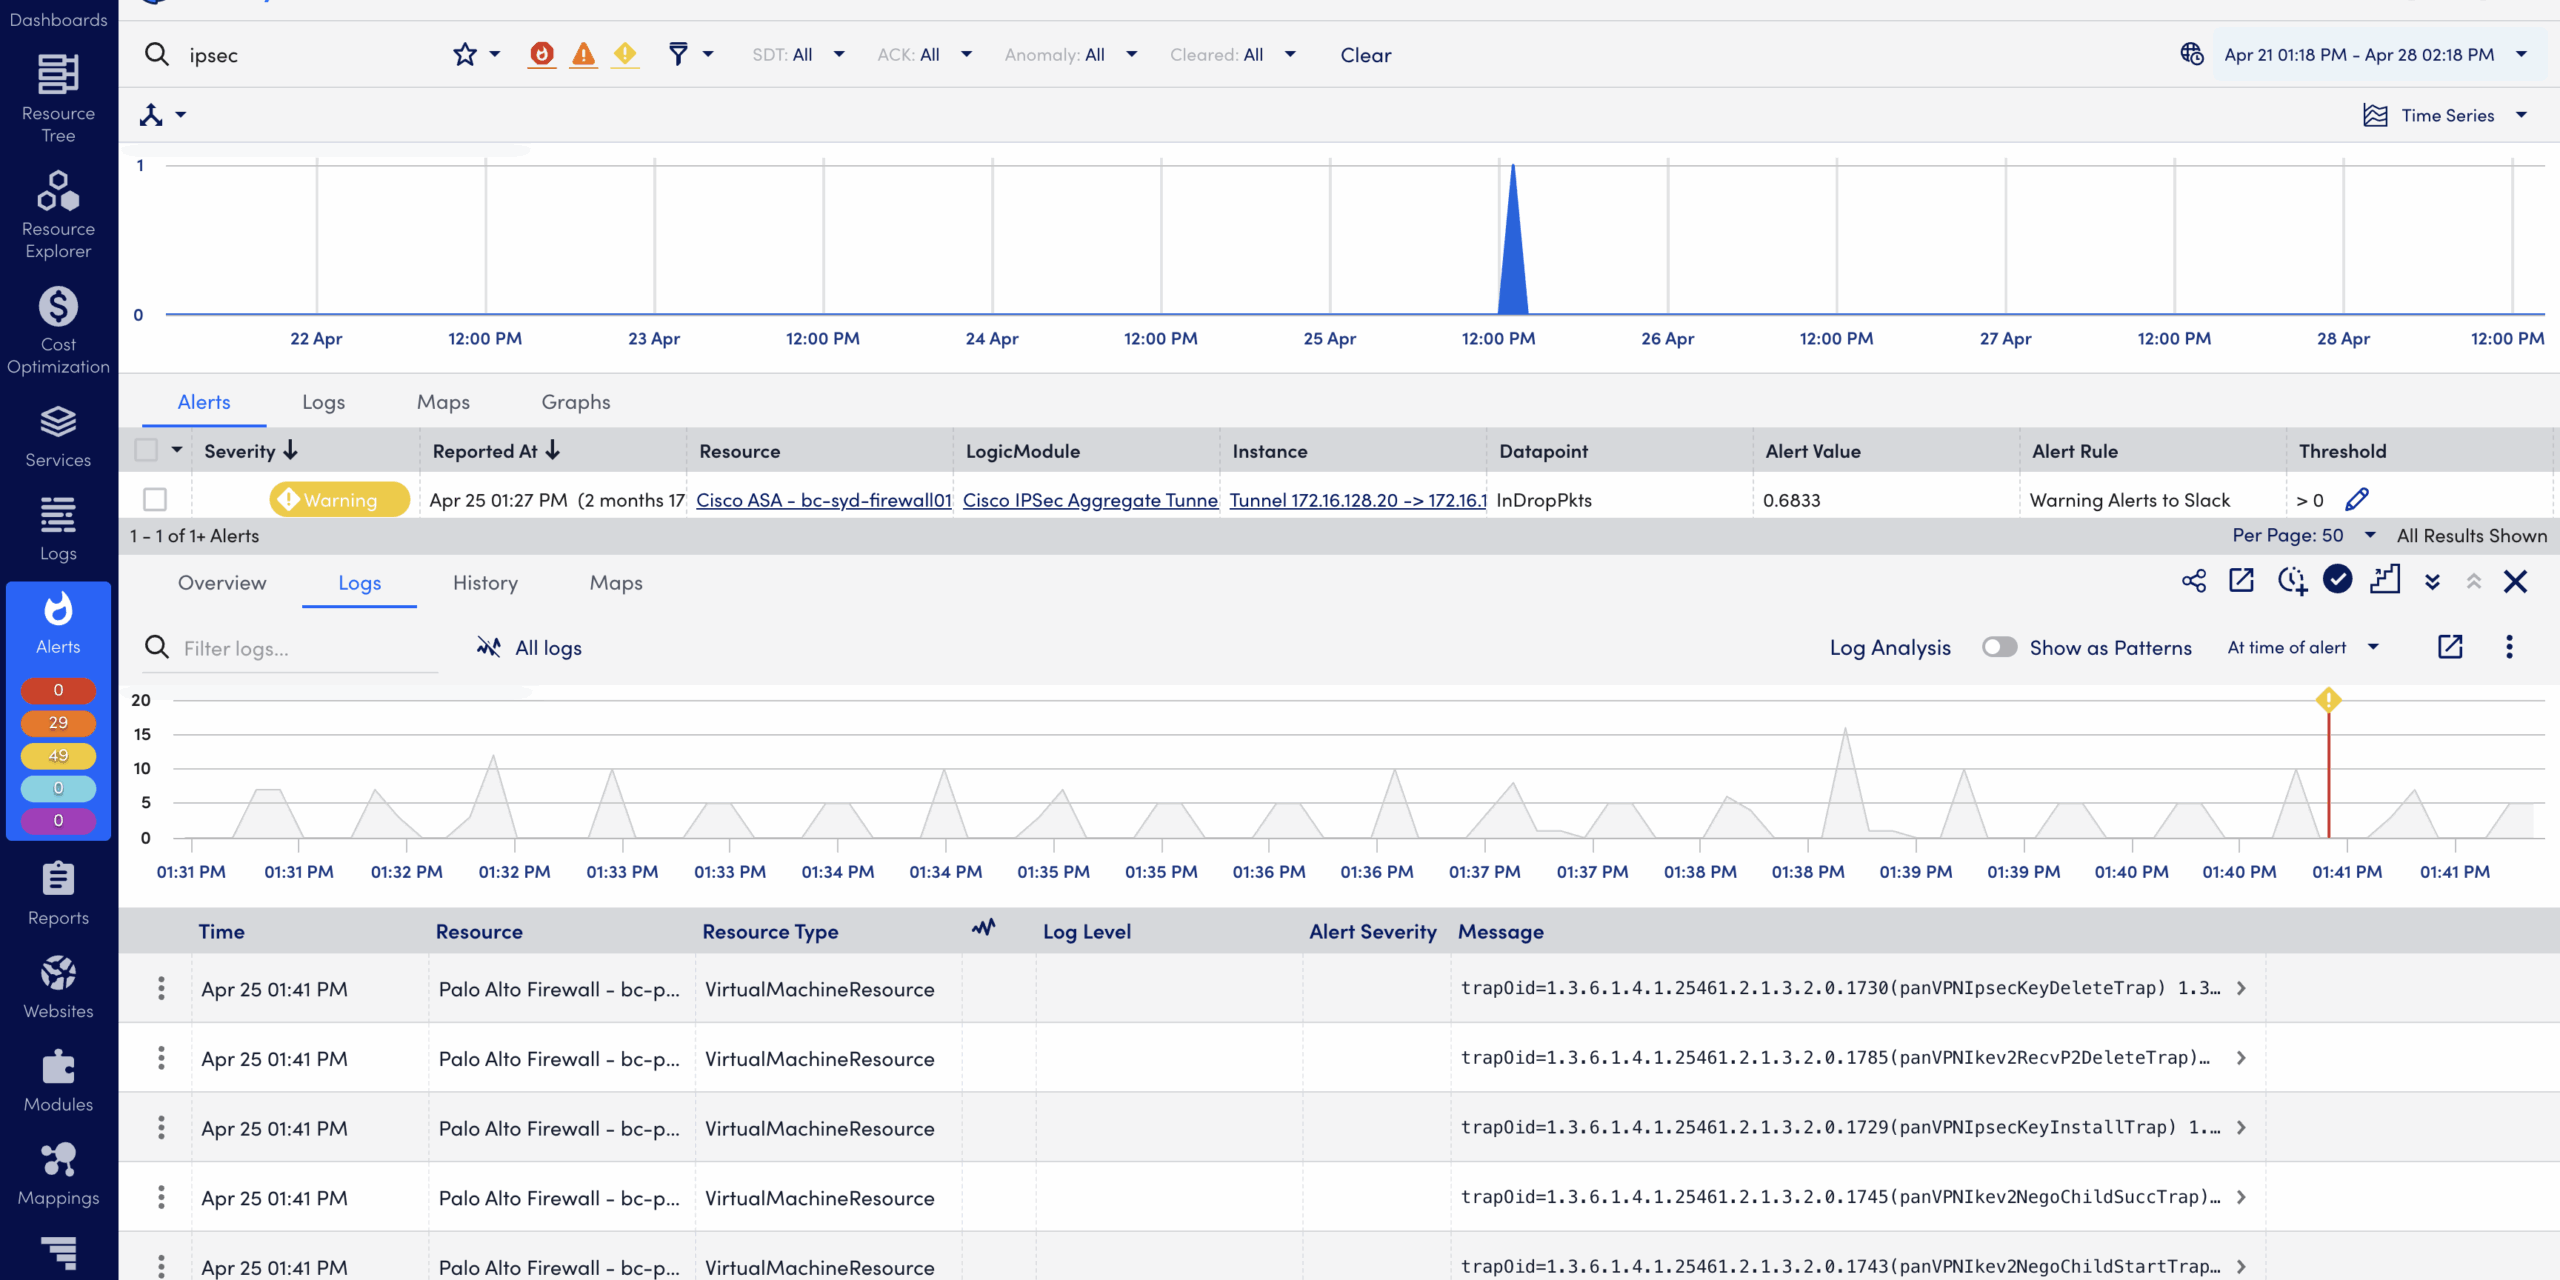
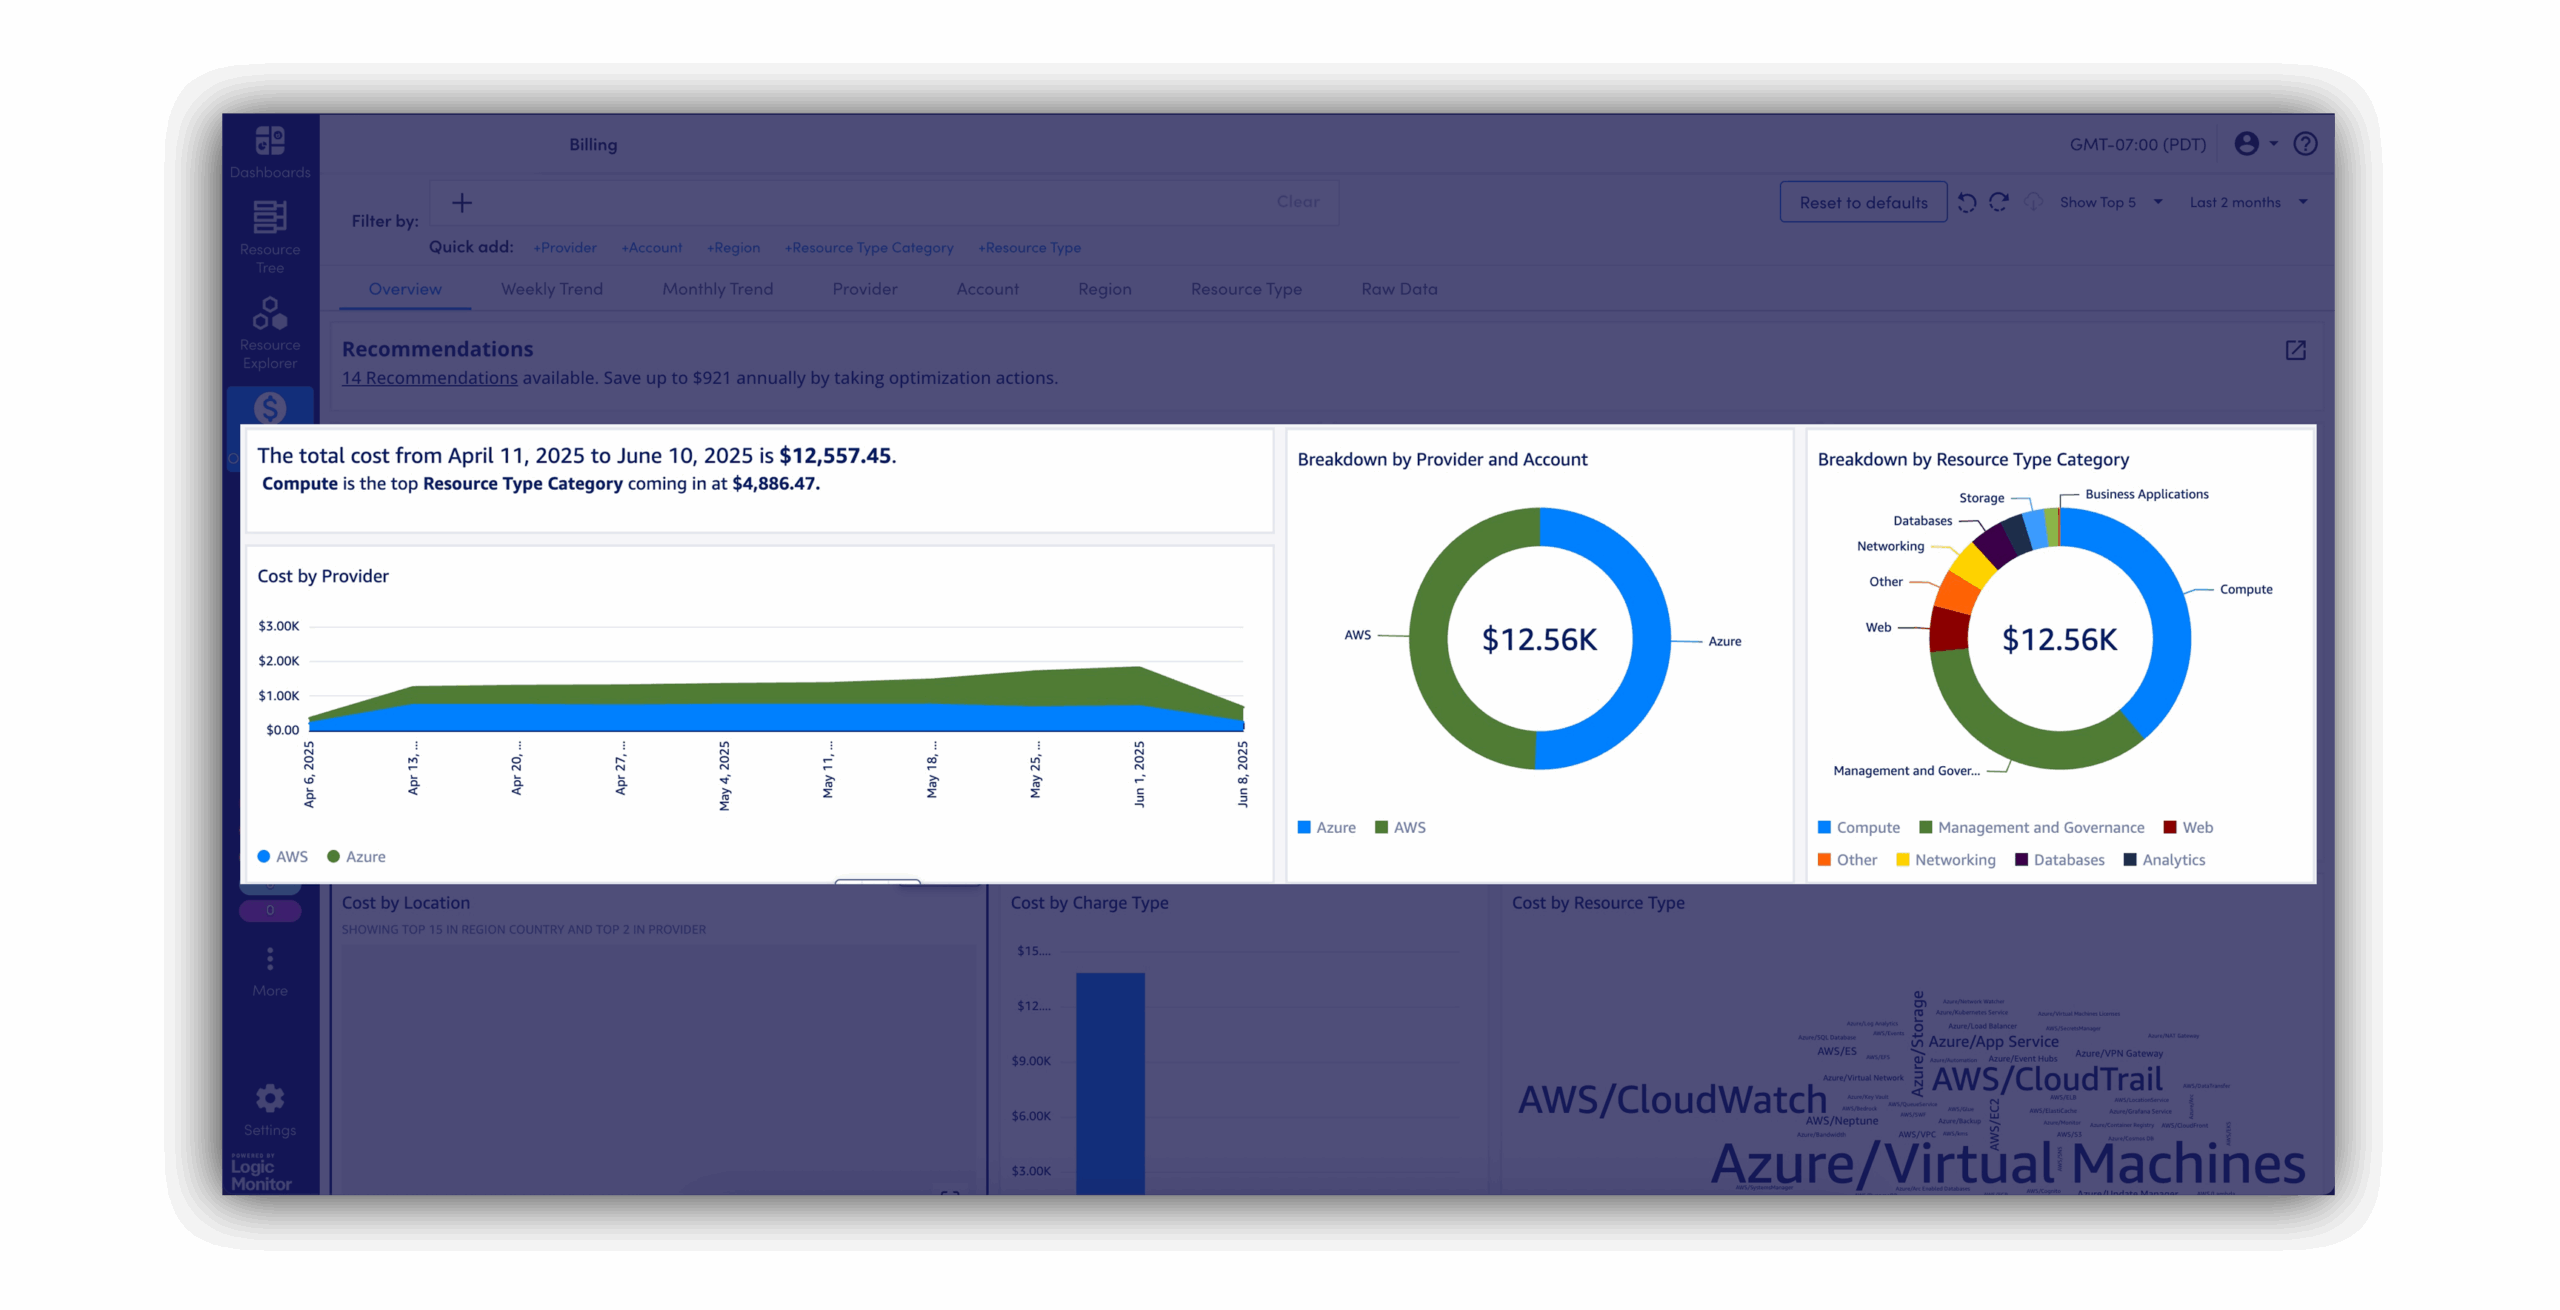
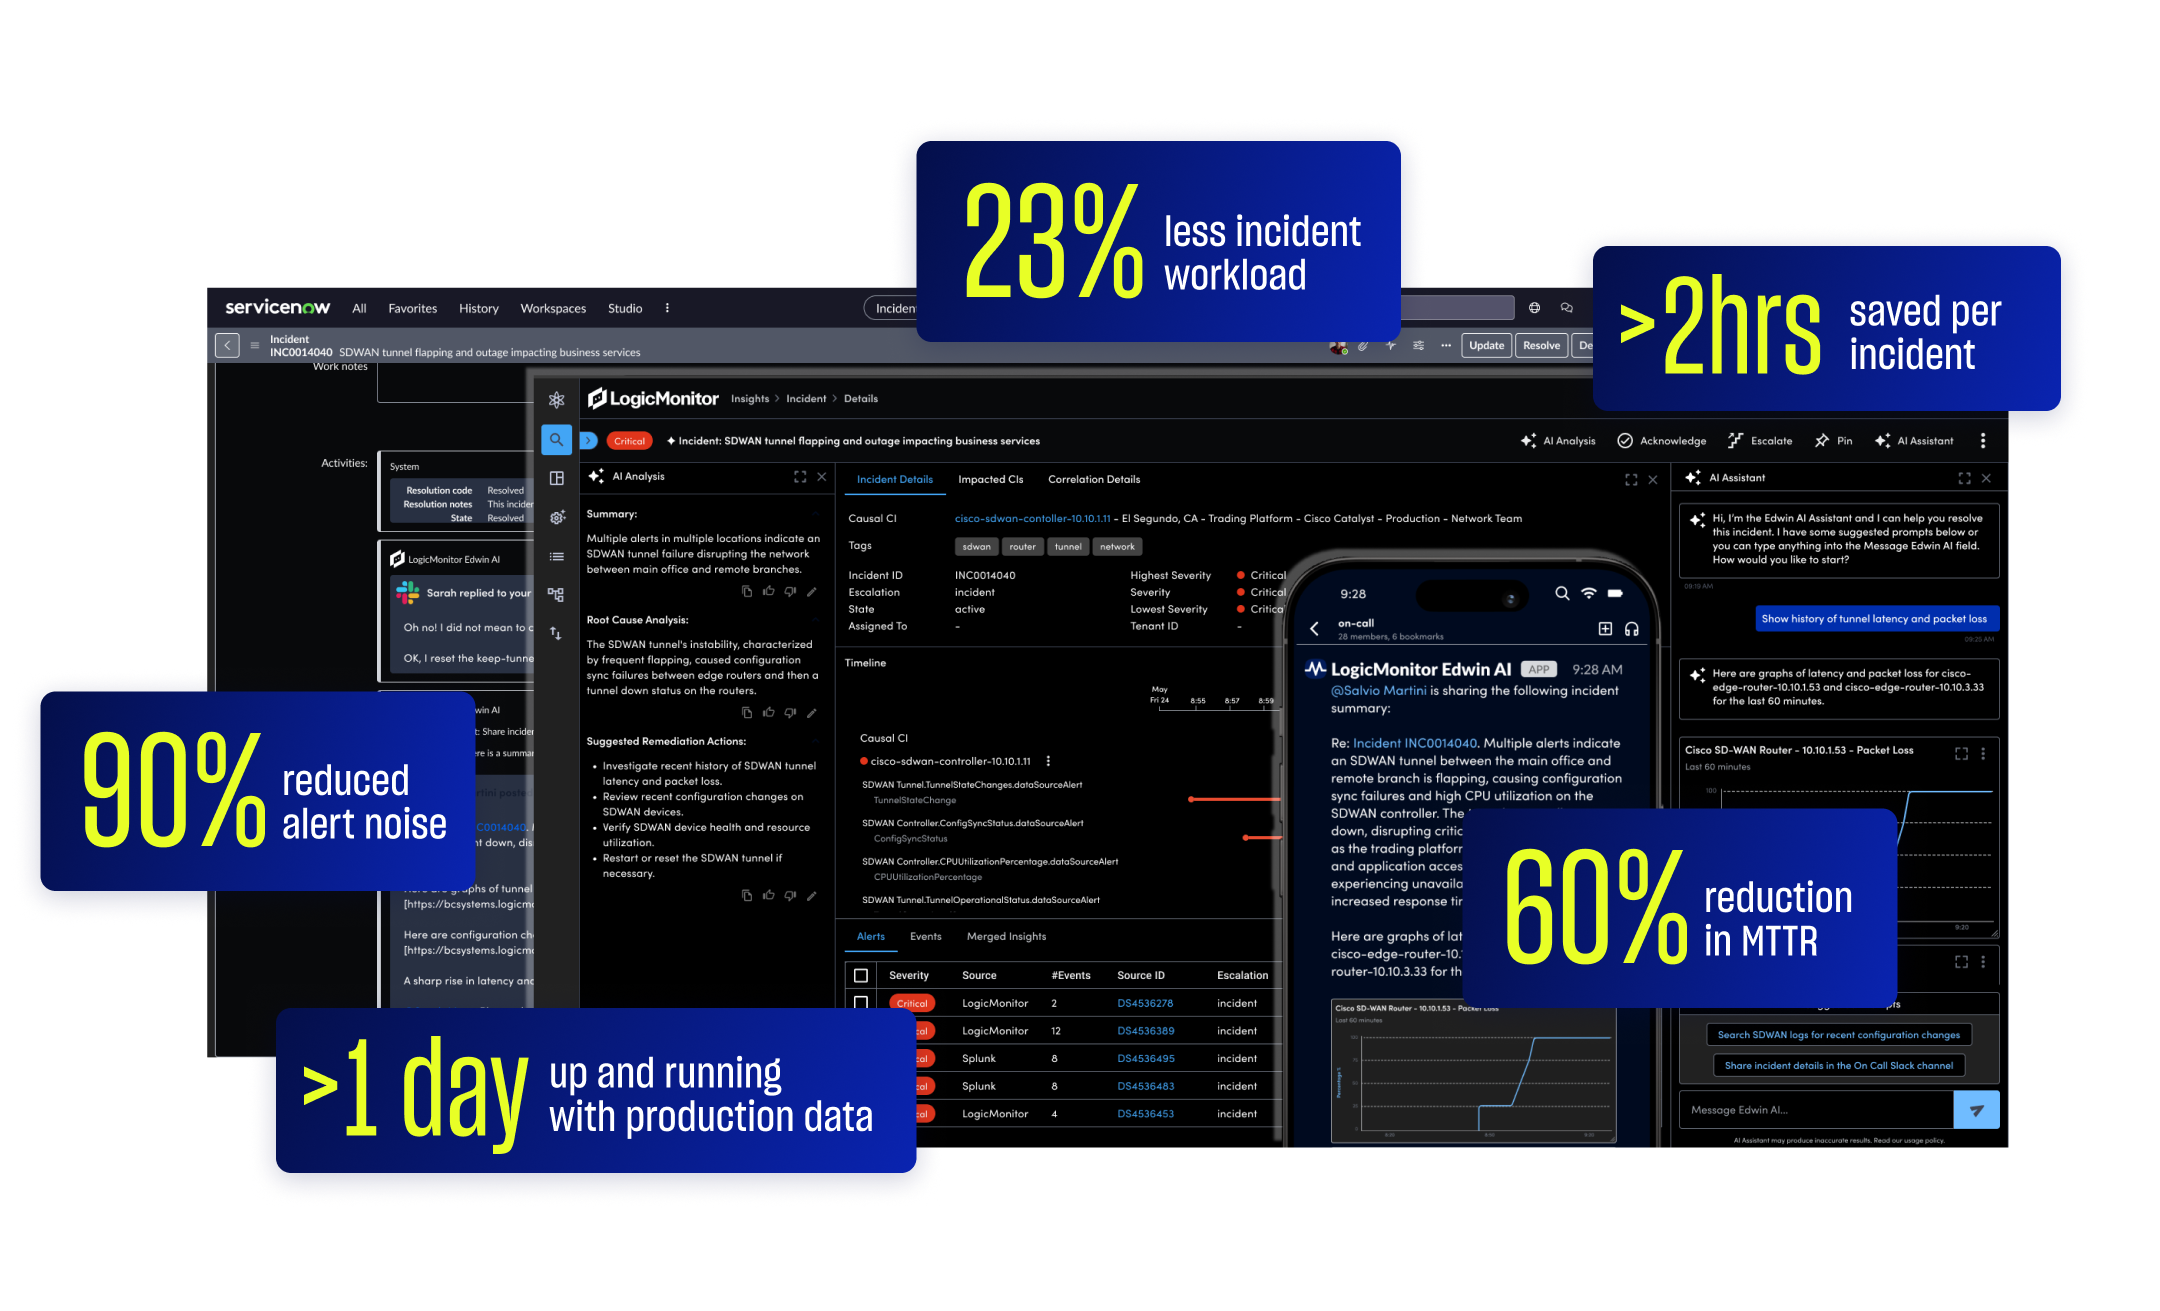
One Observability Platform. Total Stack Clarity.
Gain unified visibility across your entire technology stack, leveraging AI insights to proactively detect, resolve, and prevent issues before they impact your business and customers.

Trusted by Leading Companies


AI-POWERED OBSERVABILITY
Complete visibility and control across your entire stack
LogicMonitor Envision combines comprehensive observability with AI-driven intelligence across your infrastructure, apps, and cloud environments, so you can detect issues early, optimize performance, and ensure services run reliably.


Unified visibility without the overhead
Simplify operations with one intuitive platform that brings infrastructure, cloud, and apps into a single view—no more tool sprawl or data silos.
Resolve issues before they escalate
LM Envision uses AI-powered insights and real-time telemetry to detect problems early—so you can act before users or services are affected.


Optimize resources, cut waste
Track usage, spot inefficiencies, and forecast spend—so you can stay ahead of budget risks and scale smarter across hybrid environments.
Scale without limits
Auto-discover devices, services, and dependencies as your environment evolves. LM Envision grows with your infrastructure—no manual work required.


MAKE YOUR OBSERVABILITY SMARTER
Edwin AI: Agentic AIOps for Incident Management
Edwin AI helps you catch issues early, cut through noise, and resolve incidents fast. With built-in generative AI, it auto-correlates alerts, surfaces root cause, and gives step-by-step guidance to fix problems before customers ever notice.
Total Observability. One Platform.
Get complete visibility, focus on what matters most, and stay confidently in control of your environment.

Comprehensive Monitoring
All your telemetry. No blind spots.
- Cloud & Infrastructure Monitoring
Automatically collect high-frequency metrics from servers, containers, and cloud services, no manual setup required. - Application Performance Monitoring
Track latency, throughput, and error rates in real time to detect slowdowns before they reach your users. - Unified Log & Event Visibility
Bring logs and events into one platform to simplify analysis and accelerate incident resolution.

Dashboards & Visualizations
Turn data into insights, fast.
- Single Pane of Glass
View infrastructure, cloud, app, and network metrics alongside logs and events in one unified interface. - Prebuilt Templates
Launch with out-of-the-box dashboards that highlight critical performance and availability metrics. - Custom Dashboards
Tailor views for teams, services, or SLAs using drag-and-drop widgets and flexible filtering.

AI-Enhanced Alerting
Get alerted to what matters without the noise.
- Anomaly Detection
Use built-in machine learning to surface unusual behavior before users or services are affected. - Dynamic Thresholds
Set adaptive baselines that reduce alert fatigue and automatically tune to changing conditions. - Noise Suppression
Automatically group or suppress repetitive alerts so your team can focus on what’s important.

Root Cause Analysis & Correlation
Know exactly what’s happening and why.
- End-to-End Tracing
Link application requests to backend infrastructure to pinpoint the source of performance issues. - Service Dependency Mapping
Visualize how services connect across hybrid environments to understand downstream impact faster. - Real-Time Correlation
Combine metrics, logs, and events for a complete, contextual view of system behavior.

Cost Optimization & Capacity Planning
Use resources wisely and plan ahead with confidence.
- Resource Utilization Monitoring
Spot idle or underused infrastructure and eliminate waste without sacrificing performance. - Spend and Budget Dashboards
Break down infrastructure and cloud costs by team, service, or environment. - Forecasting & Alerts
Predict future resource needs and get alerted before usage exceeds budget thresholds.

Security & Compliance
Protect your environment. Stay audit-ready.
- Security Event Correlation
Detect threats faster by linking firewall logs, VPN activity, and traffic anomalies in one platform. - Audit Logging and Reporting
Capture changes, access logs, and system events to support compliance and governance initiatives. - Compliance Dashboards
Visualize SLA metrics and audit readiness with role-based reports tailored to your organization.
See What AI Observability Can Do for Your Stack
See how LogicMonitor helps you monitor your AI systems in one place. Your team can move faster with fewer surprises.
Frequently Asked Questions
- What is an observability platform?
An observability platform is a unified system that collects and correlates metrics, logs, and traces across infrastructure, applications, and cloud environments. It helps teams understand system behavior, quickly detect and investigate issues, and improve performance at scale.
- How is an observability platform different from traditional monitoring tools?
Traditional monitoring tools often silo visibility to specific components. Observability platforms provide context-rich, end-to-end insights by correlating diverse telemetry. This enables faster root-cause analysis and smarter decision-making.
- Can LogicMonitor integrate with my existing tools and cloud providers?
Absolutely. LM Envision offers built-in integrations with AWS, Azure, GCP, Kubernetes, ServiceNow, and hundreds more. You can get value without rearchitecting your stack.
- How fast can we get up and running?
Most customers see insights within days. With automated discovery, prebuilt dashboards, and minimal manual setup, LM Envision accelerates time to value.
- Is LogicMonitor a good fit for hybrid or multi-cloud environments?
Yes. LM Envision is purpose-built for complex, distributed environments including hybrid infrastructure and multi-cloud deployments. You get unified visibility no matter where your systems run.
- How does LogicMonitor support cost optimization?
LM Envision helps you right-size resources, identify inefficiencies, and plan capacity more accurately. This gives you cost control without sacrificing performance.