
whitepaper

This white paper will provide best practices for alert tuning to ensure two related outcomes:
1. Monitoring is in place to catch critical conditions and alert the right people
2. Noise is reduced and people are not needlessly woken up
These outcomes are essential to a successful monitoring strategy. What follows are some critical issues to consider when designing a new monitoring system or reviewing an existing system.
Components of a Monitored Item
Different monitoring solutions use different terminology to represent the items they monitor. Usually there is a hierarchical system that includes high-level groups such as a data center, and then lower-level groups and individual hosts below that. At the host level there will be monitoring categories such as disk, CPU etc., and below that specific instances to be monitored such as /dev/sda mounted at /.
Whatever the organization structure of your monitoring solution, each item monitored should have the following components defined:
• Metric: The measure being monitored, such as CPU percent used.
• Threshold: The definition of when the metric is considered to be in a less than optimal state.
• Alert Level: The level of urgency associated with a given state, usually warning, error or critical.
• Action to Resolve: The action items associated with the alert.
Failure to consider the above components when developing a monitoring solution will increase the likelihood of an alert system failure. Alert systems fail when they generate too much noise, which can result in staff missing or ignoring critical alerts, but they can also fail if they don’t catch critical conditions due to either a lack of flexibility, monitoring capability or bad configuration.
Setting the correct threshold when rolling out a monitoring system can be difficult. Good monitoring tools will have sensible defaults out-of-the-box, but these will have to be tuned over time. For example, CPU usage of 96% is not necessarily a bad thing for all systems, but it will be for some. Additionally, some monitoring tools provide the ability to automatically configure alert thresholds based on historical metric measurement. This offers a threshold baseline and ideally forecasts future issues based on threshold trends.
Alert levels also need to be tuned over time. Again, good defaults can help but a warning alert on one set of systems could be critical alert on others.
One of the most commonly overlooked requirements leading to alerts being ignored is the need to define action items. Good monitoring solutions will have reasonable default descriptions that indicate what may be the cause of a particular condition. In my preferred monitoring solution LogicMonitor, we see the following message associated with an alert on CPU usage:
“The 5 minute load average on server123 is now 99, putting it in a state of critical. This started at 2016-05- 11 11:38:42 PDT. See which processes are consuming CPU (use ‘ps’ command to see which processes are in runnable and waiting state; ‘top’ command will show individual cpu core usage). Troubleshoot or adjust the threshold.”
As a default message this is pretty useful. It tells the recipient the basic steps for troubleshooting. These messages can be customized for known situations such as high traffic requiring more application servers to be added to a cluster. Avoid implementing monitoring alerts that have no actionable responses. This just adds noise and increases the frustration of those receiving the alerts.
Avoid Alert Spamming
Too many alerts going off too frequently creates alert spamming or what is sometimes referred to as an Alert Storm. This is extremely dangerous and can have many adverse consequences, such as a failure of system monitoring. Too many alerts can result in real critical issues going unnoticed. Too many alerts can also lead to critical alerts being accidentally disabled in an effort to cut down the noise. Every alert must be meaningful and have an associated action.
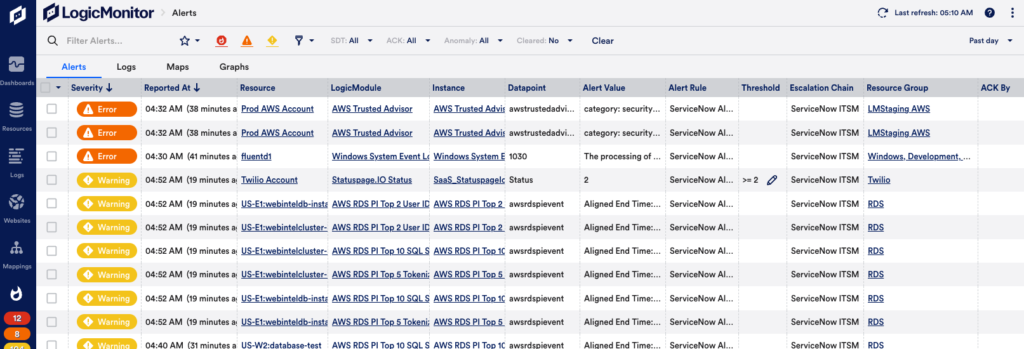
Correctly routing alerts is also important. If the action item is to call someone else then the alert is not meaningful. Don’t turn your admins into receptionists! This is particularly important when working in a DevOps culture where you have developers on-call and different teams responsible for different systems. Take into account that certain metrics will indicate a problem at the application layer and developers are best placed to resolve the situation, but problems that relate to the database should be handled by the DBA. While it makes sense for your operations people to be the first line for system failures, if their only action item is to call a developer or a DBA, this can quickly become demoralizing. Similarly, if a developer is woken up for what is obviously a system failure, this can also be a problem. There will always be situations where one team has to escalate to another, but these should be the exceptions rather than the norm. In LogicMonitor, you can avoid alert spamming by setting up custom escalation chains and alert rules that route alerts to the right people when an issue occurs.
Managing Downtime
Your chosen monitoring solution should have fine-grained control for setting downtime. This can range from disabling all alerts during a full downtime deployment, to controlling individual hosts and monitored instances for ongoing maintenance.
For example, a fine-grained approach to downtime will allow you to set downtime for a single hard drive on a given host. If you are inadvertently alerted for a host that is not currently in production you may decide to disable all metrics but still want to ensure that the host is up and responding to network pings. Additionally, disabling all monitoring for a host may be desirable. For example, if a host has been removed from a production cluster but not fully decommissioned you could decide you may not need to monitor it.
Host groups are useful for managing groups of related systems. For example a dev, QA and production group gives a good high-level organization for managing downtime because during QA deployments you may decide to disable all hosts in the QA group. For automated deployments, a good monitoring system will provide an API to allow automation tools to specify downtime. For scheduled maintenance, the monitoring solution should allow you to schedule repeatable maintenance windows in advance.
Downtime should be scheduled at the most granular possible level. If you are increasing the size of a disk for example, don’t set the entire host to downtime. If you know it will take you 24 hours to fix the issue, schedule 24 hours of downtime. Downtime should expire automatically to avoid forgotten settings.
Missed Alerts
Even the best monitoring systems will occasionally result in system failures that go undetected. This is obviously bad at any time, but particularly after replacing one monitoring system with another. No one remembers the thousands of false alerts produced by your home-rolled Nagios when your shiny new SaaS system misses a production down incident.
To counter the skepticism this will inevitably introduce towards your new system, it is essential to have good “blameless” post mortem practices in place for every outage. A useful checklist of questions to ask in such postmortem include the following:
- What was the root cause of the failure?
- What state were the systems in prior to the failure?
- How much CPU was consumed, how much memory?
- Were we swapping?
- Were there alerts that should have triggered?
- Were the thresholds correct?
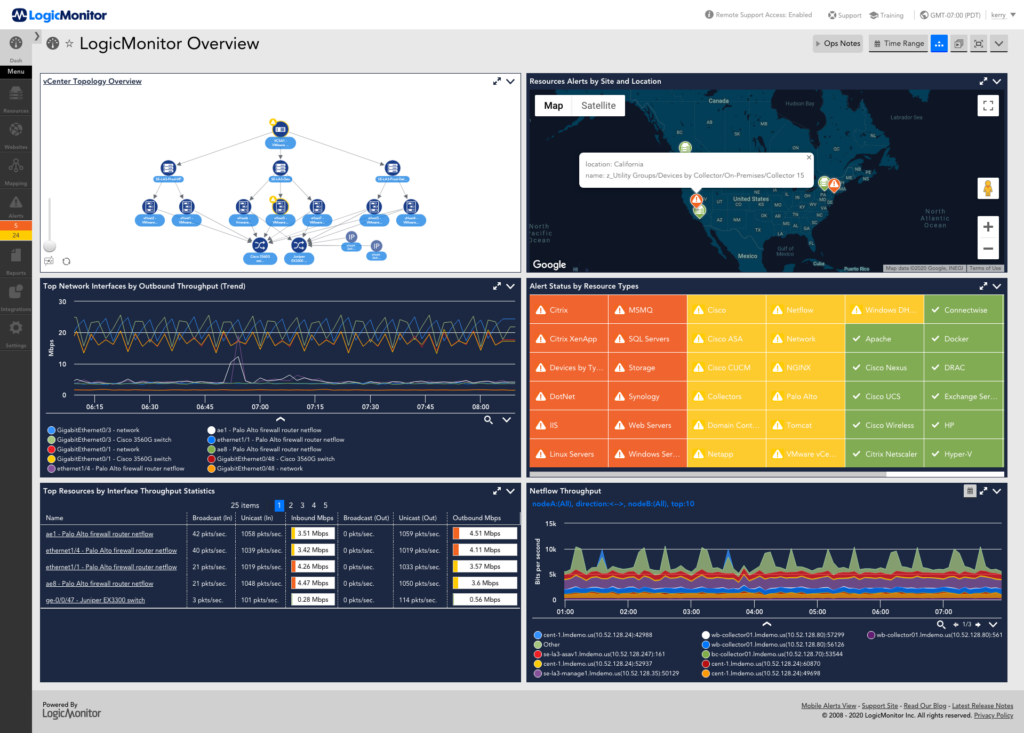
Data graphing should assist with this. Compare the graphs under normal system usage with those just prior to the system failure. With LogicMonitor, you can do this by building dashboards that display relevant graphs and metrics across your entire infrastructure. After discussing all of the above the next set of questions you need to answer relate to what we can do to prevent this in the future. It is essential that the issue is not marked as resolved until monitoring is in place to prevent a repeat.
Avoiding Email Overload
Most places I have worked go to great lengths to prevent false alerts that could potentially page people and wake them up in the night. However, email alerts are often another story. Some companies will allow thousands of email alerts to go off for warning level situations that are often self corrected, when other warnings may be useful, such as disk usage warnings that can allow a systems administrator to take action to prevent an alert reaching critical and waking someone during the night. Unfortunately, it is not realistic to manually scan a thousand emails for something that may actually be useful. Good monitoring tools like LogicMonitor provide dashboards to indicate alert status.
Alert Forecasting
If you want to take your alert strategy to the next level you should add alert forecasting to the mix. Standalone alerts can notify you of specific changes in metrics, but alert forecasting gives you the ability to predict how that metric will behave in the future. Forecasting also enables you to predict metric trends and know when an alert will reach a designated alert threshold.
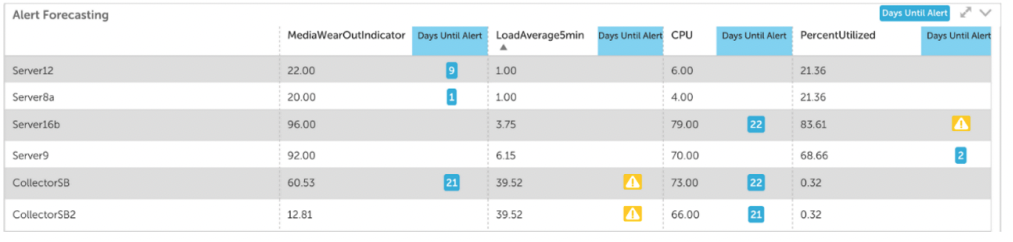
With this information, you can prioritize the urgency of performance issues, refine budget projections, and strategize resource allocation. Some useful examples of alert forecasting are predicting when a disk will be at 95% capacity and predicting your total monthly AWS bill. LogicMonitor includes alert forecasting and you can use it to predict alerts for up to three months in the future.
Reporting
Good reporting can help with the email overload situation described above. One valuable recommendation I received from a LogicMonitor training session was to generate a nightly report for all warning level alerts and disable alert delivery. Admins can then check the morning report and address any warnings to prevent them escalating to error or critical levels.
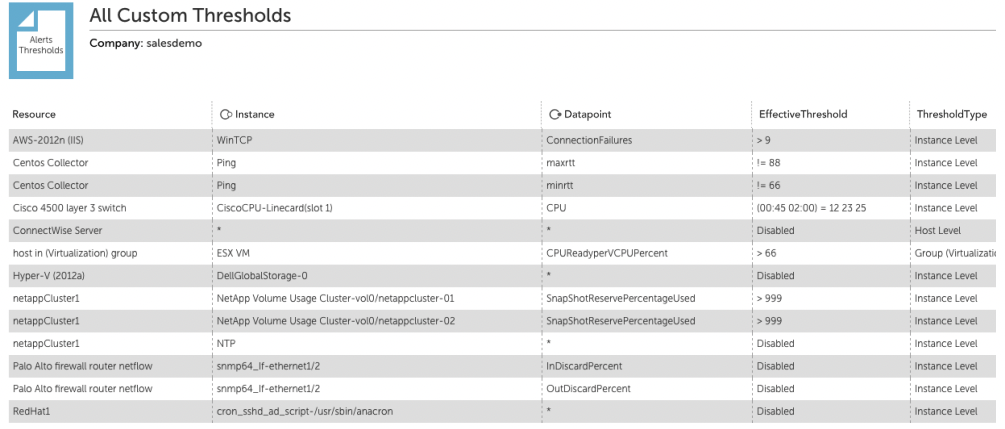
Another helpful report is a report of all the alert thresholds. This is useful for checking the currently set thresholds, but most importantly will show any disabled thresholds. One of the common responses to excess noise in alerting is disabling alerting for a metric or even an entire hosts. This is often done with the intention of addressing the issue in the morning, but often higher priorities can intervene and it will be forgotten until there is some catastrophe that isn’t alerted on.
Conclusion
Modern monitoring solutions can provide a robust infrastructure monitoring framework that can both alert when necessary and avoid alert overload. It is important to realize, however, that even the best tools require careful implementation and ongoing tuning and improvement. This is not only the responsibility of the operations people maintaining the monitoring systems. As new features are designed, careful thought should be given to how they will be monitored. What metrics indicate the normal functioning of the application or the overall system? What are the acceptable thresholds for a given metric? At what point should we be warned and what do we do to prevent the warning escalating to a critical situation.
The complex nature of web and SaaS platforms today means that monitoring cannot be seen as something which operations teams apply to production infrastructure. It requires cross-team collaboration to ensure we are monitoring the right things and alerting the right people. This is the key to a successful monitoring strategy.
LogicMonitor’s unified monitoring platform expands possibilities for businesses by advancing the technology behind them. Sign up for a 14 day free trial.
Want a free copy of this whitepaper?
Updated November 2022. Originally Posted May 27, 2016. Also Updated 2019.
