Internet Performance Monitoring (IPM) provides end-to-end visibility into what happens between your infrastructure and your users, across networks and services you don’t own or control.
Most monitoring tools tell you whether your systems are up. IPM helps you validate whether they’re actually reaching people, on their network, in their location, right now.
Catchpoint’s Global Agent Network, part of the LogicMonitor platform, is independent from your cloud hosting, which means when your provider goes down, your visibility doesn’t go down with it.
The difference between availability and reachability sounds subtle until an outage hits users in one region and your dashboards show everything green.
If your monitoring stops at your own infrastructure, you’re only seeing half the picture. IPM monitors the other half.
If your monitoring stops at your own infrastructure, you’re only seeing half the picture. IPM monitors the other half.
The internet is your network now. Your apps live in the cloud, your users are everywhere, and the systems that deliver your applications and services to them use hundreds of providers, ISPs, and networks beyond your control.
In practice, that means infrastructure monitoring is the foundation. You also need visibility into everything beyond your perimeter. Internet Performance Monitoring (IPM) extends that visibility across the entire delivery path from your systems to your users, through every layer in between.
Watch a walkthrough of how Catchpoint’s IPM monitors from real‑user vantage points and surfaces composite experience, Core Web Vitals, and AI‑identified events in a single view, or keep reading to learn more.
Where Your Users Actually Are
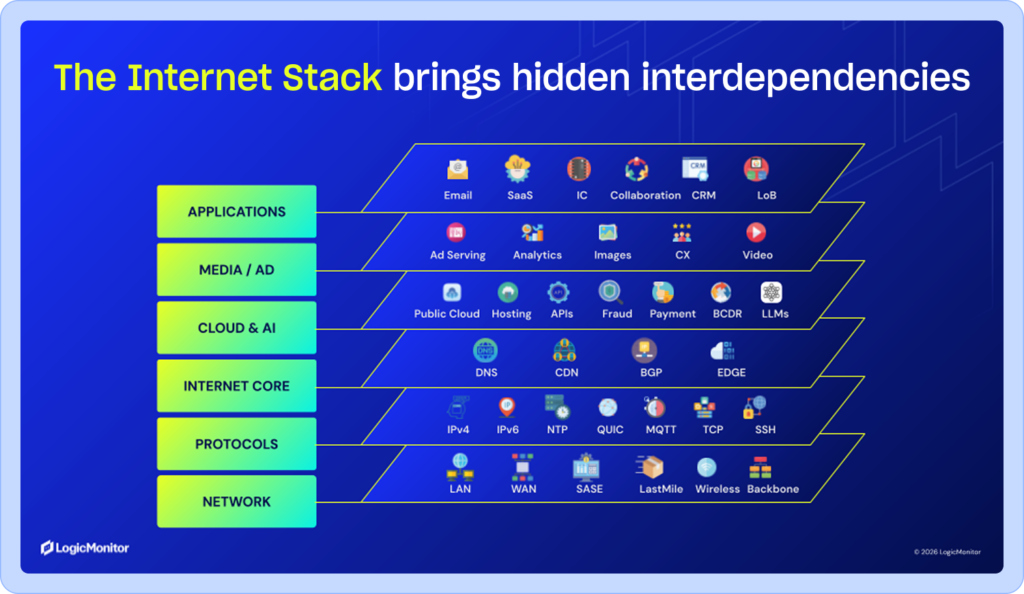
APM tools are useful for monitoring what happens inside your stack, but they lack visibility of the full internet stack between your infrastructure and the person trying to load a page, sign in, or complete a transaction. Your internet stack includes the paths and services users rely on to reach your applications, such as BGP, DNS, CDNs, backbone ISPs, wireless networks, last-mile connections, and edge locations.
IPM provides visibility into each layer of the internet stack, giving teams a clearer view of the conditions users experience when they access digital services. So when performance suffers, or an outage hits, that visibility is what determines whether you’re looking at your problem to fix or someone else’s.
What IPM Monitors, and Why It Matters
Most monitoring tools ask one question: Is it up? IPM asks a different question: whether your systems are actually reaching people at all.
That’s the difference between availability and reachability. Availability shows whether a system responds. Reachability indicates whether users can access it through the networks they use.
That distinction matters for customer-facing services, employee tools, ecommerce flows, SaaS applications, and APIs. A service can be running while DNS resolution, ISP routing, CDN behavior, or a third-party dependency creates friction for users.
IPM helps teams move from suspicion to evidence. When a payment API slows down, DNS resolution spikes, or a provider route introduces latency, IPM surfaces that evidence at the affected layer of the internet stack rather than leaving teams to guess where in the delivery path things broke down.
The World’s Largest Active Monitoring Network
LogicMonitor, via Catchpoint, runs the world’s largest active monitoring network, and where you monitor from matters more than most people realize. If you only monitor from the same cloud infrastructure where your applications are hosted, you create an inherent conflict of interest with visibility. When that infrastructure experiences an outage or degradation, your monitoring is subject to exactly the same conditions.
Catchpoint addresses this by monitoring backbone ISPs, wireless carriers, last-mile networks, and edge nodes that are entirely decoupled from your hosting environment, so you see it clearly when something degrades upstream or downstream of your infrastructure, rather than losing the signal at the moment you need it most. This keeps outside‑in validation running even when internal telemetry looks healthy.
What You Can See With IPM
IPM gives you a unified view of performance across your entire internet stack. From a single dashboard, you can track:
Composite Experience Score: an at-a-glance read on how your users are experiencing your product
Uptime and availability metrics: is it up, and for whom
Web performance metrics: load times, response times, and request paths
Visual display metrics: how the page actually renders in the browser
Core Web Vitals: the signals that affect both user experience and search ranking
AI-powered event identification: surface anomalies without wading through noise
For deeper investigation, filmstrip views and detailed waterfall data let you trace exactly what happened during an individual test run step by step. Beyond the core dashboard, Catchpoint IPM includes customizable dashboards, test management, instant tests, scheduling, alerts, and integrations so it fits into the workflows your team already uses.
How Internet Performance Monitoring Supports the Move Toward Autonomous IT
Autonomous IT runs on a closed loop: detect signals, understand what is affected, decide what should happen next, take governed action, and verify that the action worked. Each step depends on the quality of the data behind it.
Internet performance monitoring strengthens that loop by adding evidence that internal telemetry can’t provide on its own. For example, what happens between the user and the service, across the internet paths and third-party dependencies outside your own infrastructure. Together, LM Envision, Catchpoint, and Edwin AI give teams the visibility, context, and governed action needed to operate with more confidence across the full digital environment.
See Internet Performance Monitoring In Action
Learn how LogicMonitor uses Catchpoint to extend visibility across digital experience, external dependencies, and Internet performance as part of one connected Autonomous IT system.
IPM is an outside-in approach to monitoring that shows what happens between your infrastructure and your users across the Internet paths, providers, and dependencies your services rely on but do not control. It complements traditional observability by adding evidence from the full delivery chain, so teams can see whether issues start in their own stack, with a dependency, or somewhere in the Internet itself.
How is IPM different from APM or traditional infrastructure monitoring?
Infrastructure and APM tools focus on what happens inside your systems, such as servers, services, and application code. IPM focuses on reachability and experience across the Internet stack—DNS, BGP, CDNs, ISPs, last-mile networks, and edge locations—so you can tell whether users in specific regions or networks can actually reach a service even when internal dashboards look healthy.
Why does “reachability” matter if my services are already highly available?
Availability tells you whether a system responds; reachability tells you whether users can access that system over the networks they use in real life. Teams often see incidents where everything is “green” internally while users in one geography or ISP see timeouts or failures, and IPM closes that gap by revealing where along the Internet path things are breaking.
Where does Catchpoint monitor from, and why does that matter?
Catchpoint’s global agent network runs active tests from backbone ISPs, wireless carriers, last-mile networks, and edge locations that are decoupled from your hosting providers. That independence means your visibility does not disappear during a cloud or provider outage, and you can quickly see whether problems are upstream, downstream, or inside your own environment.
How does IPM support Autonomous IT with LogicMonitor?
Within the LogicMonitor platform, IPM data feeds the Autonomous IT closed loop by adding real-world Internet performance and digital experience evidence into detection, diagnosis, decision-making, and verification. LM Envision provides internal telemetry, Catchpoint extends visibility to user experience and Internet performance, and Edwin AI uses that combined context to guide governed action during incidents.