Network Monitoring Best Practices: A Guide for Modern IT Teams
Network monitoring best practices help you see what’s connected, what normal performance looks like, and when behavior starts to drift. This guide covers the core steps to spot issues early and respond with confidence.
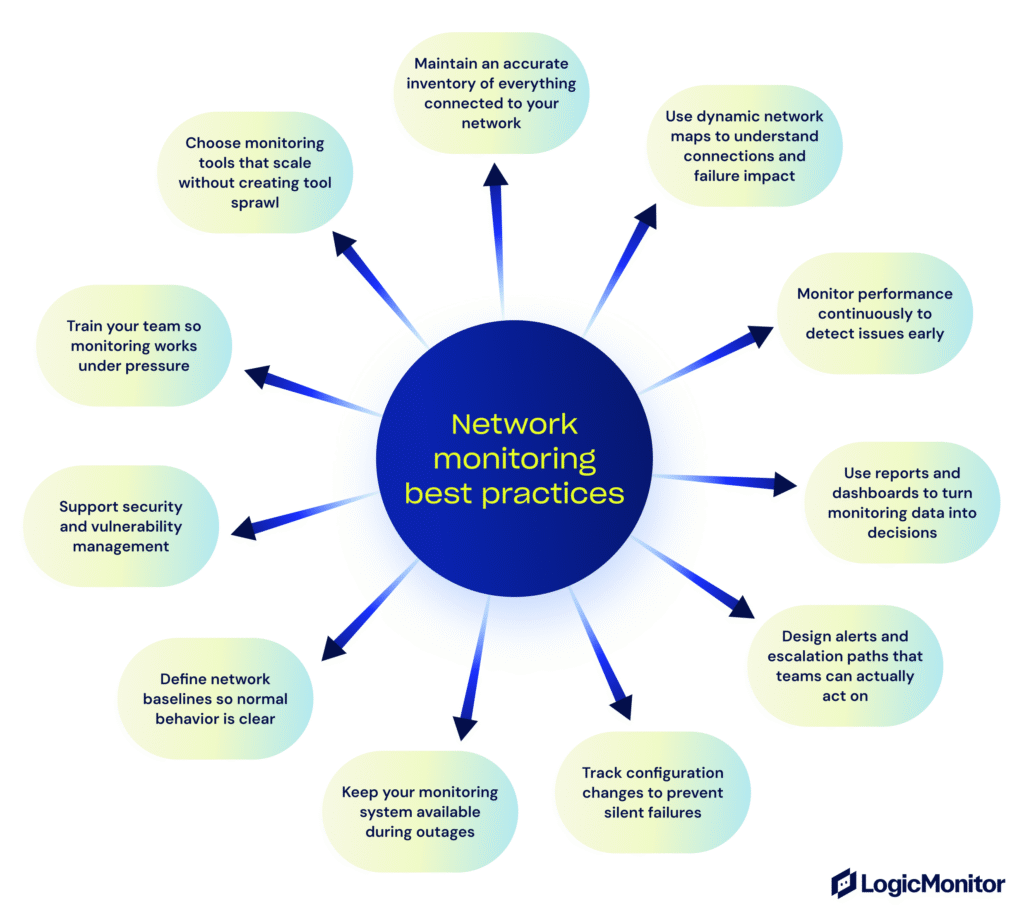
Network monitoring best practices help you understand what is connected, how it performs, and when behavior deviates from expected norms.
Discovery and dynamic topology mapping create visibility, while baselines define what normal looks like, so problems stand out early.
Component-first alerts miss the service story, so it’s hard to tell what customers can’t do and what to fix first
Monitoring, alerting, and reporting work together to surface issues, explain trends, and drive action without noise.
Reliable monitoring depends on configuration control, high availability, security integration, the right tools, and trained teams that know how to respond.
Network monitoring best practices are the core disciplines IT teams use to keep networks healthy, reliable, and predictable as they change.
Most network problems don’t appear all at once.
Instead, a device gets added, traffic gradually increases, or a small configuration change affects something downstream. When those changes aren’t visible or well understood, they compound and surface later as performance issues or downtime.
In this guide, we’ll walk through the core best practices behind effective network health monitoring, network device monitoring, and alerting, so you can build visibility that actually helps when something goes wrong.
Core Network Monitoring Best Practices
Let’s explore the fundamental practices that provide the visibility and context needed to understand what’s happening on your network and why.
Maintain an Accurate Inventory of Everything Connected to Your Network
Discovery is the starting point for network monitoring. If you don’t know what’s connected to your network, it’s impossible to monitor performance or reliability in a meaningful way.
That’s why you need to create and maintain an accurate inventory of all connected devices so network health monitoring is based on facts, not assumptions.
Here’s how to do it:
List everything that sends or receives traffic on your network. Don’t limit this to core infrastructure like routers and switches. Any device that communicates on the network can influence performance, reliability, or troubleshooting.
That typically includes:
Servers
Laptops and workstations
Printers
Mobile phones and tablets
Internet of Things (IoT) devices, such as cameras or sensors
Cloud-connected systems and services (e.g., AWS EC2, Azure VMs, SaaS apps)
For each device, capture only the details you’ll actually use during an issue:
IP address
Device name
Device type
Location
With this information, you can quickly identify what’s involved when performance drops or traffic spikes without first having to figure out what exists on the network.
Automate Device Discovery to Keep Your Inventory Current
As networks grow and change more frequently, keeping a device inventory accurate manually is unrealistic. This is where automated network discovery works best to keep asset data current without constant manual effort.
It uses monitoring tools with scheduled scans and passive monitoring to detect devices and changes across the network. Instead of relying on periodic audits, discovery runs at regular intervals in the background to identify what’s connected, what’s new, and what’s no longer active.
Most tools do this using a mix of active and passive techniques:
Passive discovery complements this by analyzing traffic flows using data like NetFlow, sFlow, or IPFIX records to identify devices based on how they communicate, even if they don’t respond to direct queries.
Validate Discovery Results to Catch Unknown and Unauthorized Devices
Automated discovery shows what’s reachable and responding on the network, but it can’t explain intent, ownership, or whether a device is authorized to be there.
However, manual verification means reviewing discovery results and validating them against what IT expects to see. This helps teams catch devices that don’t respond to scans, assets that were added outside formal processes (shadow IT), and inventory entries that are outdated or no longer relevant.
Here’s how it usually works:
You review newly discovered or changed assets regularly to confirm a few key things:
Ownership: Who owns the device
Purpose: Why it exists
Lifecycle status: Whether it’s still needed (active, retired, or should be decommissioned)
Traffic analysis often surfaces systems that automation alone can’t classify, such as devices that generate traffic but don’t match any approved records.
How Discovery and Asset Inventory Still Work When Assets Are Short-Lived, Cloud-Based, or Hybrid
Not all network-connected assets are persistent or easily trackable through manual processes. In cloud and hybrid environments, resources like containers, ephemeral VMs, or serverless functions can spin up, generate traffic, and terminate, all within minutes before anyone manually records them.
Discovery needs to account for this.
Your monitoring platform should pull asset data directly from cloud platforms and observe virtual network traffic to detect short-lived workloads, gateways, and services as they come and go. Without this, inventories may quickly fall out of sync, and traffic patterns become harder to explain.
To keep discovery helpful in these environments, asset inventories should update automatically as cloud and hybrid resources are created, scaled, or removed. This ensures visibility doesn’t depend on how long a system exists, but on whether it impacts the network while it’s running.
Use Dynamic Network Maps to Understand Connections and Failure Impact
Network mapping shows how discovered devices connect to each other and how traffic actually moves between them. Topology visualization turns that information into a visual map, so you can see paths, dependencies, and shared infrastructure instead of inferring them from a device list.
You need this because an inventory only tells what exists. It doesn’t show how failures spread. Without a clear topology view, you may troubleshoot the wrong components and waste time tracing traffic manually when performance drops or a device fails.
So, the best practice is to rely on dynamic, dependency-aware network maps instead of static diagrams.
Why?
Because static diagrams fall out of date quickly and don’t reflect how traffic flows in real environments. But dynamic mapping updates automatically as devices are added, removed, or reconfigured, which is quite important in hybrid and cloud environments as network paths change frequently.
You should also make sure your maps surface shared dependencies.
For example, a topology view might show that multiple applications or network paths rely on the same switch or firewall. When you can see that relationship upfront, you can spot single points of failure early and reduce risk before an outage forces the issue.
Monitor Performance Continuously to Detect Issues Early
Once a network is discovered and mapped, monitoring is how you keep it stable over time. This is where network health monitoring moves from visibility into early detection and faster resolution.
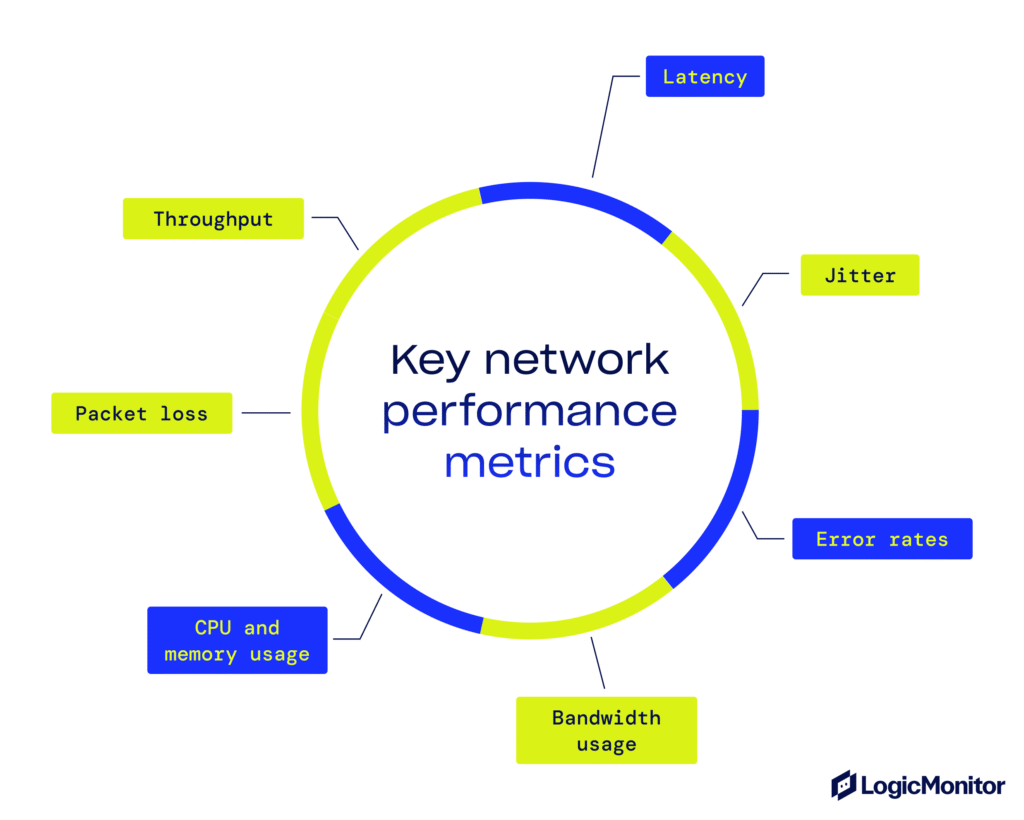
Focus on Metrics That Reveal Network Health Early
You don’t need to monitor everything equally. Some metrics consistently signal trouble before users notice it, so make sure to monitor these:
Latency is the time it takes for data to travel from the source to the destination. When latency rises, it often signals congestion or routing issues.
Jitter captures the variation in delay between packets. Even if average latency looks fine, delay can cause choppy voice calls, frozen video, and unstable connections.
Error rates show whether packets are being dropped or corrupted. These errors usually indicate hardware problems, bad cables, or misconfigured interfaces.
Bandwidth usage shows how much capacity is being consumed.
CPU and memory usage show if the devices can keep up with the workload and prevent performance issues.
Packet loss shows when data packets fail to reach their destination, causing retransmissions or service disruption. This happens due to faulty hardware, overloaded links, or configuration issues.
Throughput measures how much data is successfully delivered over the network in a given period. Unlike raw bandwidth, throughput reflects real performance.
Establish Baselines So Anomalies Stand Out Quickly
Raw metrics are hard to interpret without historical or environmental context. So, establish baselines that define what “normal” looks like for your network, including expected peak usage and acceptable variation.
Once baselines are set, monitoring tools can flag anomalies—patterns that fall outside normal ranges, such as:
Unexpected traffic spikes outside peak hours or unrelated to scheduled events
Rising error rates beyond historical baselines for similar traffic volumes or device loads
Sudden latency increases on previously stable services
They are easier to catch early when you’re comparing against historical behavior instead of fixed thresholds alone. This even helps move from reacting to alerts to spotting issues before they escalate.
Correlate Signals Across Layers to Find Root Cause Faster
Since network issues rarely exist at a single layer, effective monitoring looks across hardware health, protocol behavior, and traffic patterns in parallel.
This cross-layer correlation helps connect symptoms to root causes.
For example, slow application performance may trace back to interface errors, packet loss on a congested link, or routing delays upstream.
Without correlation, you may chase surface-level symptoms instead of addressing the underlying issue.
Flow data and packet-level analysis add another layer of context.
Traffic analysis shows who is talking to whom, how often, and how much data is moving. This explains why a link is congested or which traffic patterns are driving load, not where the problem appears.
When you combine focused metrics, baselines, and cross-layer correlation, monitoring becomes proactive. It allows you to spot abnormal behavior early, understand impact quickly, and intervene before small issues turn into outages.
That’s the difference between monitoring that generates noise and monitoring that actually helps you operate the network.
Use Reports and Dashboards to Turn Monitoring Data Into Decisions
Monitoring generates data, but reporting and dashboards determine whether that data actually helps you operate the network.
Reports take raw monitoring data and organize it over time so patterns become clear. This way, instead of reacting to individual data points, you can see how the network behaves across hours, days, or weeks.
This view helps you spot trends that aren’t obvious in real time:
Increasing error rates often signal aging hardware or misconfigurations
Slowdowns that appear at the same time each day usually indicate peak usage periods
So, design reports to answer specific questions, such as:
Is performance improving or degrading over time?
Which links or devices are consistently under strain?
Are recent changes stabilizing the network or introducing new issues?
But not every report is meant for the same audience; each type serves a distinct role. Make sure to design one that aligns with your needs:
Operational reports support day-to-day work. They focus on uptime, latency trends, error rates, and recent incidents so teams can validate fixes and track ongoing issues.
Executive summary reports focus on outcomes rather than technical detail. They highlight availability, major incidents, and overall network health so stakeholders can understand impact without digging into metrics.
Compliance reports demonstrate adherence to internal SLAs or external standards (e.g., SOX, HIPAA, ISO 27001). These reports are often used during audits and reviews and rely on consistent, historical data.
If you use the wrong report for the wrong audience, it will create noise instead of clarity.
Rely on Dashboards for Real-Time Visibility During Operations and Incidents
While reports help understand trends over time, dashboards show what’s happening on the network right now. They pull live data from monitoring tools and present it in one place so you can quickly see the current state of the network.
A well-designed dashboard highlights:
Active alerts
Device and link status
Traffic levels on critical paths
Error and packet loss trends
During incidents, shared real-time dashboards help NOCs and SREs identify what’s affected, what’s stable, and whether conditions are improving.
Design Alerts and Escalation Paths That Teams Can Actually Act On
Alert fatigue occurs when your monitoring system generates too many low-value or noisy alerts than your team can reasonably respond to. When every minor fluctuation triggers a notification, alerts lose their meaning and teams start tuning them out.
This has direct consequences on how you operate the network:
Important issues get buried in noise
Response slows down
Teams end up reacting late instead of early
As a result, IT teams stop trusting alerts altogether, which defeats the purpose of monitoring.
That’s why alerts should be tied to meaningful thresholds that indicate real risk, not normal variation:
Use tighter thresholds and lower latency for critical systems with a broad impact
Allow broader thresholds or delayed alerting for non-critical or low-impact systems
Prioritize alerts so you can immediately see which ones require action and which ones are informational
Even well-designed alerts become noisy if they’re treated in isolation. So, instead of receiving multiple alerts for related symptoms, correlate alerts to group them into a single issue that points to the underlying cause.
For example, instead of seeing separate alerts for high latency, packet loss, or application errors, you receive one correlated alert showing that a failing router is affecting multiple services. This would shift your focus from chasing symptoms to fixing the root cause.
But when something triggers, you shouldn’t have to decide who owns it at the moment. To avoid this, create a clear escalation path like this:
The initial alert notifies the on-call engineer
If the issue persists or worsens, it escalates automatically
Ownership and response expectations are clear at each step
Defining this workflow ahead of time ensures alerts reach the right people quickly and prevents delays caused by confusion during incidents.
Track Configuration Changes to Prevent Silent Failures
Networks fail because something changed quietly and no one noticed. This could include firmware upgrades, CLI-based configuration edits, emergency patches, or last-minute routing changes made during an incident.
Configuration and change management make sure those changes don’t destabilize the network:
Configuration management tracks how network devices are configured and flags when settings change or drift from an approved state.
Change management records when changes happen, what was modified, and provides a way to review or roll back those changes if something goes wrong.
What to Do with Configurations?
Treat configurations as versioned assets, which means think of them as tracked records. Why? Because configuration monitoring tools regularly collect configuration files from devices and store them as versions.
Each change is recorded with a timestamp and device context, creating a clear change history you can reference during incidents.
This history makes it easier to answer critical questions quickly:
What changed in the device configuration?
When did it change?
Which devices were affected?
Keep Your Monitoring System Available During Outages
High availability of monitoring systems means your monitoring system stays available and functional even when parts of the network or infrastructure fail. If it goes down during an outage, you lose visibility at the exact moment you need it most.
To prevent this, focus on a few core principles when designing your monitoring setup:
Build in redundancy: Deploy multiple collectors, pollers, or monitoring nodes across availability zones or regions. If one fails, others seamlessly continue data collection, alerting, and visualization.
Use automatic failover: Health checks should detect failures and shift monitoring tasks to healthy components without manual intervention.
Protect monitoring data stores: Replicate monitoring data across multiple locations so historical data, baselines, and reports remain accessible even if one data store fails.
Design for multiple network paths: Ensure monitoring traffic can reach devices over more than one network route, so partial outages don’t isolate your monitoring system.
Plan for recovery: Document and test how monitoring is restored after major failures, so recovery doesn’t depend on guesswork during an incident.
Define Network Baselines So Normal Behavior Is Clear
A network baseline defines typical performance patterns for your network so you can spot problems before they escalate. To create helpful baselines, focus on three things:
Collect data over a realistic observation window: Build baselines using several weeks of data during normal operation. This gives you enough history to understand typical behavior without anchoring on short-term anomalies.
Account for peak and off-peak usage: Network behavior changes throughout the day and week. Separate busy periods from quieter ones so expected spikes, such as backups or batch jobs, don’t trigger unnecessary alerts, while abnormal behavior still stands out.
Factor in seasonal patterns: Some networks behave differently at month-end, quarter-end, or during specific business cycles. Include these patterns as they prevent baselines from becoming outdated or misleading.
Once baselines are defined, monitoring tools can compare real-time metrics such as bandwidth usage, latency, packet loss, and error rates against normal ranges.
So, when performance drifts outside those ranges for a sustained period, anomalies are flagged early, often before users notice an issue.
Support Security and Vulnerability Management
Don’t treat network monitoring and security as separate concerns. If you’re already monitoring how devices behave on the network, you should use that visibility to strengthen your security posture as well, using security integration and vulnerability assessments:
Security integration feeds network telemetry like device discovery, config changes, and traffic anomalies into SIEM or SOAR platforms by enabling early detection of risky or suspicious behavior
Vulnerability assessment finds weaknesses in devices and configurations before attackers or failures expose them
You need both because network monitoring already sees signals that matter for security—traffic patterns, device changes, and unexpected communication paths. When this data is isolated, those signals are easy to miss. When it’s connected to security processes, issues stand out faster and investigations move quickly.
To use network monitoring as part of your security strategy, do the following:
Feed network data into your SIEM: Send network events such as new device discovery, traffic spikes, and configuration changes into your SIEM so security alerts include network context.
Use traffic analysis to detect suspicious behavior: Watch for unexpected communication paths, unusual access times, or sudden changes in data volume that can indicate compromised systems or misconfigurations.
Trigger deep packet inspection (DPI) when behavior looks abnormal: Use packet capture or deeper analysis when traffic patterns break from normal behavior to confirm whether activity is legitimate or malicious.
Detect rogue and unknown devices early: Compare live discovery data against approved asset lists to flag devices without ownership or context, including shadow IT and unauthorized hardware.
Run vulnerability scans on a regular cycle: Scan for missing patches, outdated software, and risky configurations, and review results alongside network behavior to prioritize remediation based on real exposure.
Use security alerts with context: A login alert becomes more meaningful when paired with unusual outbound traffic. A malware warning is easier to investigate when you can see where data is moving on the network.
Choose Monitoring Tools That Scale Without Creating Tool Sprawl
Once you’ve defined what to monitor and how to act on issues, choose tools that can support those practices at scale without adding operational overhead or complexity.
For this, choose tools that have the following features:
Consolidate monitoring into a single platform: Unify monitoring across infrastructure layers (network, cloud, servers, applications) to provide shared context across alerts, dashboards, and reports, making issues easier to understand and trust.
Offer broad protocol support: Support standard protocols such as SNMP, ICMP, Syslog, sFlow, IPFIX, and NetFlow so you can monitor diverse devices without custom workarounds or gaps in visibility.
Support end-to-end network visibility: Look for coverage across network devices, performance metrics, alerts, reporting, and topology visualization, so insights connect back to real devices and traffic paths.
Integrate with operational workflows: Integration with ticketing systems, incident response platforms, and RMM tools turns alerts into action instead of manual follow-up.
Scale without losing reliability: As the network grows, the tool should handle more devices, higher polling volumes, and longer data retention without slowing dashboards or degrading accuracy.
Train Your Team So Monitoring Works Under Pressure
Training your IT team is essential because networks change constantly: new devices appear, configuration updates, and software patches impact performance and visibility.
Without regular training, alerts get ignored, dashboards lose meaning, and teams hesitate during incidents instead of acting with confidence.
To keep monitoring effective, use practical and consistent training approaches like these:
Use checklists to standardize responses, as this reduces guesswork and keeps responses consistent.
Run hands-on drills and reviews so teams learn how dashboards, alerts, and baselines behave under stress.
Implement These Best Practices with LogicMonitor
When discovery, topology mapping, monitoring, intelligent alerting, reporting, security integration, and tooling work together, monitoring stops being reactive. It becomes a system you can trust, one that helps you spot issues early, act with confidence, and keep the network stable as it grows.
If you’re ready to see how these best practices come together in a single platform, explore how LogicMonitor helps teams monitor complex networks with clarity and control.
FAQs
What is the difference between network monitoring and network management?
Network monitoring observes the network to understand performance, availability, and behavior. Network management takes action based on that information, such as changing configurations, adding devices, or enforcing policies.
Is network monitoring useful for small networks?
Yes. Small networks still experience slow traffic, misconfigurations, and device failures. So, monitoring helps small teams catch issues early, even when time and resources are limited.
What is the most common mistake teams make with monitoring tools?
Treating monitoring as a one-time setup is the biggest mistake IT people make. Networks change constantly, and when monitoring isn’t updated, alerts lose accuracy, and visibility degrades over time.
What happens if monitoring data is incomplete?
Incomplete data leads to false positives, blind spots, or missed anomalies. Your team may fix symptoms instead of root causes or miss gradual issues entirely, creating a false sense that the network is healthy.
Can network monitoring impact network performance?
Yes, but only if poorly configured. Excessive polling or aggressive scanning can add load, but when tuned properly, monitoring remains lightweight and has minimal impact on performance.
By Dennis Milholm
Sales Engineer, LogicMonitor
Subject matter expert in IT and Managed Services with 20+ years of experience across NOC operations, product management, and service delivery.
Disclaimer: The views expressed on this blog are those of the author and do not necessarily reflect the views of LogicMonitor or its affiliates.