Unlocking Full Application Visibility with LogicMonitor
Full application visibility becomes possible with LogicMonitor’s unified platform, combining Dynamic Service Insights, LM Uptime, and Logs to deliver context, reliability, and faster resolution for modern applications.
Full application visibility starts with one platform: LogicMonitor
Dynamic Service Insights ties infrastructure to business services, making every metric meaningful in context.
LM Uptime validates performance from the outside in, ensuring apps deliver the user experience you promise.
LM Logs unifies events, anomalies, and errors with metrics reducing MTTR dramatically
Unified visibility reduces silos, teams see one version of the truth across apps, infra, and services.
Recommendation: Stop chasing issues across disconnected tools. Consolidate observability with LogicMonitor and unlock faster resolution, stronger reliability, and better user experiences.
Why Full Application Visibility Matters
In today’s digital landscape, application performance isn’t just about monitoring several key apps and “keeping the lights on,” it’s about understanding the full breadth of your interconnected business services and ensuring you’re delivering seamless, reliable experiences to customers and teams alike. But as applications grow increasingly distributed across cloud, on-prem, and hybrid environments, monitoring them holistically can become a serious challenge.
That’s where LogicMonitor steps in. By leveraging LogicMonitor, teams achieve full clarity into application health and performance eliminating blind spots.
Modern apps are built on layers: APIs, microservices, third-party integrations, infrastructure, and user interface . A slowdown or issue at any point can ripple across the entire system negatively impacting the business. Traditional monitoring tools often provide visibility in silos, leaving teams to piece together fragmented insights when things break. Even complex, robust Application Performance Monitoring that provides deep tracing on your most critical applications can come up short because it doesn’t cover all the interrelated apps and services or the underlying infrastructure.
The result? Longer mean time to resolution (MTTR), missed SLAs, and frustrated users. Full application visibility changes the game by:
Connecting infrastructure to user experience
Providing valuable insights through a service-focused view of the environment
Accelerating root-cause analysis
Proactively detecting anomalies before outages occur
Correlating logs, metrics, and events into a single source of truth
Enabling you to focus on what really drives your business
The Three Pillars of Application Visibility with LogicMonitor
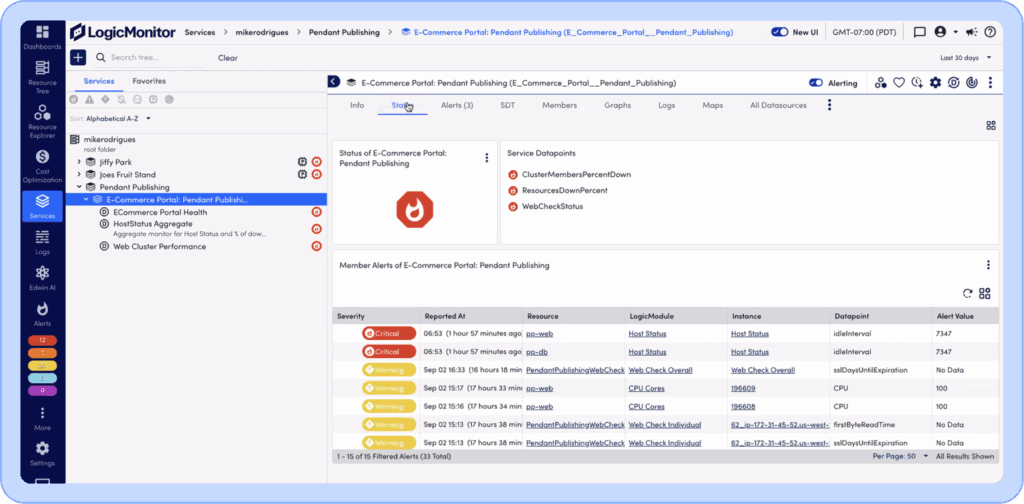
1. Service Health
Dynamic Service Insights (DSI) bridges the gap between infrastructure and business services. Instead of monitoring servers or containers in isolation, DSI automatically maps dependencies and ties them back to the services they power. This means teams don’t just see “a server is down” they see which application, customer-facing service, or business outcome is impacted. By providing real-time context, DSI helps eliminate noise, align IT with business priorities, and cut through the clutter of alerts.
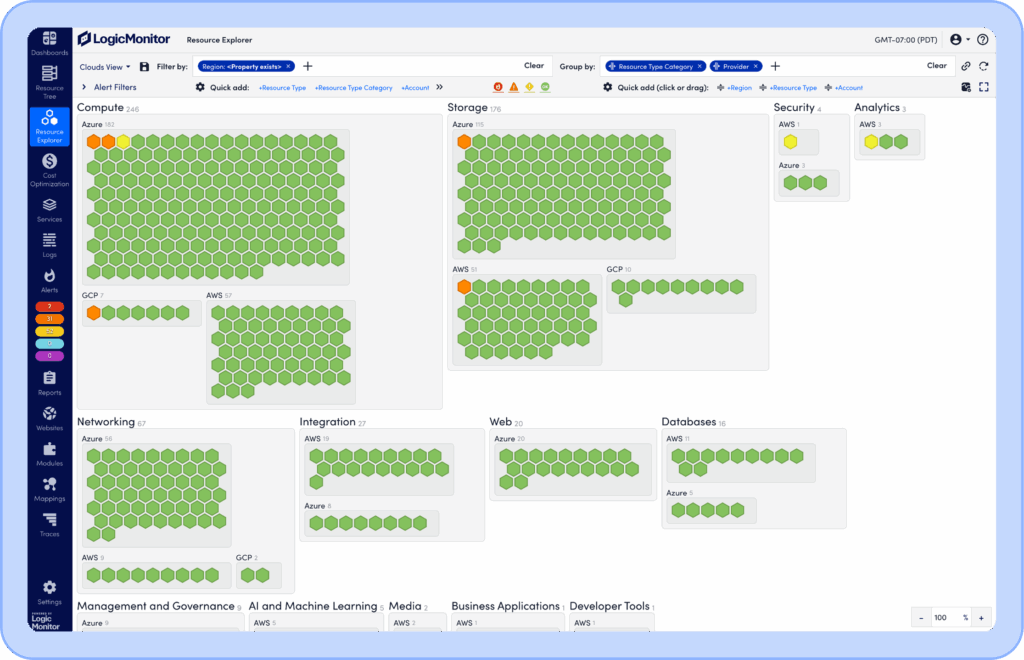
2. Verified Uptime
While internal monitoring tells you how your systems should be performing, LM Uptime shows you how they actually perform from the outside in. Through website monitoring and global checks, LM Uptime validates SLAs, identifies issues before customers feel them, and highlights geographic or network-specific challenges. This capability ensures organizations deliver on the experience they promise no surprises, no missed downtime.
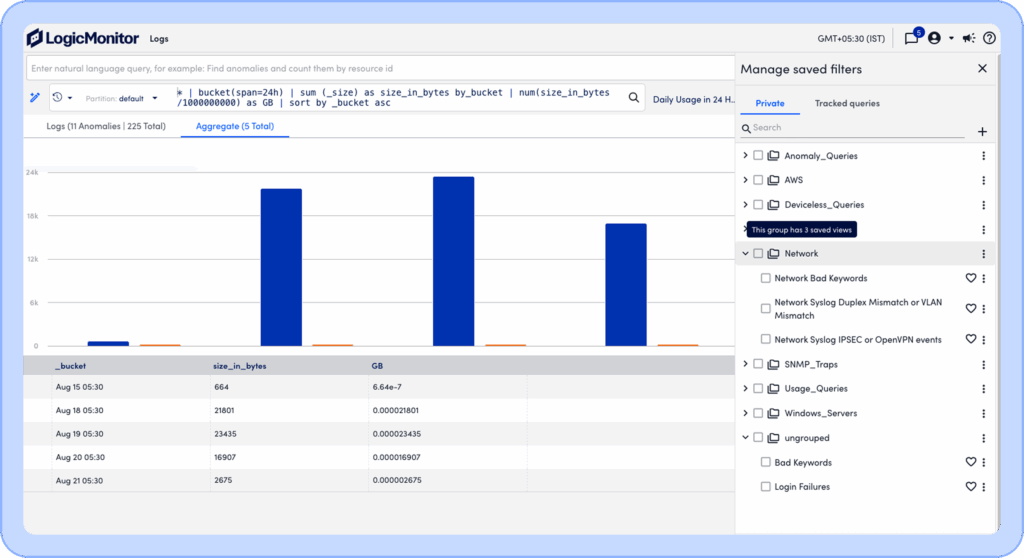
3. Correlated Insights
Metrics tell you what’s happening; logs tell you why. With Logs integrated directly into the LogicMonitor Envision platform, teams no longer need to swivel between separate log management tools. By unifying logs, events, and metrics, the Envision platform provides correlated insights in a single pane of glass. Intelligent anomaly detection and pattern recognition– powered by AI– accelerate root-cause analysis, enabling teams to move from incident to resolution in minutes instead of hours.
Why It Matters
By combining these three powerful products Dynamic Service Insights, LM Uptime, and LM Logs, LogicMonitor enables ITOps teams to gain complete application visibility. The result is:
Faster resolution times thanks to correlated insights
Greater reliability through proactive detection and prevention
Better collaboration with one source of truth across teams
Happier users and customers who experience seamless performance
Unlock the Full Picture with LogicMonitor
Application complexity isn’t slowing down, it’s accelerating. The only way to stay ahead is with an observability platform that gives you a holistic, service-centric, and user-focused view of performance. LogicMonitor does exactly that by uniting Dynamic Service Insights, LM Uptime, and LM Logs into one powerful solution.
Ready to move beyond blind spots? With LogicMonitor, you don’t just monitor, you see the whole picture.
Want to see application visibility in action? View our recent Power Hour recording.