
API Monitoring: Best Practices, Benefits and Solutions
Uptime checks alone won’t save you. These API monitoring best practices help teams catch real problems before customers do.


Denton Chikura
The quick download:
API monitoring is only as good as your strategy. Reactive alerting on errors you can already see is too late.
-
Proactive monitoring means setting thresholds based on user-impact baselines, not generic defaults. Your p99 latency matters more than your average.
-
Synthetic testing and real-user monitoring serve different purposes; teams that use only one are missing half the picture.
-
Alerting on symptoms rather than causes floods on-call rotations with noise. Correlate signals across layers to surface root causes faster.
-
Treat your monitoring configuration as code: version it, review it, and update it whenever your API changes.
APIs are now the foundation of modern software. They connect microservices, power third-party integrations, and deliver real-time functionality across applications. But this also makes them a point of fragility: a single failed API can slow or break entire user journeys.
That’s why API monitoring best practices are essential. Monitoring ensures APIs remain reliable, available, and performant—and gives teams the data to detect anomalies before they impact customers. In this article, we’ll explore five proven best practices that help SRE and DevOps teams strengthen resilience and user experience.
Summary of key API monitoring best practices
| Best Practice | Benefit |
|---|---|
| Set appropriate key performance indicators | Clearly define KPIs or Service Level Objectives to have a clear objective understanding of the performance of an API |
| Continuous real-time monitoring | Monitor 24/7 and in real-time to detect and address issues quickly |
| Set up alerts and reporting | Be notified when anomalies or unexpected errors occur |
| Integrate monitoring with the CI/CD pipeline | Have a clear understanding of the impact code changes will have on API health and performance |
| Understand the user’s perspective | Monitor from the end user perspective to know how UX is effected |
The rest of the article discusses these API monitoring best practices in detail below.
#1 Set appropriate key performance indicators
KPIs are fundamental to understanding and measuring the reliability and performance of APIs, as they ensure that the APIs are functioning at the necessary level required for an optimal experience within the overall system and user experience.
There are many “out of the box” API performance monitoring metrics that are commonly used in setting KPIs, such as:
- Latency – the time it takes for a request to be processed.
- Response Time – the time it takes for a system or application to respond to a user request
- Error Rate – the proportion of requests or operations that result in errors
- Consistency / Accuracy – the uniformity and predictability of system behavior given a certain action
- Availability – the portion of time the system is accessible to users without disruptions
- Throughput – the number of requests or transactions processed within a given time frame
However, indicators can also be customized to fit specific business needs. For example, if a system runs a periodic task of processing jobs once every minute, an indicator could be the number of tasks processed every minute.
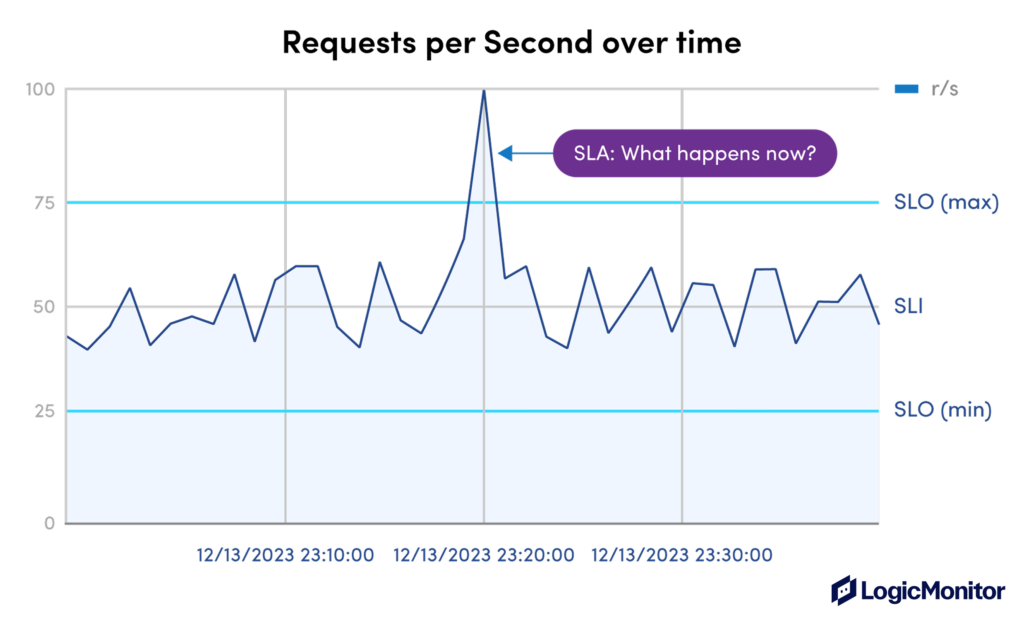
Once KPIs have been generated, you can use them to create Service Level Objectives (SLOs)—agreed-upon targets for a specific aspect of a system’s performance. An example of this could be: “Endpoint A has a latency objective <500ms for 99.95% of all requests”. Creating these objectives provides a clear understanding of whether or not a system or API is performing to the expected level.
SLOs are also quite valuable as they can be used for creating Service Level Agreements, particularly useful when setting expectations with downstream APIs or endpoints provided by third-party vendors. It is common practice, for example, to have an agreement of some form of compensation from third parties when a SLA is not met for a certain amount of time.
Example: “When Endpoint B does not meet the agreement of a <1% error rate over 1 hour, a financial penalty will be paid by the vendor”
#2 Continuous real-time monitoring
Monitoring of APIs should be done in real-time and 24 hours per day, seven days a week. Doing so ensures that any anomalies or errors that occur in a system are discovered and can be addressed swiftly.
Many errors or incidents can be measured in not only “what” but also “how long.” Knowing that something has gone wrong the instant it goes wrong allows for a shorter mean time to recovery and reduces overall impact. In the case of security incidents, the quicker the incident is noticed, the smaller the window of vulnerability. Similarly, if smaller problems are found early, they can be neutralized before they evolve into larger, more severe problems with bigger impact on user experience, overall system performance, or data continuity.
Doing the below can make it easier to identify the cause of an issue or when there is room for improvement in terms of performance optimization.
- Services in the system should regularly be emitting logs and metrics as they are processing requests and executing tasks.
- Distributed tracing should also be set up to track application requests from end to end to create an overview of the entire process.
- To ensure nothing is missed or overlooked, systems should emit metrics and logs for 100% of logs rather than looking at periodical or random traffic samples.
This can and should be done at the endpoint level to create a clearer understanding of bottlenecks or other problems.
#3 Set up alerts and reporting
The next step after creating KPIs and setting up continued real-time monitoring of the entire system should be to create alerts and reporting. Engineering teams can not address problems if they are unaware that a problem exists. It is imperative to set up metric-based and even log-based alerts. Setting up metric-based alerts ensures that an alert can be triggered whenever a certain value has exceeded. As an example, see the chart below.
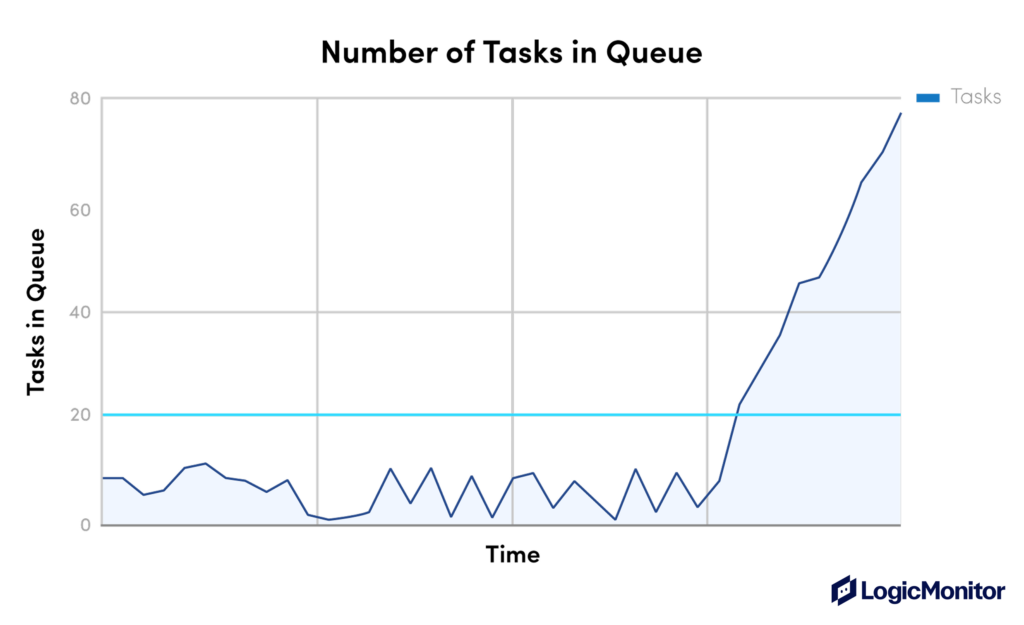
In this chart, imagine the metric is the “number of tasks in queue” waiting to be processed. Adding an alerting threshold at around 20, as it is slightly higher than the expected values, seems reasonable. If the number of tasks in the queue rises, perhaps due to a downstream API call, the system triggers an alert and informs that the problem exists. The same can and should be done with logs that have been identified as illustrating problems as well.
However, its important to continuously adjust alerting configuration and frequency to fit current requirements and balance between being too noisy and not noisy enough. Having noisy alerts can create fatigue, reduce focus on critical issues, and hinder productivity. Having alerts not noisy enough can result in delayed identification of issues and an increased mean time to recovery.
In the above example, imagine a job is created with 100 tasks. This would spike the value to above 20. However, the system is working fine, and the number will shortly return to a safe value. This is an example of an alert that is too noisy and could be adjusted to something such as “over the threshold for more than 5 minutes”.
With the metrics and alerting setup optimally you can generate reports regularly and use them to identify potential room for improvement or deterioration over time of endpoint or system performance. You can also use the data to prove that attempted adjustments and optimizations have paid off.
#4 Integrate monitoring with the CI/CD pipeline
Another important practice in API monitoring is to shift the importance of monitoring and metrics left in the development and deployment process and integrate the monitoring with the CI/CD pipeline.
CI/CD pipelines are not only good for running tests and deploying new code to production but also can be used to automatically generate and update metric dashboards whose infrastructure and definitions live in code. Adding this functionality to the pipeline means every new metric and data point emitted by an endpoint is automatically covered in generated dashboards from the moment the code reaches the production environment. Ofcourse, for this to work in practice, engineers have to do their due diligence from the start of the project.
You can also validate data and SLOs by running tests in the CI/CD pipeline that use synthetically created traffic against the system’s API endpoints to simulate real traffic and collect data points to help identify performance or accuracy changes that might be introduced with the next iteration of the system being deployed.
You can read more about CI/CD in relation to monitoring APIs in our in-depth guide on API Monitoring Tools.
#5 Understand the user’s perspective
Understanding the user experience is a critical aspect of API monitoring, as it directly impacts customer satisfaction, business performance, and the overall success of digital products and services.
Synthetic monitoring
Simulating or capturing requests from different regions and different user types can help create an understanding of what the user experience is like in terms of accuracy, latency, or even responsiveness. This can be done by not only monitoring real user interaction but also by using synthetic monitoring.
Synthetic monitoring is a form of monitoring that emulates end-user transactions using behavioral scripts to validate and measure workflow performance. This kind of monitoring is well-suited for resolving issues because it detects slowness or downtime before your end-users notice any impact. Being able to directly recognize when user experience has degraded allows the opportunity to quickly revert or pivot to another solution before too many users are impacted by the change. Frequently testing and validating response data ensures a higher level of accuracy and consistency within the system, making it seem more reliable and worthwhile to the user.
Collaborate with business stakeholders
Another essential aspect of this is to promote collaboration between technical and non-technical teams, resulting in clear priorities or areas of emphasis when analyzing improvement opportunities. This is vital to success as not all systems have the same priorities depending on the domain. For example, in one system, it is most important to the user that the latency is extremely fast, but it is not so important to have up-to-date data as eventual consistency is acceptable. In another, it is fine to have high latency as the accuracy data is always correct and up to date.
At the end of the day, API endpoints are built to serve a purpose to users, where users can be customers or another software component utilizes the endpoint. Knowing their experience and iterating on improvements is the best way to ensure positive results.
Conclusion
We’ve reviewed some of the most important best practices when monitoring APIs. From creating and tailoring KPIs to fit business needs to regularly iterating improvements based on direct insight into the user experience, emphasizing these best practices in API monitoring ensures the technical robustness of systems and places user satisfaction at the forefront.
As API endpoints serve a purpose for users, understanding and continually enhancing the user experience is foundational to achieving success. By implementing these best practices, organizations can proactively navigate challenges, optimize performance, and deliver a seamless and reliable digital experience for their users.
CHAPTERS
NEWSLETTER
Subscribe to our newsletter
Get the latest blogs, whitepapers, eGuides, and more straight into your inbox.
SHARE
Put these best practices to work, without building the tooling from scratch.
LogicMonitor combines synthetic testing, real-user monitoring, and intelligent alerting in one platform, so your team can act on the right signal faster.
FAQs
What is the difference between synthetic monitoring and real-user monitoring for APIs?
Synthetic monitoring uses scripted, scheduled requests to test API endpoints from external locations, providing consistent, proactive coverage and catching issues before real users encounter them. Real-user monitoring captures data from actual production traffic, reflecting the true diversity of user conditions and network paths. Both are necessary: synthetic for proactive alerting, real-user monitoring for understanding actual impact.
How often should API health checks run?
For production APIs, health checks should run at intervals short enough to catch failures before users notice, typically every 30 seconds to 2 minutes depending on your SLA. Critical endpoints such as payment or authentication may warrant checks every 15–30 seconds. The interval should be informed by your recovery time objectives, not just technical convenience.
What should trigger an API monitoring alert?
Alert on user-impacting signals: error rate exceeding a meaningful threshold, latency rising above your p99 baseline, or availability dropping below your SLA target. Avoid alerting on every small fluctuation; alerts should be actionable. If an on-call engineer cannot take a clear action in response to an alert, the threshold is probably misconfigured.
How do you set meaningful monitoring thresholds without historical data?
Start with conservative defaults, deploy monitoring alongside the API from day one, and let it collect baseline data across different times of day and traffic patterns. After two to four weeks you will have enough data to set thresholds based on actual behaviour. In the meantime, alert on relative deviations such as 2x the rolling average rather than absolute values.

By Denton Chikura
Technical Writer

Denton Chikura is a technical writer and longtime observability advocate focused on helping site reliability engineers and engineering teams discover the tools and capabilities that strengthen internet resilience. He works at the intersection of monitoring, performance, and infrastructure to make complex systems more understandable and usable, bridging the gap between deep technical detail and real‑world operations. His goal is to help teams build faster, detect issues earlier, and recover smarter, ultimately making the internet a better, more reliable place for everyone.
Disclaimer: The views expressed on this blog are those of the author and do not necessarily reflect the views of LogicMonitor or its affiliates.
© LogicMonitor 2026 | All rights reserved. | All trademarks, trade names, service marks, and logos referenced herein belong to their respective companies.
