
How to Benchmark Website Performance
Website performance benchmarking tells you where you stand and what to fix. Learn which metrics matter, which tools to use, and how to set useful baselines.


Denton Chikura

The quick download:
You can’t optimize what you haven’t measured against a baseline.
-
Benchmarking covers Core Web Vitals (LCP, INP, CLS) plus custom metrics that map to your business KPIs, like checkout completion time or button responsiveness.
-
Simulate a range of real conditions when testing: different devices, network types, and geographic locations. One test scenario won’t reflect your full user base.
-
Use multiple tools together. Free tools like Google Analytics and PageSpeed Insights give a starting point, but comprehensive monitoring needs more depth.
-
Set a baseline, optimize, then measure again. Benchmarking is a cycle, not a one-time snapshot.
Your website’s performance has a direct impact on revenue, customer satisfaction, and competitive advantage. Benchmarking gives you the data to understand where you stand, identify what’s slowing things down, and prove the business value of every improvement you make.
This guide covers the key metrics, tools, methods, and best practices you need to benchmark website performance effectively
Summary of key best practices to benchmark website performance
| Concept | Description |
|---|---|
| Focus on key metrics | Monitor the essential metrics, such as Core Web Vitals, but don’t forget to determine your unique KPIs. |
| Simulate real user conditions | Evaluate website performance across various devices and network conditions. |
| Test actual performance | Conduct tests at different times to understand how variations in server load and traffic affect website performance. |
| Use multiple tools for comprehensive analysis | Leverage a mix of benchmarking tools like Google Analytics, WebPageTest, and Catchpoint to gather data. |
| Follow industry standards | Keep up with evolving industry standards like Core Web Vitals, WCAG, and PCI DSS. |
| Create a baseline and then optimize | Establish a performance baseline to benchmark your website and make data-driven optimization decisions. |
| Compare with competitors | Utilize tools like SimilarWeb and Semrush to benchmark against your competitors and set performance goals. |
| Monitor your internet stack | Monitor your internet stack for an end-to-end view of factors impacting website performance. |
Key metrics to benchmark website performance
There are many standardized measures to assess your website. Google’s Core Web Vitals (CWV) evaluate user experience. For example
- Largest Contentful Paint (LCP) for loading performance.
- Interaction to Next Paint (INP) for user interaction.
- Cumulative Layout Shift (CLS) for visual stability.
These metrics can directly impact the user’s perception of your site’s speed and smoothness. This guide explains CWV metrics in depth.
As shown below, Google has established ranges that can benchmark website performance.
| Good | Need improvement | Poor | |
| LCP | <=2.5s | <=4s | >4s |
| INP | <=200ms | <=500ms | >500ms |
| CLS | <=0.1 | <=0.25 | >0.25 |
Beyond CWV measurements, other website performance metrics include Time to First Byte (TTFB) and overall page load time. Both indicate server and network efficiency. They reveal insights into your server response latency and the time it takes for content to be delivered to the user’s browser.
In addition to the standard metrics, there are custom metrics unique to each type of website. For instance, an e-commerce website might track custom metrics such as “add to cart” button responsiveness or checkout process efficiency, which are directly tied to business KPIs like conversion rates and revenue. The table below gives examples of custom metrics and how they map to standards.
| Category | Standard Metric | Example or Description | Custom Metric (E-commerce) | KPI |
|---|---|---|---|---|
| Accessibility | WCAG A Level Compliance | All non-text content has text alternatives (WCAG 2.1, 1.1.1). | Button accessibility on product pages | User engagement, conversion rate |
| Accessibility | WCAG AA Level Compliance | Content is accessible by keyboard only (WCAG 2.1, 2.1.1). | Navigation menu accessibility | Bounce rate, user retention |
| Accessibility | WCAG AAA Level Compliance | Context-sensitive help available for all forms and crucial site sections (WCAG 2.1, 3.3.5). | Accessibility of checkout process | Conversion rate |
| Security | Network Security (PCI DSS Requirement 1) | Installation and maintenance of a firewall to protect cardholder data. | Security of payment gateway | Fraud rate, transaction security |
| Security | Data Protection (PCI DSS Requirement 3) | Encryption of cardholder data transmitted across open, public networks. | Efficiency of the data encryption process | Data breaches, compliance rate |
| Security | Access Control (PCI DSS Requirement 7) | Restriction of access to cardholder data by business need-to-know. | Custom user roles and access management | Operational efficiency, security |
| Performance | Page Load Time | Standard metric often used to gauge site performance. | Load time of “Add to Cart” button | User experience, sales volume |
| Performance | Error Rate | The rate of errors users encounter affects the user experience. | Checkout process errors | Checkout abandonment rate |
How to benchmark website performance
You can use a variety of tools to collect data on your key metrics. Data is collected under different conditions to get a complete picture of website performance. Over time, you improve your website and collect metrics again to track progress.
Simulate real user conditions
Simulate real-user conditions and benchmark website performance across different scenarios. You will want to test your website and evaluate its performance on different devices, such as smartphones, tablets, and desktop computers, and under different network conditions, like WiFi, 4G, and 5G. Doing this ensures that your site delivers a consistent and positive experience for diverse user groups.
Tests can be conducted by changing one variable at a time to understand how each factor affects performance. Each test cycle should alter only one variable (e.g., network type, device, or geographic user location) to accurately measure its impact on load time, responsiveness, error rate, and other metrics.
For instance, you might want to test your site’s performance on a high-speed WiFi connection across different devices before changing network conditions to 4G or 5G. User location is another variable that needs special attention. Test the server’s capacity and response time variability to understand how geographic dispersion affects performance.
Test actual performance
You can also conduct tests to collect live performance data from actual users accessing your website, also known as real-user monitoring (RUM). You add JavaScript tags to the website code. They collect data on various metrics as real users interact with your website. You gain real-time data for different conditions—both peak and off-peak hours. You might find that you need to upgrade your server capacity or your budget to support scalability.
Tools
Organizations use a range of monitoring tools for benchmarking.
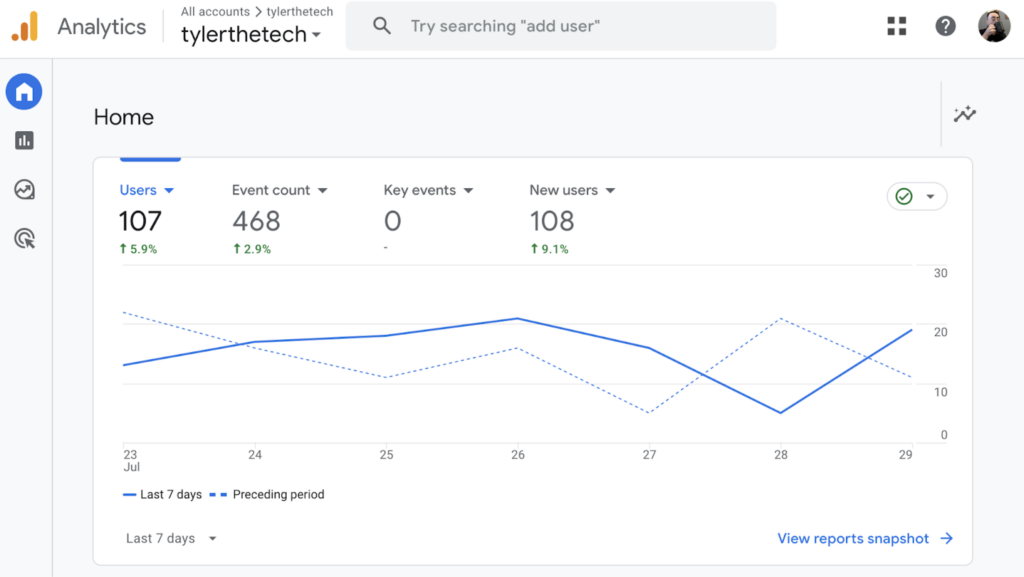
Google Analytics is a free tool to capture basic data on user behavior, traffic sources, and engagement.
Google’s PageSpeed Insights measures page load metrics and provides actionable recommendations for enhancements. Custom scripts within Google Tag Manager help you track customized metrics for your specific use case.
BrowserStack allows you to simulate a wide array of devices and network environments. You can quickly switch between testing environments without needing physical devices, making it easier to assess how different factors impact user experience.
LM Internet Performance Monitoring provides a centralized view of your entire website performance, including synthetic and real-user monitoring (explained below). You gain insights into how end users experience your website and how internet stack dependencies impact your service delivery.
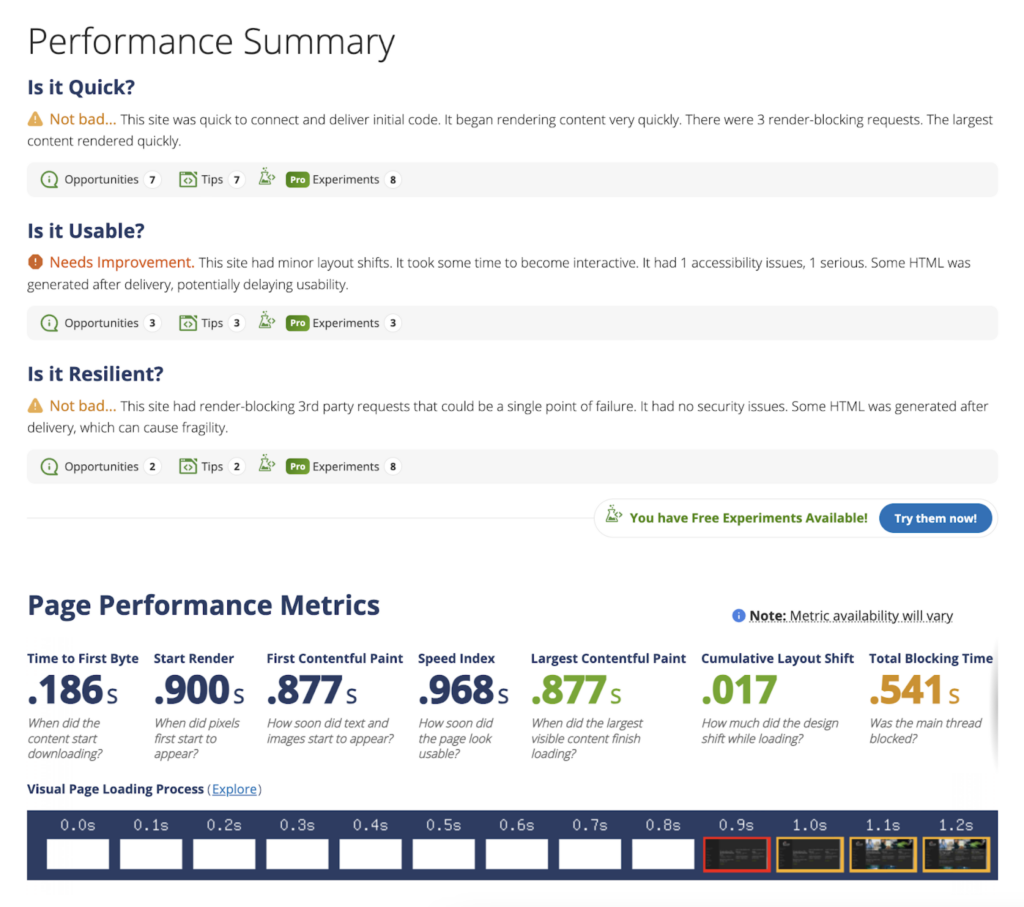
WebPageTest offers a detailed analysis of loading times and interactive readiness. It allows for a more in-depth test of web applications under various network conditions.
Synthetic Monitoring enables you to simulate user interactions from various locations in a controlled environment. You can realistically emulate actual end-user behavior and the full user journey from network nodes around the globe.
Real User Monitoring (RUM) records metrics related to real user interactions with your website across various devices, browsers, and network conditions. You can benchmark web performance data, such as response time, against business metrics, such as page views and conversions. You can also create custom metrics specific to your business.
Best practices to benchmark website performance
Consider the following when measuring website performance.
Follow industry standards
Industry standards ensure your benchmarking efforts are credible and consistent with industry norms. Standards like those set by the Web Content Accessibility Guidelines (WCAG) or Google’s CWV provide frameworks for measuring various website aspects.
For example, under the operability principle, the WCAG standards recommend that.
- All functionality is accessible via the keyboard
- Time limits can be adjusted or turned off
- Content does not flash more than three times per second.
Similarly, CWV metrics indicate factors that Google considers important in a webpage’s overall user experience. The latest iteration included Interaction to Next Paint (INP) in 2023. Metric standards are continually being updated, so it is important to stay up to date.
Create a baseline and then optimize
You must establish a performance baseline to know where you stand and determine what improvements to make. You’ll want to include core performance metrics that reflect the critical aspects of your website’s user experience and functionality.
Your baseline is whatever you see during initial testing. Tools like Google Analytics, WebPageTest, or others can help you collect the initial data to establish your baseline. Record the environmental conditions (like server configuration, third-party services used, etc.), and the exact specifications of the tests run.
From there, implement your improvements incrementally. Most speed optimization work focuses on front-end improvement around client-side code and image optimization. But you should also optimize database queries, caching strategies, and overall server configuration. These changes can significantly reduce HTTP wait times and improve your site’s perceived responsiveness.
Continuously monitor your metrics to track the impact of any changes. You can configure monitoring tools like Catchpoint to provide real-time alerts when performance metrics degrade beyond a certain threshold.
Compare with competitors
Your competitors are a goldmine of resources—they’ve already done the hard work of building and optimizing their sites. You just need to do it better than them. Analyze how your competitors’ websites perform across various metrics such as load time, user engagement, and overall user experience. That way, you can set realistic performance goals for yourself.
Tools like SimilarWeb provide insights into competitors’ traffic levels and user engagement, while SEO tools like Ahrefs and Semrush can reveal competitors’ best practices in content and digital marketing strategies. You can see a brief overview of what Semrush shows below:
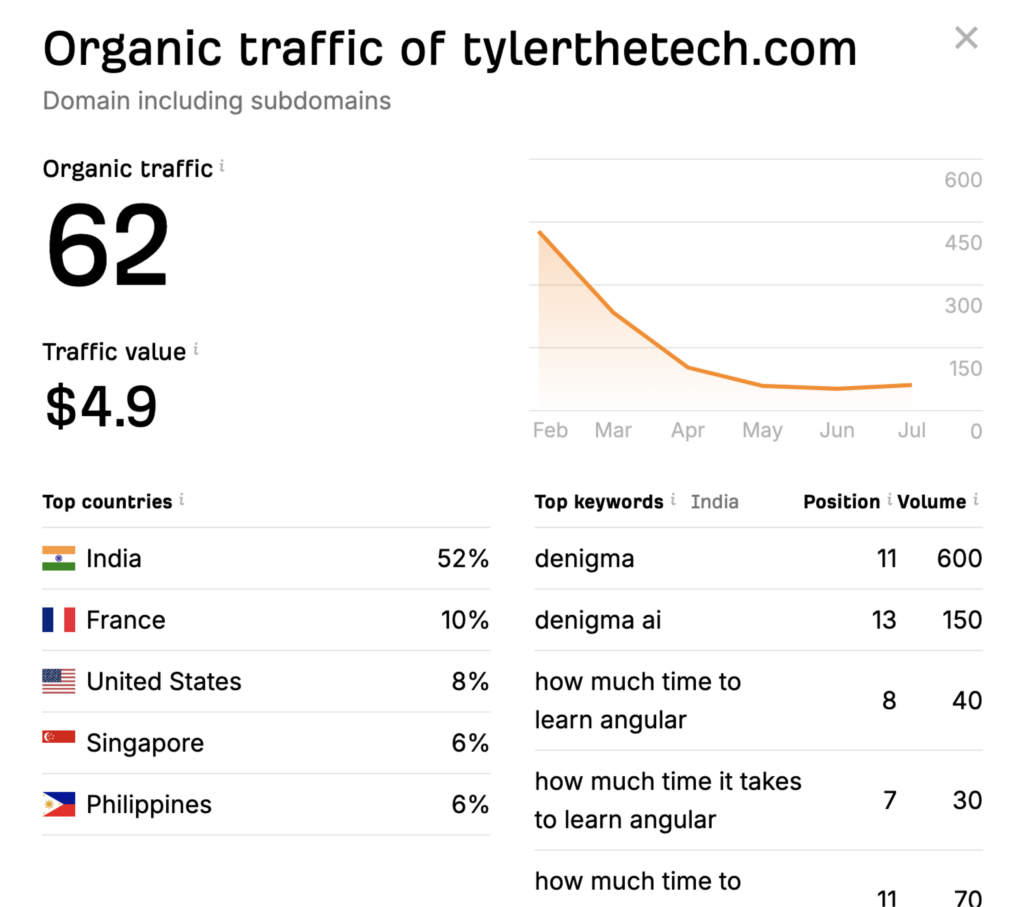
You can also use tools like Builtwith to understand your competitors’ tech stacks and what technologies they’re using. When you understand how your competition is getting it done, you can identify performance gaps and set achievable goals to improve your website’s performance and user experience.
Monitor your website’s Internet stack
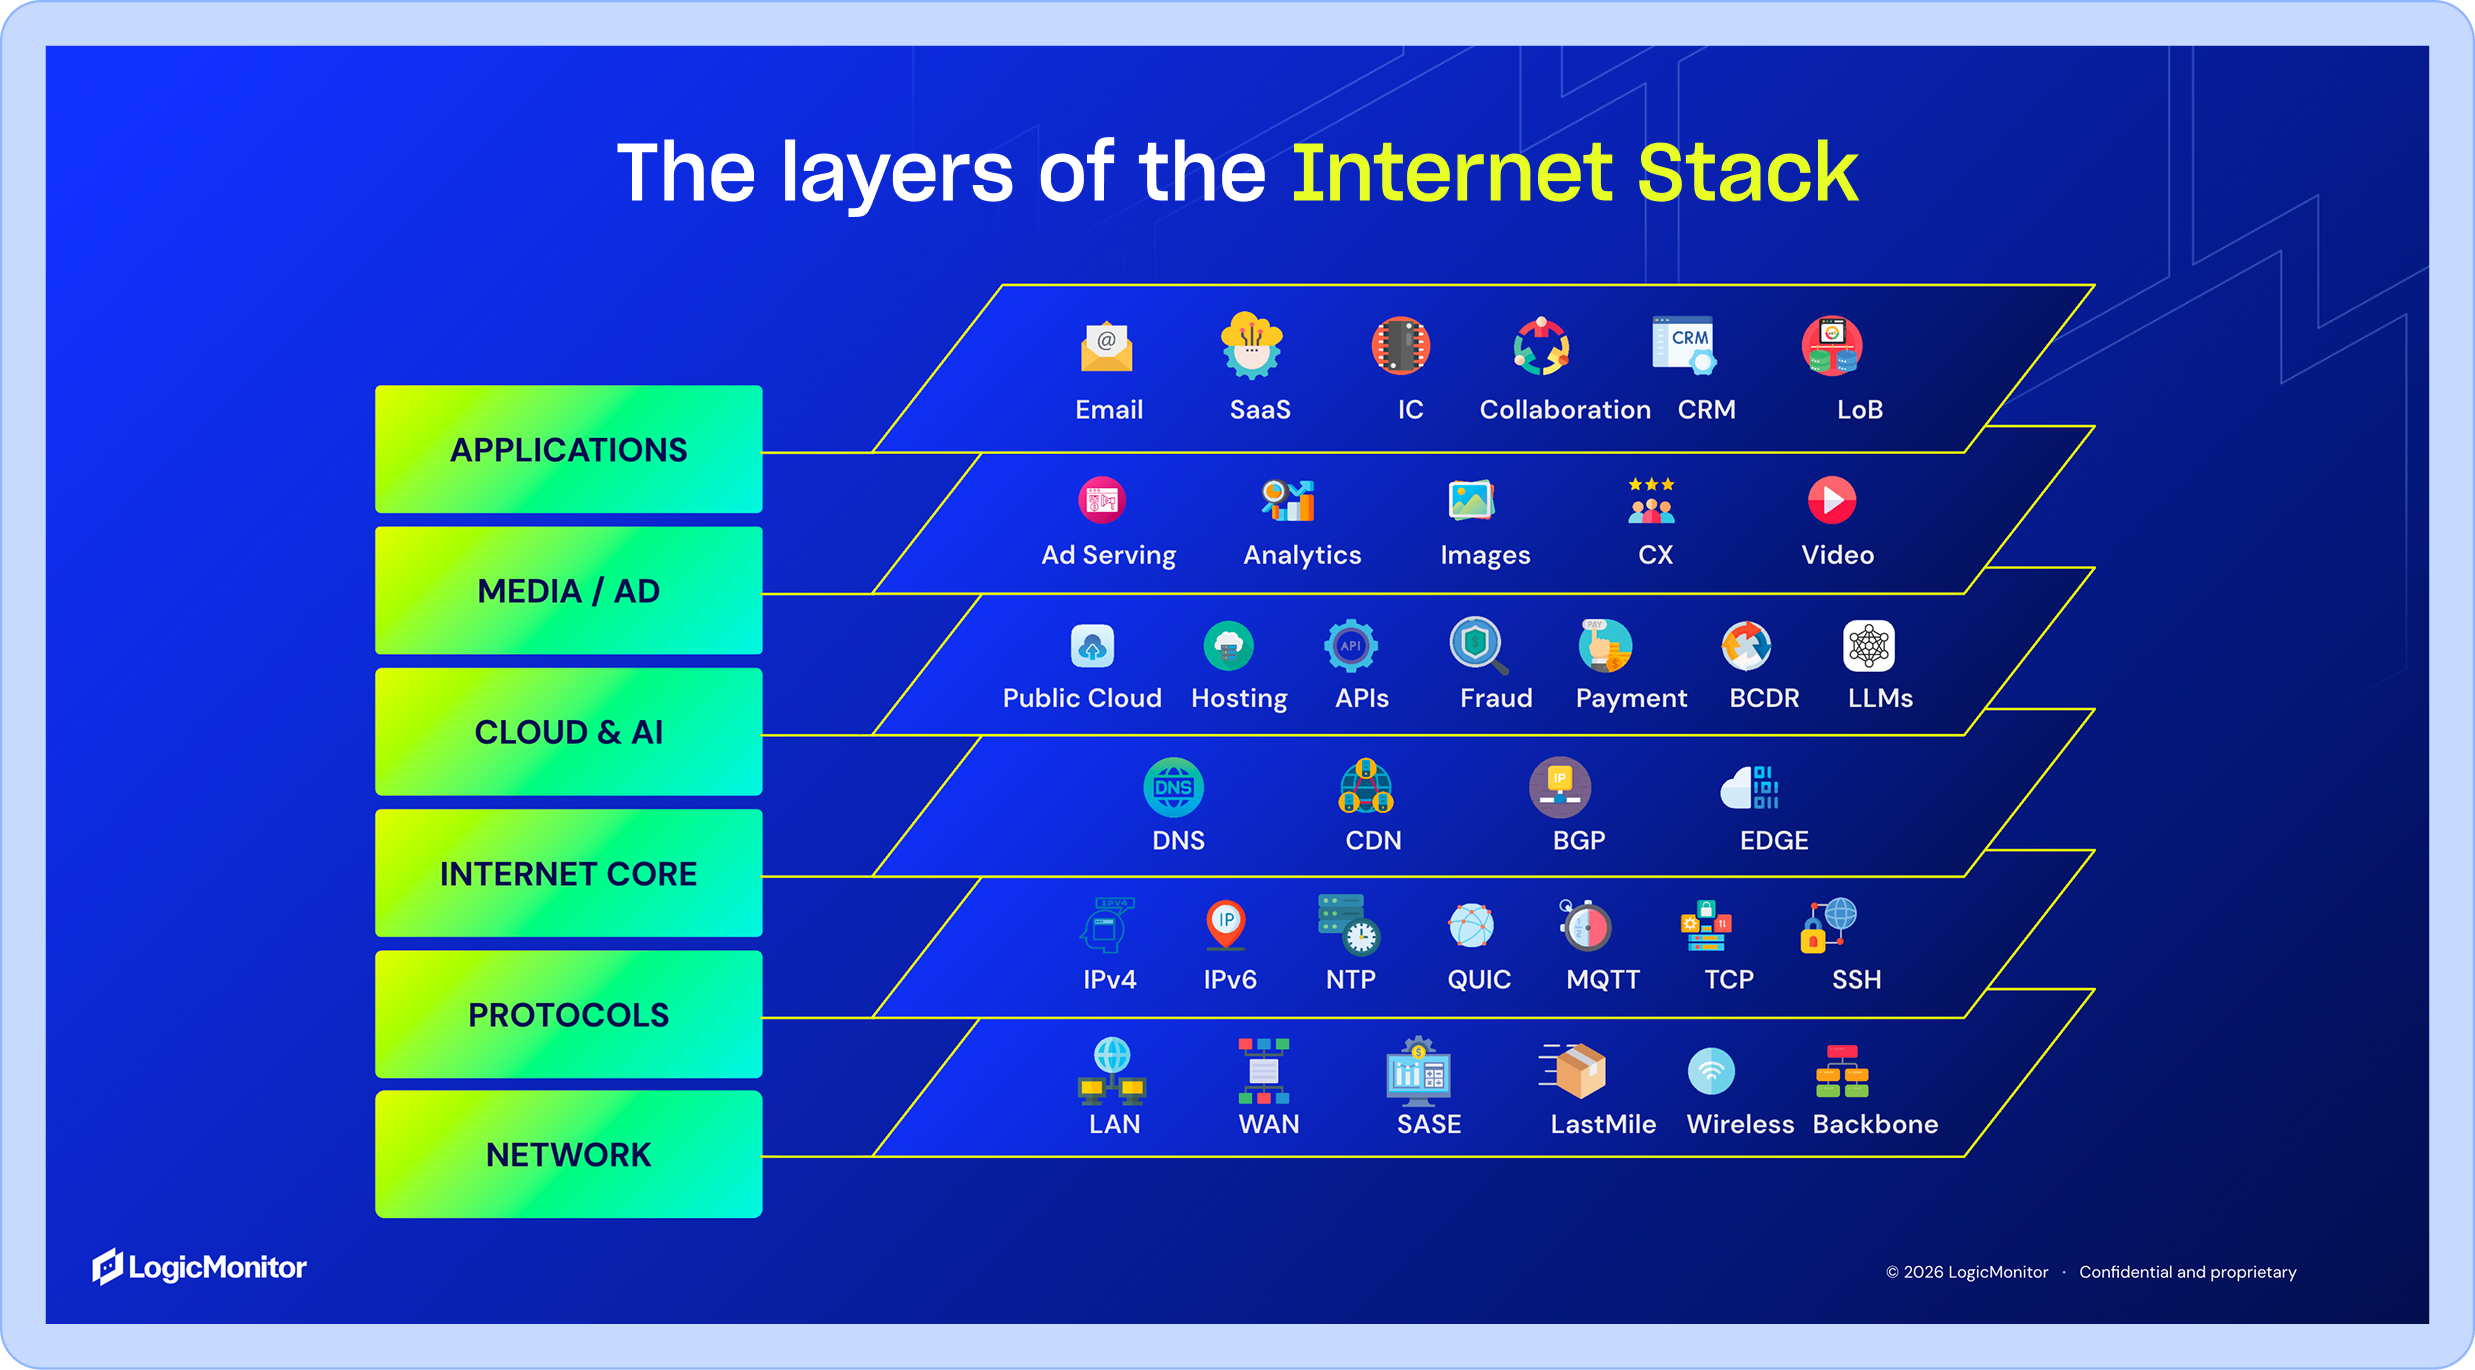
Modern websites often depend on third-party services and APIs to fulfill user requests. You also depend on different internet components like DNS (domain name service), content delivery network (CDN), and BGP (Border Gateway Protocol, used to route traffic between internet service providers) so users can find and interact with your website.
Their performance affects the perceived performance of your website, which is why your company’s administrators must have visibility into their proper functionality to troubleshoot user experience problems. Catchpoint proactively monitors the internet stack as part of a new monitoring category it pioneered: Internet Performance Monitoring (IPM). You can learn more about it here.
Conclusion
The business imperative to roll out new features on a website often takes precedence over incremental performance improvements. Engineers often have to convince leadership to invest in performance improvements over new development.
Website performance benchmarking gives you the data you need to demonstrate how faster page loads, reduced downtime, and improved user engagement directly contribute to increased sales and other business KPIs. You gain insights to make the right decisions to improve your website.
CHAPTERS
NEWSLETTER
Subscribe to our newsletter
Get the latest blogs, whitepapers, eGuides, and more straight into your inbox.
SHARE
Benchmarking only works if your monitoring keeps up.
LogicMonitor’s unified platform combines synthetic monitoring, Real User Monitoring, and Internet stack visibility so your team can benchmark, diagnose, and improve performance in one place.
FAQs
What is website performance benchmarking?
Website performance benchmarking is the process of measuring your site against defined metrics to establish a baseline. That baseline helps you track improvements over time, compare against competitors, and set goals tied to business outcomes.
Which metrics should I use to benchmark website performance?
Start with Google’s Core Web Vitals (LCP, INP, CLS), then add Time to First Byte (TTFB), page load time, and custom KPIs specific to your site, such as revenue-linked interactions or checkout completion rates.
What tools can I use to benchmark website performance?
Common options include Google PageSpeed Insights for quick recommendations, WebPageTest for deeper analysis, BrowserStack for cross-device simulation, and Catchpoint IPM for comprehensive ongoing monitoring with synthetic and real user data.
How often should I benchmark website performance?
Run benchmarks whenever you make significant changes to your site. For ongoing awareness, continuous monitoring is more reliable than periodic benchmarking, since performance can degrade gradually over time without a single obvious trigger.

By Denton Chikura
Technical Writer

Denton Chikura is a technical writer and longtime observability advocate focused on helping site reliability engineers and engineering teams discover the tools and capabilities that strengthen internet resilience. He works at the intersection of monitoring, performance, and infrastructure to make complex systems more understandable and usable, bridging the gap between deep technical detail and real‑world operations. His goal is to help teams build faster, detect issues earlier, and recover smarter, ultimately making the internet a better, more reliable place for everyone.
Disclaimer: The views expressed on this blog are those of the author and do not necessarily reflect the views of LogicMonitor or its affiliates.
© LogicMonitor 2026 | All rights reserved. | All trademarks, trade names, service marks, and logos referenced herein belong to their respective companies.
