The Edwin AI Settings page centralizes integration management for both outbound and inbound connections. The Settings page displays your third-party integrations.
Navigating to the Settings Page
In LogicMonitor, navigate to Edwin AI and then select the Settings page from the navigation sidebar.
Feature Highlights
New Stopped Azure VM and Enhanced Idle Resource Recommendations
Enhanced Script NetScans Now Groovy 4 Compatible
Additional Predefined Time Range Options for Reports
Monitoring Updates
Added monitoring support for API Server and etcd metrics in Azure Kubernetes Service (AKS) cluster DS.
Added support for monitoring Azure OpenAI Model Deployments.
Added support for monitoring Azure OpenAI Services.
The Federal Risk and Authorization Management Program (FedRAMP) is a U.S. Federal government program that provides a standardized approach to security assessment, authorization, and continuous monitoring for cloud products and services. FedRAMP leverages a standardized set of requirements, established in accordance with the Federal Information Security Management Act (FISMA), to improve consistency and confidence in the security of cloud solutions. The FedRAMP program helps U.S. Federal government agencies to accelerate their adoption of secure cloud solutions across their organization through the reuse of FedRAMP security packages.
LogicMonitor supports U.S. Federal government customers and is responsible for implementing and complying with the requirements established by the FedRAMP program. LogicMonitor maintains a FedRAMP Moderate certification, see LMforGov in the FedRAMP Marketplace.
Customer FedRAMP Obligations
To leverage LogicMonitor’s FedRAMP environment, you need the following:
FedRAMP approval LogicMonitor’s FedRAMP Moderate authorized environment is only available for approved customers.
Single Sign-On (SSO) Identity Provider You must use your own SSO provider.
For more information about how LogicMonitor manages customer interactions, sales, support, and data in a way that adheres to the stringent security and privacy standards, download LogicMonitor for Gov Platform – CRM from the LogicMonitor Trust Center.
Simultaneous FedRAMP and Commercial Accounts
You may have FedRAMP and non-FedRAMP enabled accounts as required by your business needs. To add accounts, contact your LogicMonitor account manager.
Child Accounts inherit FedRAMP enablement by the parent account. You must have distinct parent level accounts to have both a LM FedRAMP and LM Commercial account.
Important: Accounts and the data within cannot be moved between the FedRAMP and Commercial environments. For example, a pre-existing Commercial account cannot be migrated into the FedRAMP environment.
Feature In Scope
Not all LogicMonitor services or features are compliant with FedRAMP. The following table lists those services not in scope of FedRAMP compliance:
When using LogicMonitor’s API, you must replace any occurrence of “logicmonitor.com” with “lmgov.us”.
REST API
When using LogicMonitor’s REST API, the base URL for FedRAMP is the following: https://ACCOUNTNAME.lmgov.us/santaba/rest
You must replace ACCOUNTNAME with your LMforGov account name.
The following example displays how the base URL must be changed:
# Account Info: LogicMonitor recommends to NEVER hardcode the credentials. Instead, retrieve the values from a secure storage.
# Note: The below is provided for illustration purposes only.
accessId     = getpass.getpass("Enter your accessId: ")
accessKey    = getpass.getpass("Enter your accessKey: ")
company      = 'customername'
baseUrl      = 'lmgov.us/santaba/rest'

# Request Info
httpVerb     = 'POST'
resourcePath = '/setting/opsnotes'
queryParams  = ''
data         = '{"note":"deploy version 3.4.5","tags":[{"name":"reporting"}],"scopes":[{"type":"device","deviceId":530}]}'

# Construct URL
url          = 'https://' + company + baseUrl + resourcePath + queryParams

...
BigPanda helps teams correlate and manage incidents, but requires weeks of setup, tuning, and integration work to realize value. LogicMonitor delivers full-stack hybrid observability out of the box, with pre-trained generative AI that surfaces root causes and plain-language insights.
Moogsoft Stops at Alerts. LogicMonitor Fixes Them.
Moogsoft, now part of Dell APEX AIOps, leaves teams frustrated by slow deployments, months of manual rule-building, and a lack of real context in alerts. Without built-in automation or plain-language insights, it can feel like alert fatigue never ends.
That’s why teams are switching to LogicMonitor. It delivers full-stack observability from day one, with pre-trained generative AI that explains issues in plain English, pinpoints root causes, and helps eliminate alert noise—automatically.
At LogicMonitor, we believe that shaping the future of Agentic AIOps and observability requires more than just powerful technology. It demands bold perspective, deep market insight, and strategic vision. That’s why we’re excited to welcome Gregg Siegfried, former Gartner Vice President and longtime observability analyst, as our new Head of Market Strategy & Competitive Intelligence.
Gregg brings over 30 years of operating and advisory experience to LogicMonitor, including nearly a decade guiding enterprises through complex decisions in monitoring, AIOps, and IT operations. His appointment signals our deepened commitment to delivering insight-driven innovation in an increasingly dynamic market.
We sat down with Gregg to learn more about his move from Gartner back into operating, his take on observability trends, and what excites him about joining LogicMonitor at this pivotal moment.
Q: After nearly a decade at Gartner, what inspired your move back into operating—and why LogicMonitor?
Gregg: I’m a builder. Most of my career has involved creating or operating software products and services. Gartner is a wonderful place to work, and it absolutely reshaped my approach to technology, but at some point, I realized I missed building. With the industry evolving so rapidly, I realized I wanted to shift from observing change to driving it, and that meant stepping back into an operating role. I began to wonder if I could return to a smaller, more agile environment.
LogicMonitor has exactly the right combination of size, stability, and potential to capture my interest. The team is exceptional. The platform is helping customers not only monitor infrastructure but optimize, automate, and scale it in ways that weren’t possible even a few years ago. When I saw how it’s powering digital transformation for global brands, I knew I wanted to be part of that story. And Christina [Kosmowski, CEO]—well, she can be very convincing, as you probably know.
Q: From your vantage point, what are the most exciting—and most overhyped—trends in observability right now?
Gregg: Agentic AI probably fits both categories. AI has moved incredibly fast, and it’s hard not to be impressed by what LLMs are already enabling. But hype can outpace reality. I’m also closely watching OpenTelemetry’s momentum—adoption is accelerating, and its stability has improved dramatically.
More broadly, I’m excited by how observability is expanding to touch things like incident response and progressive delivery. I’ve long been a proponent of autonomous IT operations, and it’s finally starting to feel within reach, assuming we can move beyond rule-based AI systems to agent-first ones that can take action. Also, of course, we have to have that unified data context to bring the telemetry and observability dataset together with external ITOps context to power a unified knowledge graph. This does require a level of collaboration across the vendor ecosystem that’s incredibly diverse right now—there’s something for everyone.
Q: Your role at LogicMonitor spans market strategy and competitive intelligence. How do you separate signal from noise in such a fast-moving space?
Gregg: Ask me again in a few months! But seriously, my experience leading Magic Quadrants taught me how to filter overwhelming volumes of input—vendors, clients, noise—and zero in on what really matters to customers looking to achieve outcomes for their organizations. Sometimes, what isn’t being talked about is more important than what is.
I’m especially excited that there’s such strong internal AI adoption at LogicMonitor, stemming from the OpenAI collaboration. These days, it’s not that we have too little data—we often have too much. Partnering with teams across Sales, Product, Engineering, and Marketing will be essential to ensure we’re always reading the right signals.
Q: How do technologies like OpenTelemetry, eBPF, and AI figure into the future of observability?
Gregg: The future of telemetry acquisition is open source—and right now, that means OpenTelemetry. Robust OTel support is already “table stakes.” Differentiation in this space is shifting toward analysis, insights, and automation.
eBPF is fascinating. It enables safe code execution in the Linux kernel and powers some slick instrumentation use cases. For example, some tools can now auto-instrument applications without touching the code—collecting traces, logs, and metrics directly from the kernel.
And with AI, it’s a double-edged sword. Observability platforms will increasingly depend on AI for anomaly detection, adaptive thresholds, and GenAI-based insights. And the future lies with agentic AIOps. But at the same time, we also need to be thinking about how we observe AI and agents. LLM-based apps can seem healthy by traditional metrics but deliver nonsense due to hallucinations or drift—a nontrivial observability challenge.
Q: What’s one piece of advice you’d give to enterprise teams navigating today’s complex observability stacks?
Gregg: Simplify. Rationalize. Most teams don’t need 10 or 20 monitoring tools anymore. And having all these tools will only slow you down more as the IT environment gets more complex. Today’s platforms are powerful—the challenge is understanding how your systems interact. Reducing tool sprawl makes those relationships much clearer. That’s where resilience lives.
Q: And finally — what keeps you grounded outside of work?
Gregg: My family, absolutely. I’ve spent the last decade living in a forest, and nature’s constant change is incredibly grounding. I recharge through music—playing, listening, traveling to shows. I also volunteered as an EMT for years. That work puts “IT emergencies” into perspective pretty quickly.
Looking Ahead
Gregg’s arrival comes at a transformational moment—not just for LogicMonitor, but for the entire observability category. As we invest in AI-powered insight, open standards like OpenTelemetry, and platform-wide simplification, Gregg will be instrumental in ensuring our strategy stays sharp, differentiated, and customer-led.
We’re thrilled to welcome him to the team.
👉 Connect with Gregg on LinkedIn 📢 Stay tuned for more from Gregg in upcoming analyst and industry briefings.
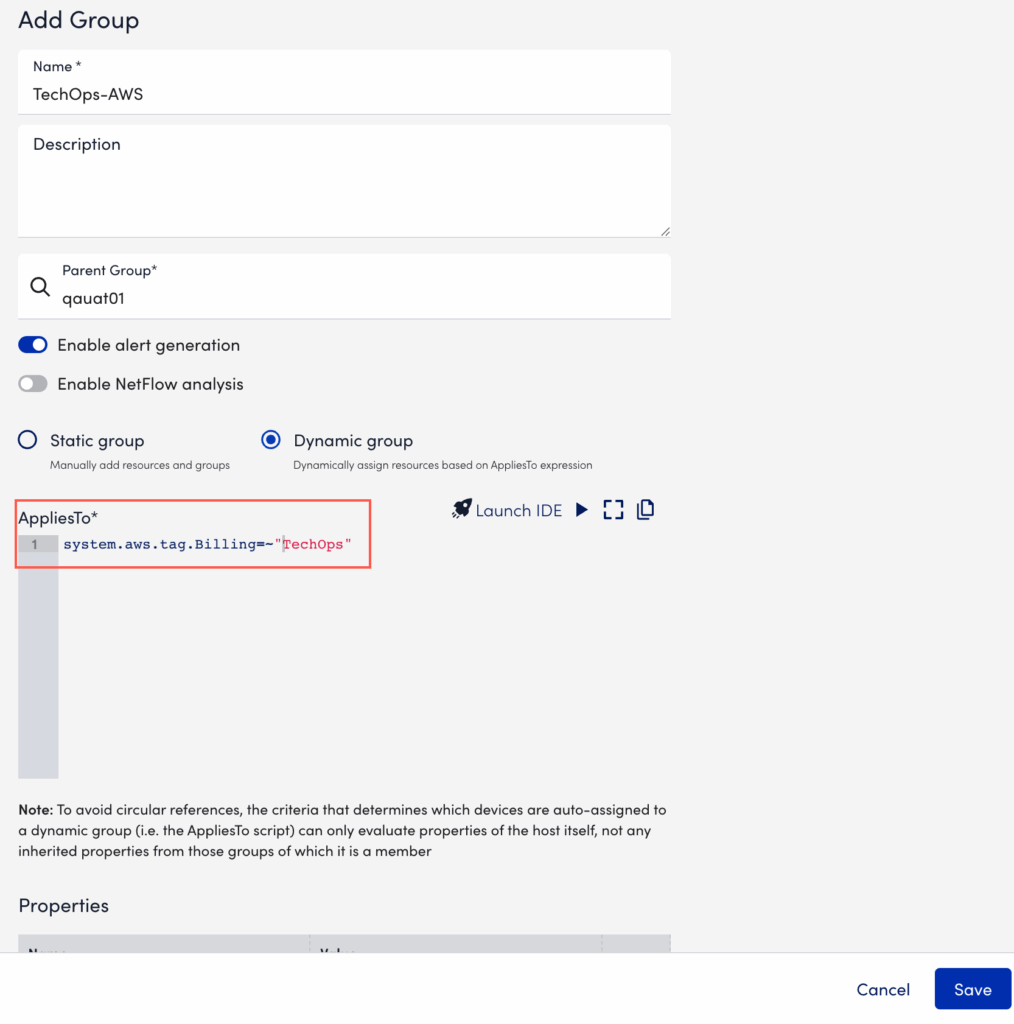
You can filter which AWS resources LogicMonitor auto-discovers by applying AWS tag filters. After discovery, LogicMonitor adds the resources as cloud resources and applies any associated AWS tags as resource properties..
AWS Tag Property Format
LogicMonitor adds tag-based properties using the following format:
system.aws.tag.<NAME>=<VALUE>
NAME—The name of the AWS tag
VALUE—The value of the AWS tag
Note: AWS tag filters are case sensitive.
AWS Tag Property References
You can reference AWS tag-based properties throughout your LogicMonitor account. For example, to create a dynamic group of AWS resources based on a tag value, use the following AppliesTo expression:
system.aws.tag.NAME=~"VALUE"
Replace NAME and VALUE with the specific tag key and value.
For example, the following table displays how LogicMonitor property names correspond to an AWS tag name:
LogicMonitor Property Name
AWS Tag Name
system.aws.tag.aws:cloudformation:stack-name
aws:cloudformation:stack-name
system.aws.tag.team
team
Network Monitoring Without The Gaps
Spot and solve network issues fast before they disrupt users. Get complete visibility across your cloud, data center, and every edge device in one platform.
When your team can see everything and understand what to act on, incidents shrink, outcomes improve, and IT becomes a driver of growth.
Fix problems before users notice
When you can detect and resolve issues early, you avoid service disruptions, missed SLAs, and late-night fire drills. That means happier users and less stress for your team.
Stay in control of your entire network
From cloud to data center to edge, get the awareness you need to make confident decisions, reduce risk, and stop problems before they spread.
Recover faster from every incident
Fewer escalations, faster root cause isolation, and smarter workflows mean less downtime and more time for the work that moves your business forward.
Prove performance and meet your commitments
Whether you’re tracking uptime SLAs or validating availability across environments, LM Envision helps you show the value IT delivers with data that’s always ready.
Do more with the team you have
By replacing patchwork solutions with a unified platform, you simplify day-to-day work and free your team to focus on what matters.
Connect network health to business outcomes
Show stakeholders how network behavior affects user experience, revenue, and growth, so IT can lead with impact, not just uptime.
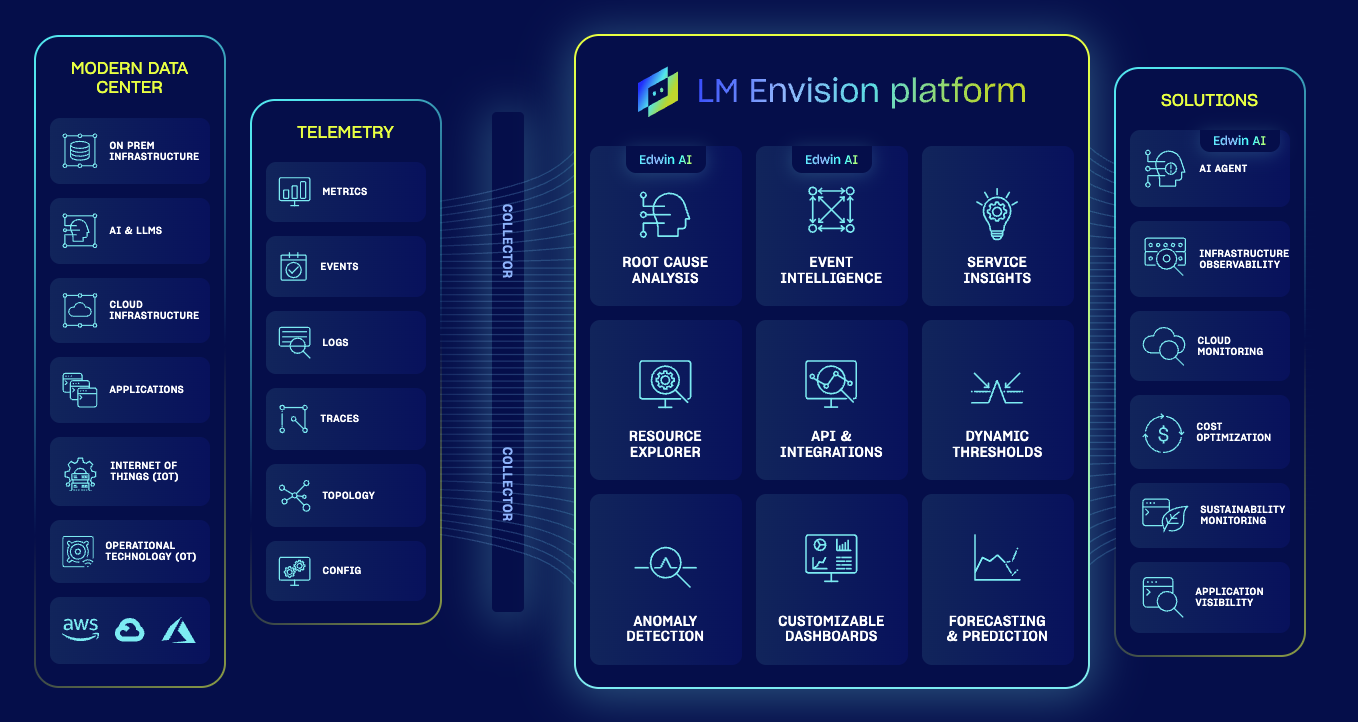
OBSERVABILITY POWERED BY LOGICMONITOR ENVISION AND EDWIN AI
Everything you need to monitor, troubleshoot, and optimize your network end to end
LM Envision combines real-time visibility, automated discovery, and AI correlation to pinpoint issues, so you can keep users happy and your infrastructure running.
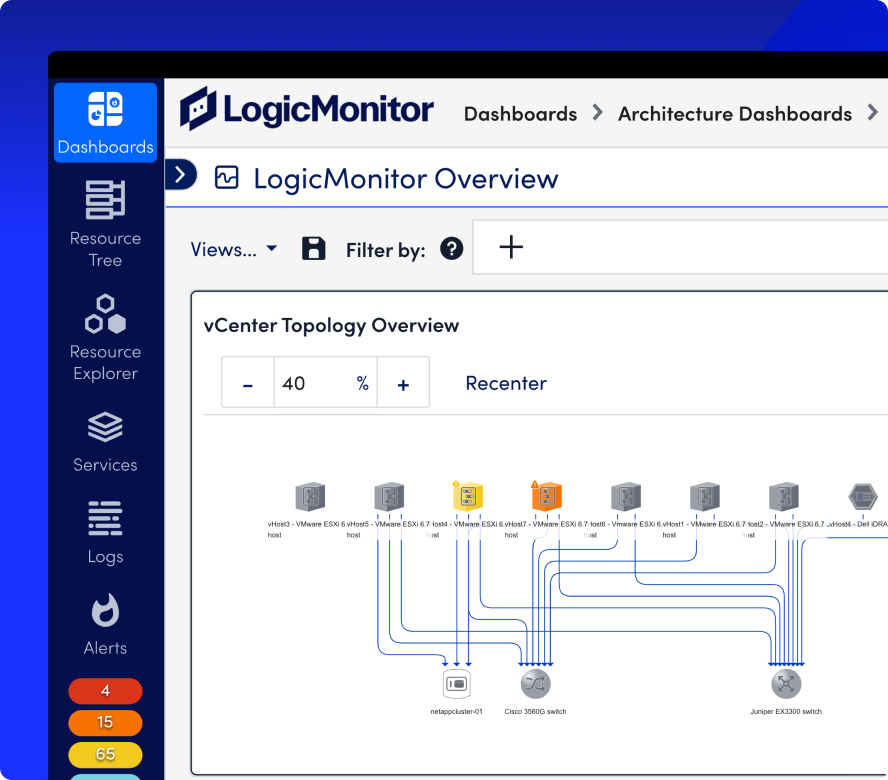
Quickly detect and map every device in your network using scheduled discovery and dynamic topology views.
Auto-discover routers, switches, and firewallsScan IP ranges on a schedule to identify new devices and apply best-practice monitoring templates automatically.
Visualize Layer 3 network relationshipsGenerate live topology maps to see device connections and streamline root cause analysis.
Surface real-time metrics for network health
Track performance across routers, firewalls, and interfaces in real time to spot issues before they impact users.
Monitor metrics every 30 secondsUse SNMP, WMI, or API polling for high-frequency insights into CPU, bandwidth, and latency.
Eliminate noise with dynamic thresholdsApply intelligent baselines that adapt to your environment to reduce false positives and highlight real problems.
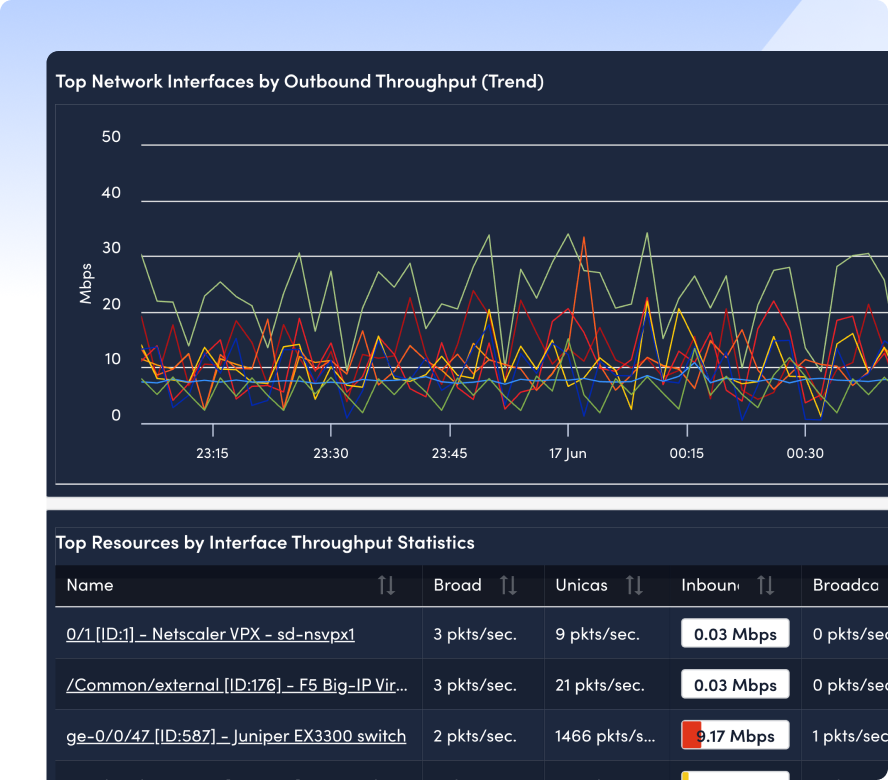
Get complete visibility into network traffic
Monitor traffic patterns across devices, apps, and protocols to identify top talkers and bandwidth hogs fast.
Track usage by application and protocolInstantly identify which services and devices are consuming the most bandwidth across your network.
Drill into flow-level traffic dataTrace traffic by source, destination, and volume—no additional tools or integrations required.
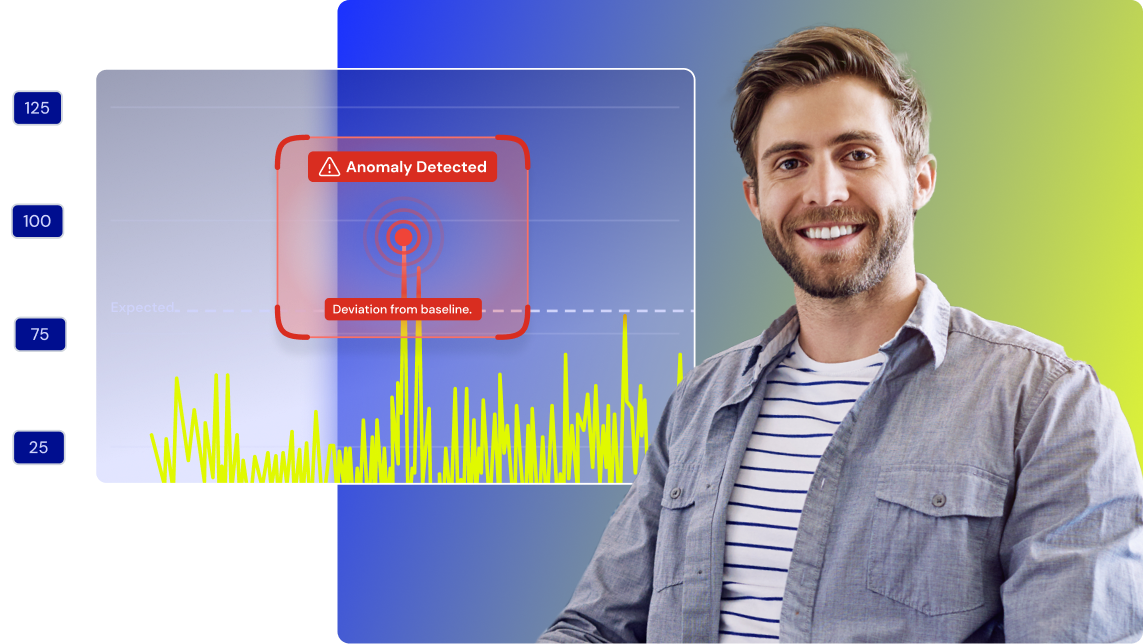
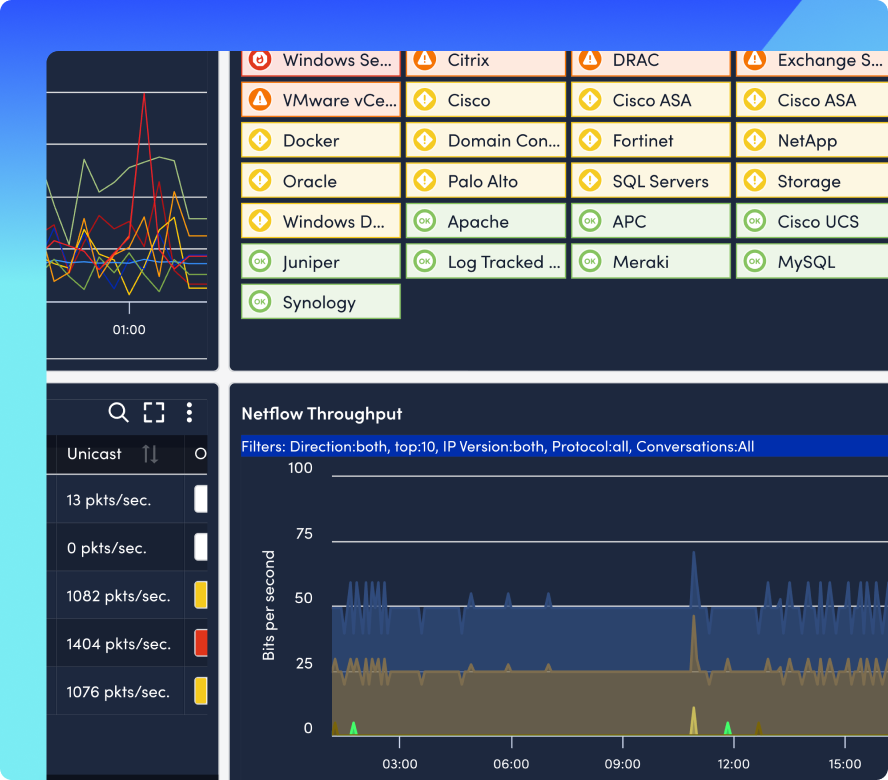
Detect anomalies and trigger smart
Use built-in machine learning to identify abnormal behavior and route alerts automatically to the right team.
Spot issues with predictive alertingForecast capacity problems and performance degradation before they affect SLAs or user experience.
Route alerts with full-stack contextNotify the right team instantly with alerts that include logs, metrics, and correlation data.
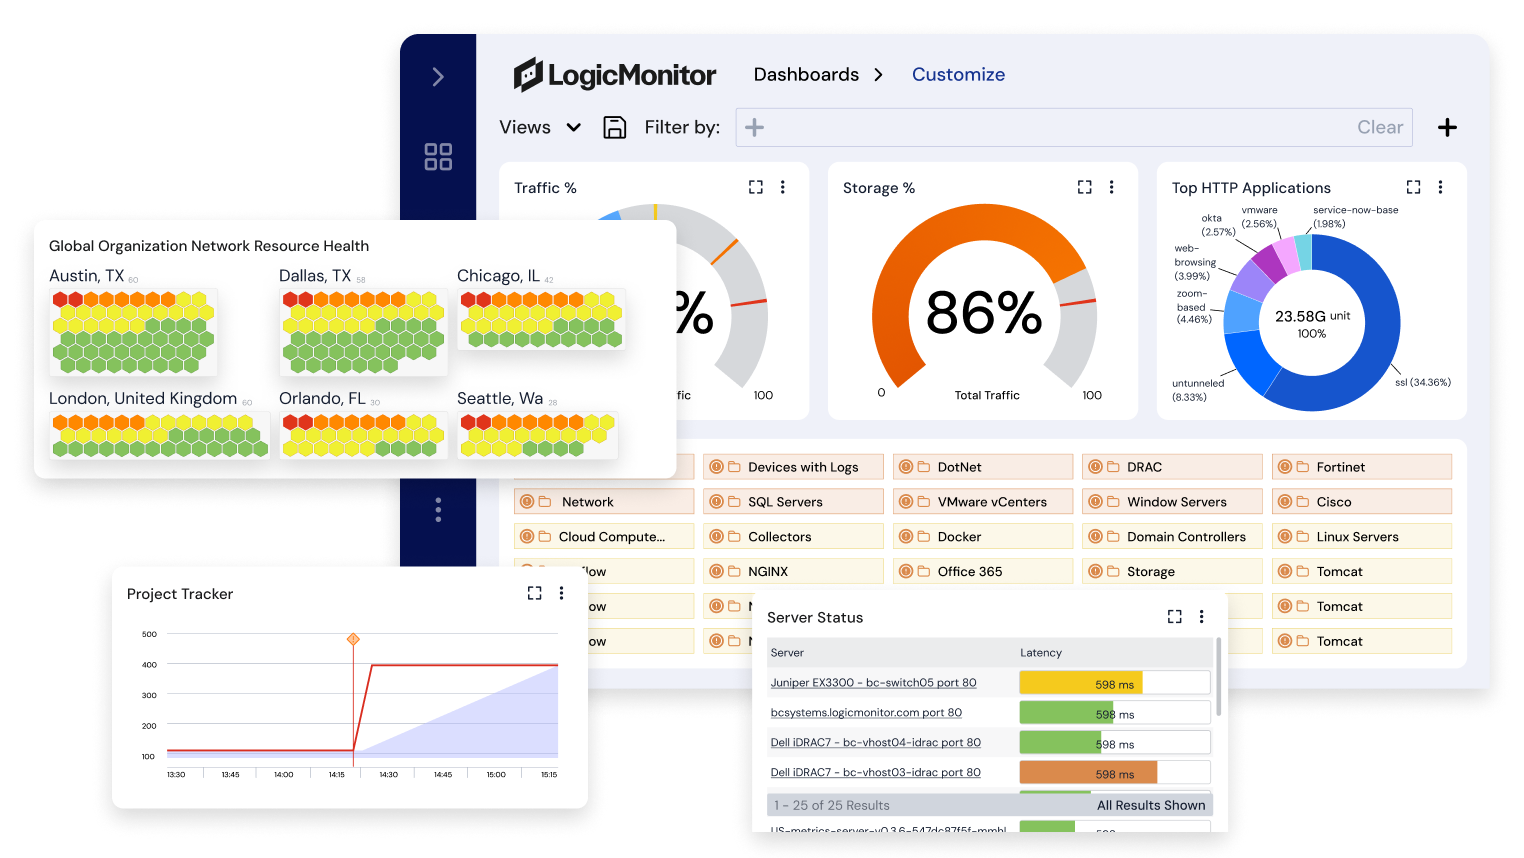
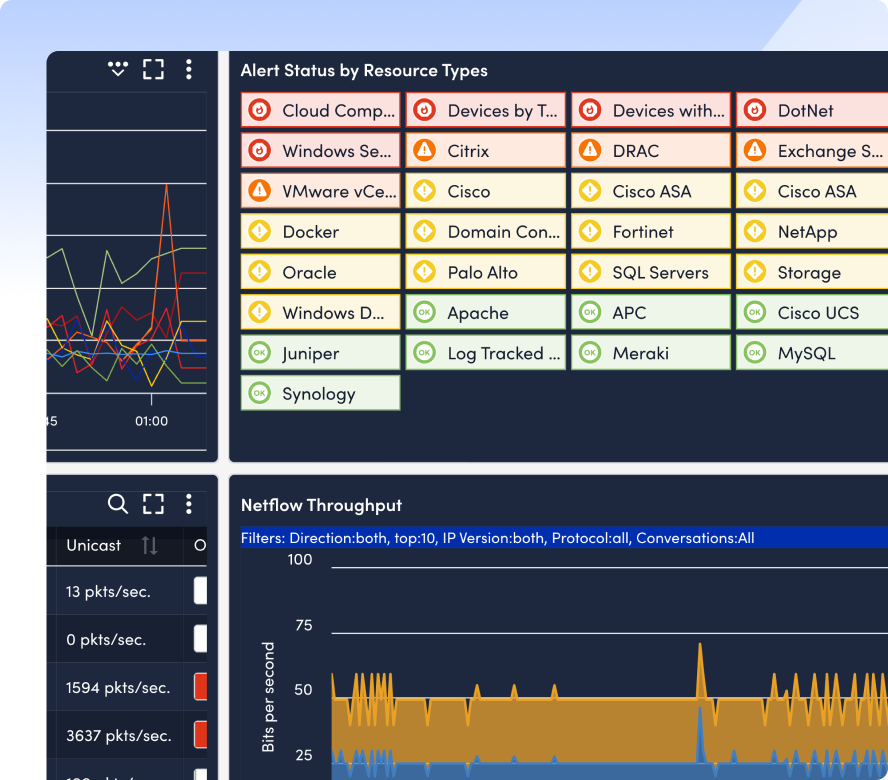
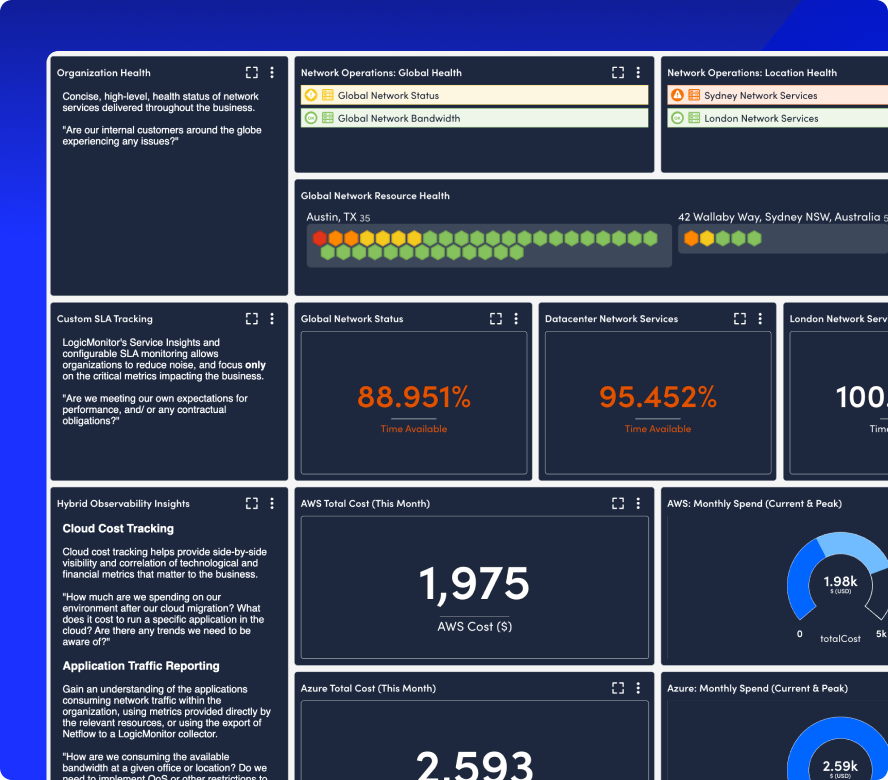
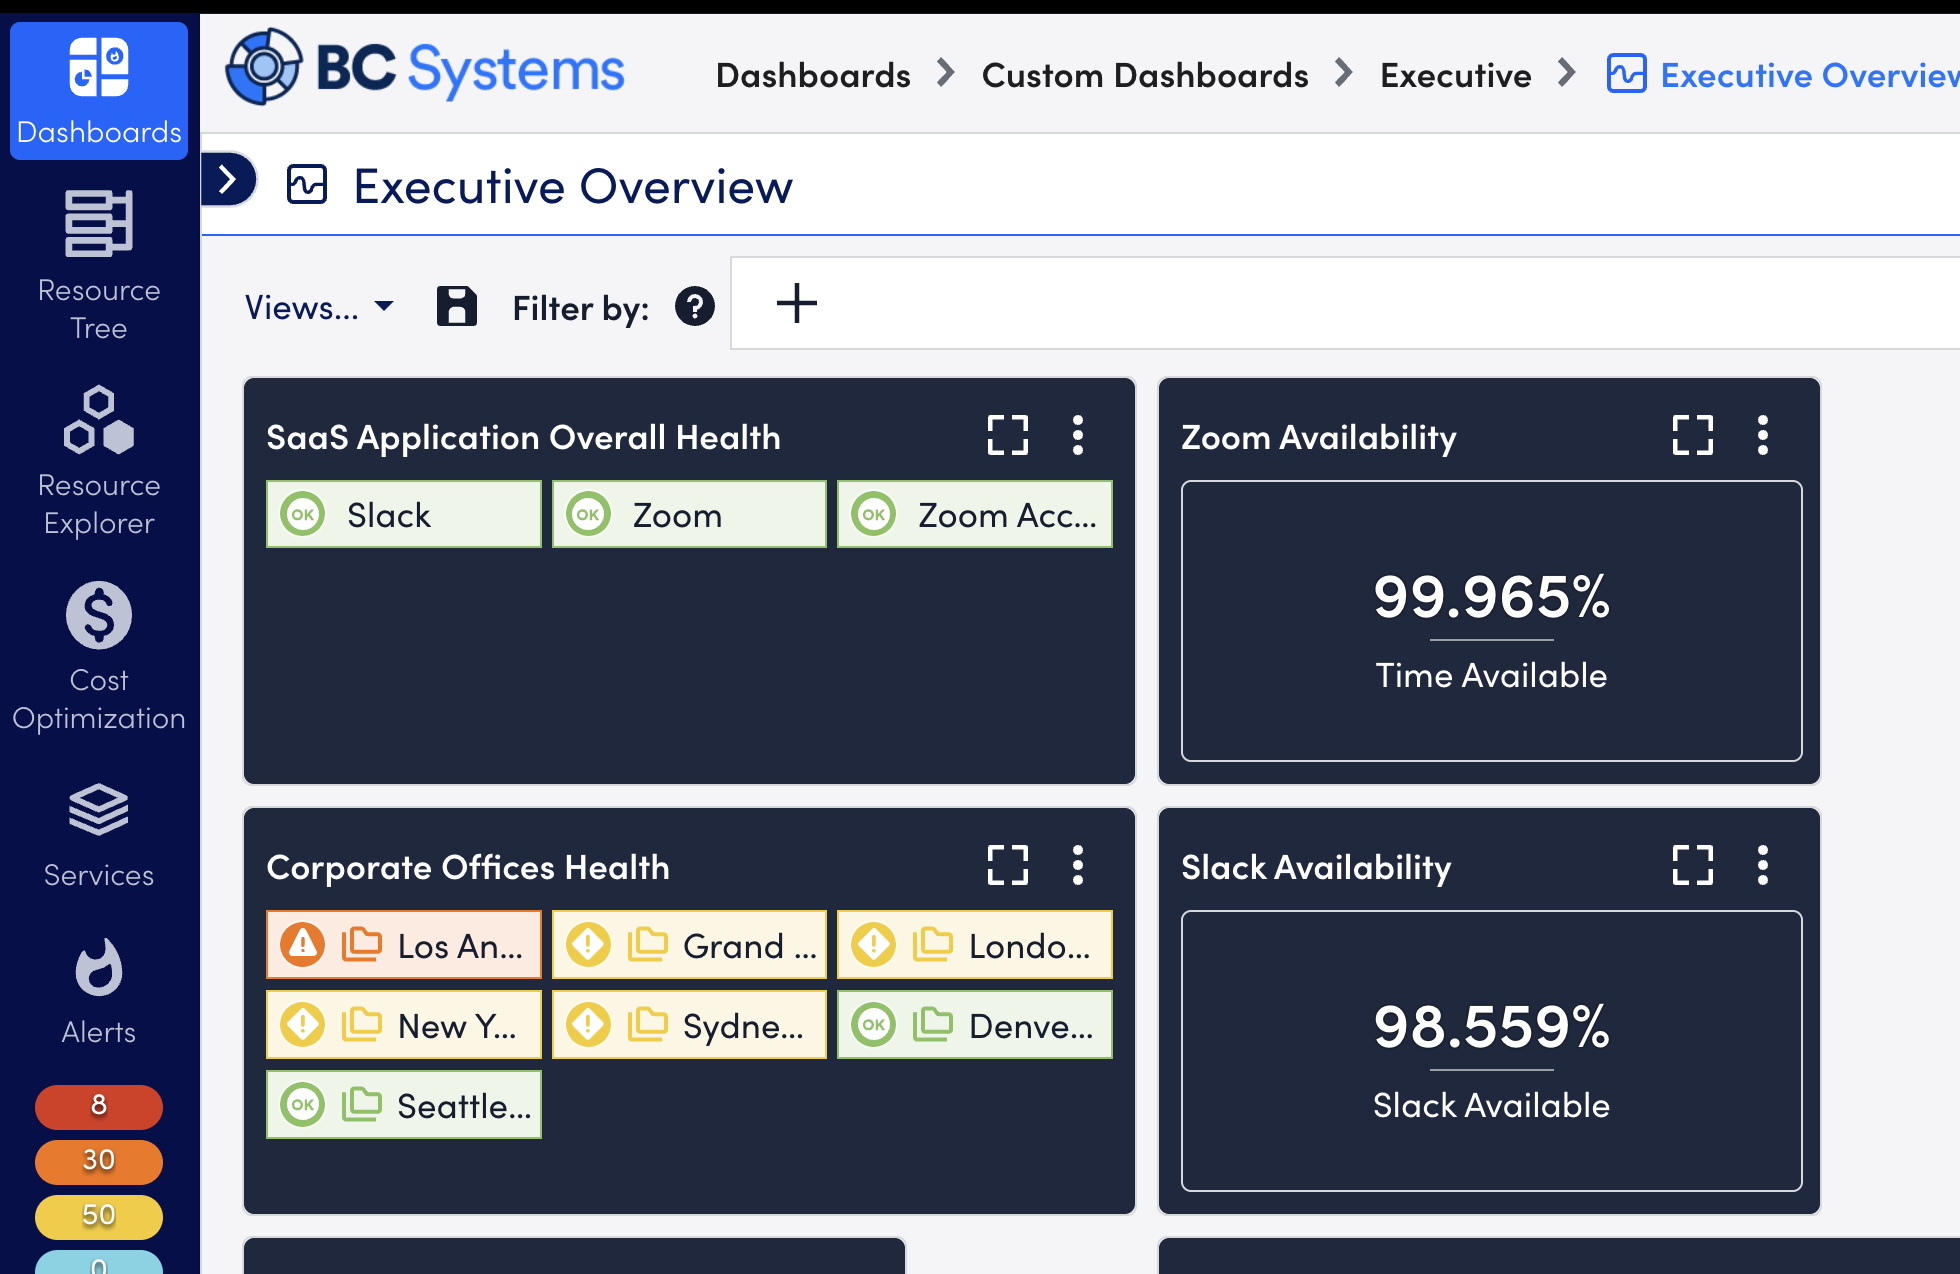
Build dashboards and reports for every team
Create custom views for operations, leadership, or customers, then automate reporting to keep everyone informed.
Create dashboards by role and functionCustomize visualizations for the NOC, execs, or external stakeholders with metrics that matter to them.
Send scheduled reports automaticallyShare recurring PDFs or CSVs with uptime, usage, and availability metrics tailored to each audience.
INTEGRATIONS
Works with everything that keeps you connected
Whether it’s switches, routers, firewalls, or cloud-based edge devices, LM Envision connects it all. With 3,000+ out-of-the-box integrations and full API support, you get deep insights without a heavy lift.
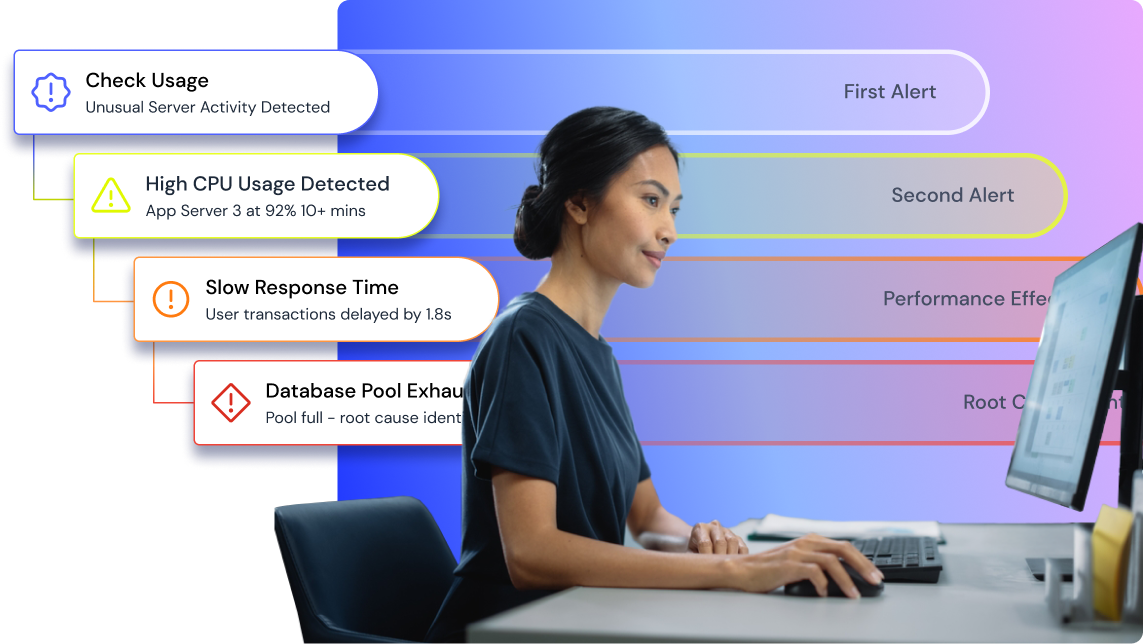
Edwin AI correlates logs, metrics, and topology to pinpoint root causes across your network, before users feel the impact. Just ask, and Edwin explains issues in plain language, so your team can respond instantly.
La tarification de LogicMonitor est simple, prévisible et liée à la valeur métier, pour une surveillance moderne à toute échelle. Étendez la visibilité et la disponibilité sur l’ensemble de votre environnement hybride et multicloud avec LogicMonitor.
*Des remises sur volume sont disponibles.
Tarification flexible pour une observabilité hybride complète
Tarification claire et évolutive pour une visibilité complète sur votre infrastructure hybride.
Surveillance de l’infrastructure
Bénéficiez d’analyses prédictives et d’un dépannage intelligent sur les serveurs, machines virtuelles, SD-WAN, stockage, réseau, et plus encore.
Prix catalogue
22 USD
*Par ressource/mois, remises sur volume disponibles
En savoir plus
Surveillance du cloud IaaS
Prenez davantage de contrôle et de visibilité sur vos ressources cloud, y compris AWS EC2, Azure VM, Azure Scale Sets VM, GCP Compute Engine, et plus encore.
Prix catalogue
22 USD
*Par ressource/mois, remises sur volume disponibles
En savoir plus
Points d’accès sans fil
Surveillez et recevez des alertes sur les indicateurs essentiels de santé et de performance du réseau sans fil pour Juniper Mist, Cisco Meraki, Extreme Networks, HPE Aruba Networking Central, Ubiquiti UniFi, et plus encore.
Prix catalogue
4 USD
*Par ressource/mois, remises sur volume disponibles
En savoir plus
Surveillance du cloud PaaS et des conteneurs
Consultez les métriques des fournisseurs cloud pour les charges de travail basées sur le calcul, y compris AWS, Azure, GCP, Kubernetes, bases de données MongoDB Atlas, Docker, et plus encore.
Prix catalogue
3 USD
*Par ressource/mois, remises sur volume disponibles
En savoir plus
Tarification par couches pour l’IA
Tarification flexible pour une surveillance pilotée par l’IA et un dépannage avancé.
Des analyses puissantes et contextuelles accompagnant les métriques d’infrastructure pour un dépannage rapide.
Prix catalogue: 2,50 USD
*Par Go/mois pour une conservation de 7 jours
Prix catalogue: 4 USD
*Par Go/mois pour une conservation de 30 jours
Prix catalogue 5,50 USD
*Par Go/mois pour une conservation de 90 jours
Prix catalogue 7 USD
*Par Go/mois pour une conservation d’un an
En savoir plus
Edwin AI
Bénéficiez d’une résolution intelligente des problèmes pilotée par l’IA et d’analyses proactives adaptées à vos opérations informatique.
Découvrez Edwin
*Facturation annuelle. Prix valables uniquement aux États-Unis. Des remises sur volume sont disponibles pour l’ensemble de nos produits.
Produits supplémentaires
Y compris des fonctionnalités telles que la surveillance synthétique, les traces et la surveillance des applications SaaS.
Surveillance synthétique
Enregistrez des tests de navigation automatisés, téléversez des transactions synthétiques en plusieurs étapes représentant des parcours utilisateurs critiques, et exécutez-les à intervalles définis.
Traces d’application
Collectez, visualisez et analysez les données d’application basées sur OpenTelemetry.
Surveillance des applications SaaS
Surveillez les services de productivité couramment utilisés comme Salesforce, Zoom, Slack, et bien d’autres.
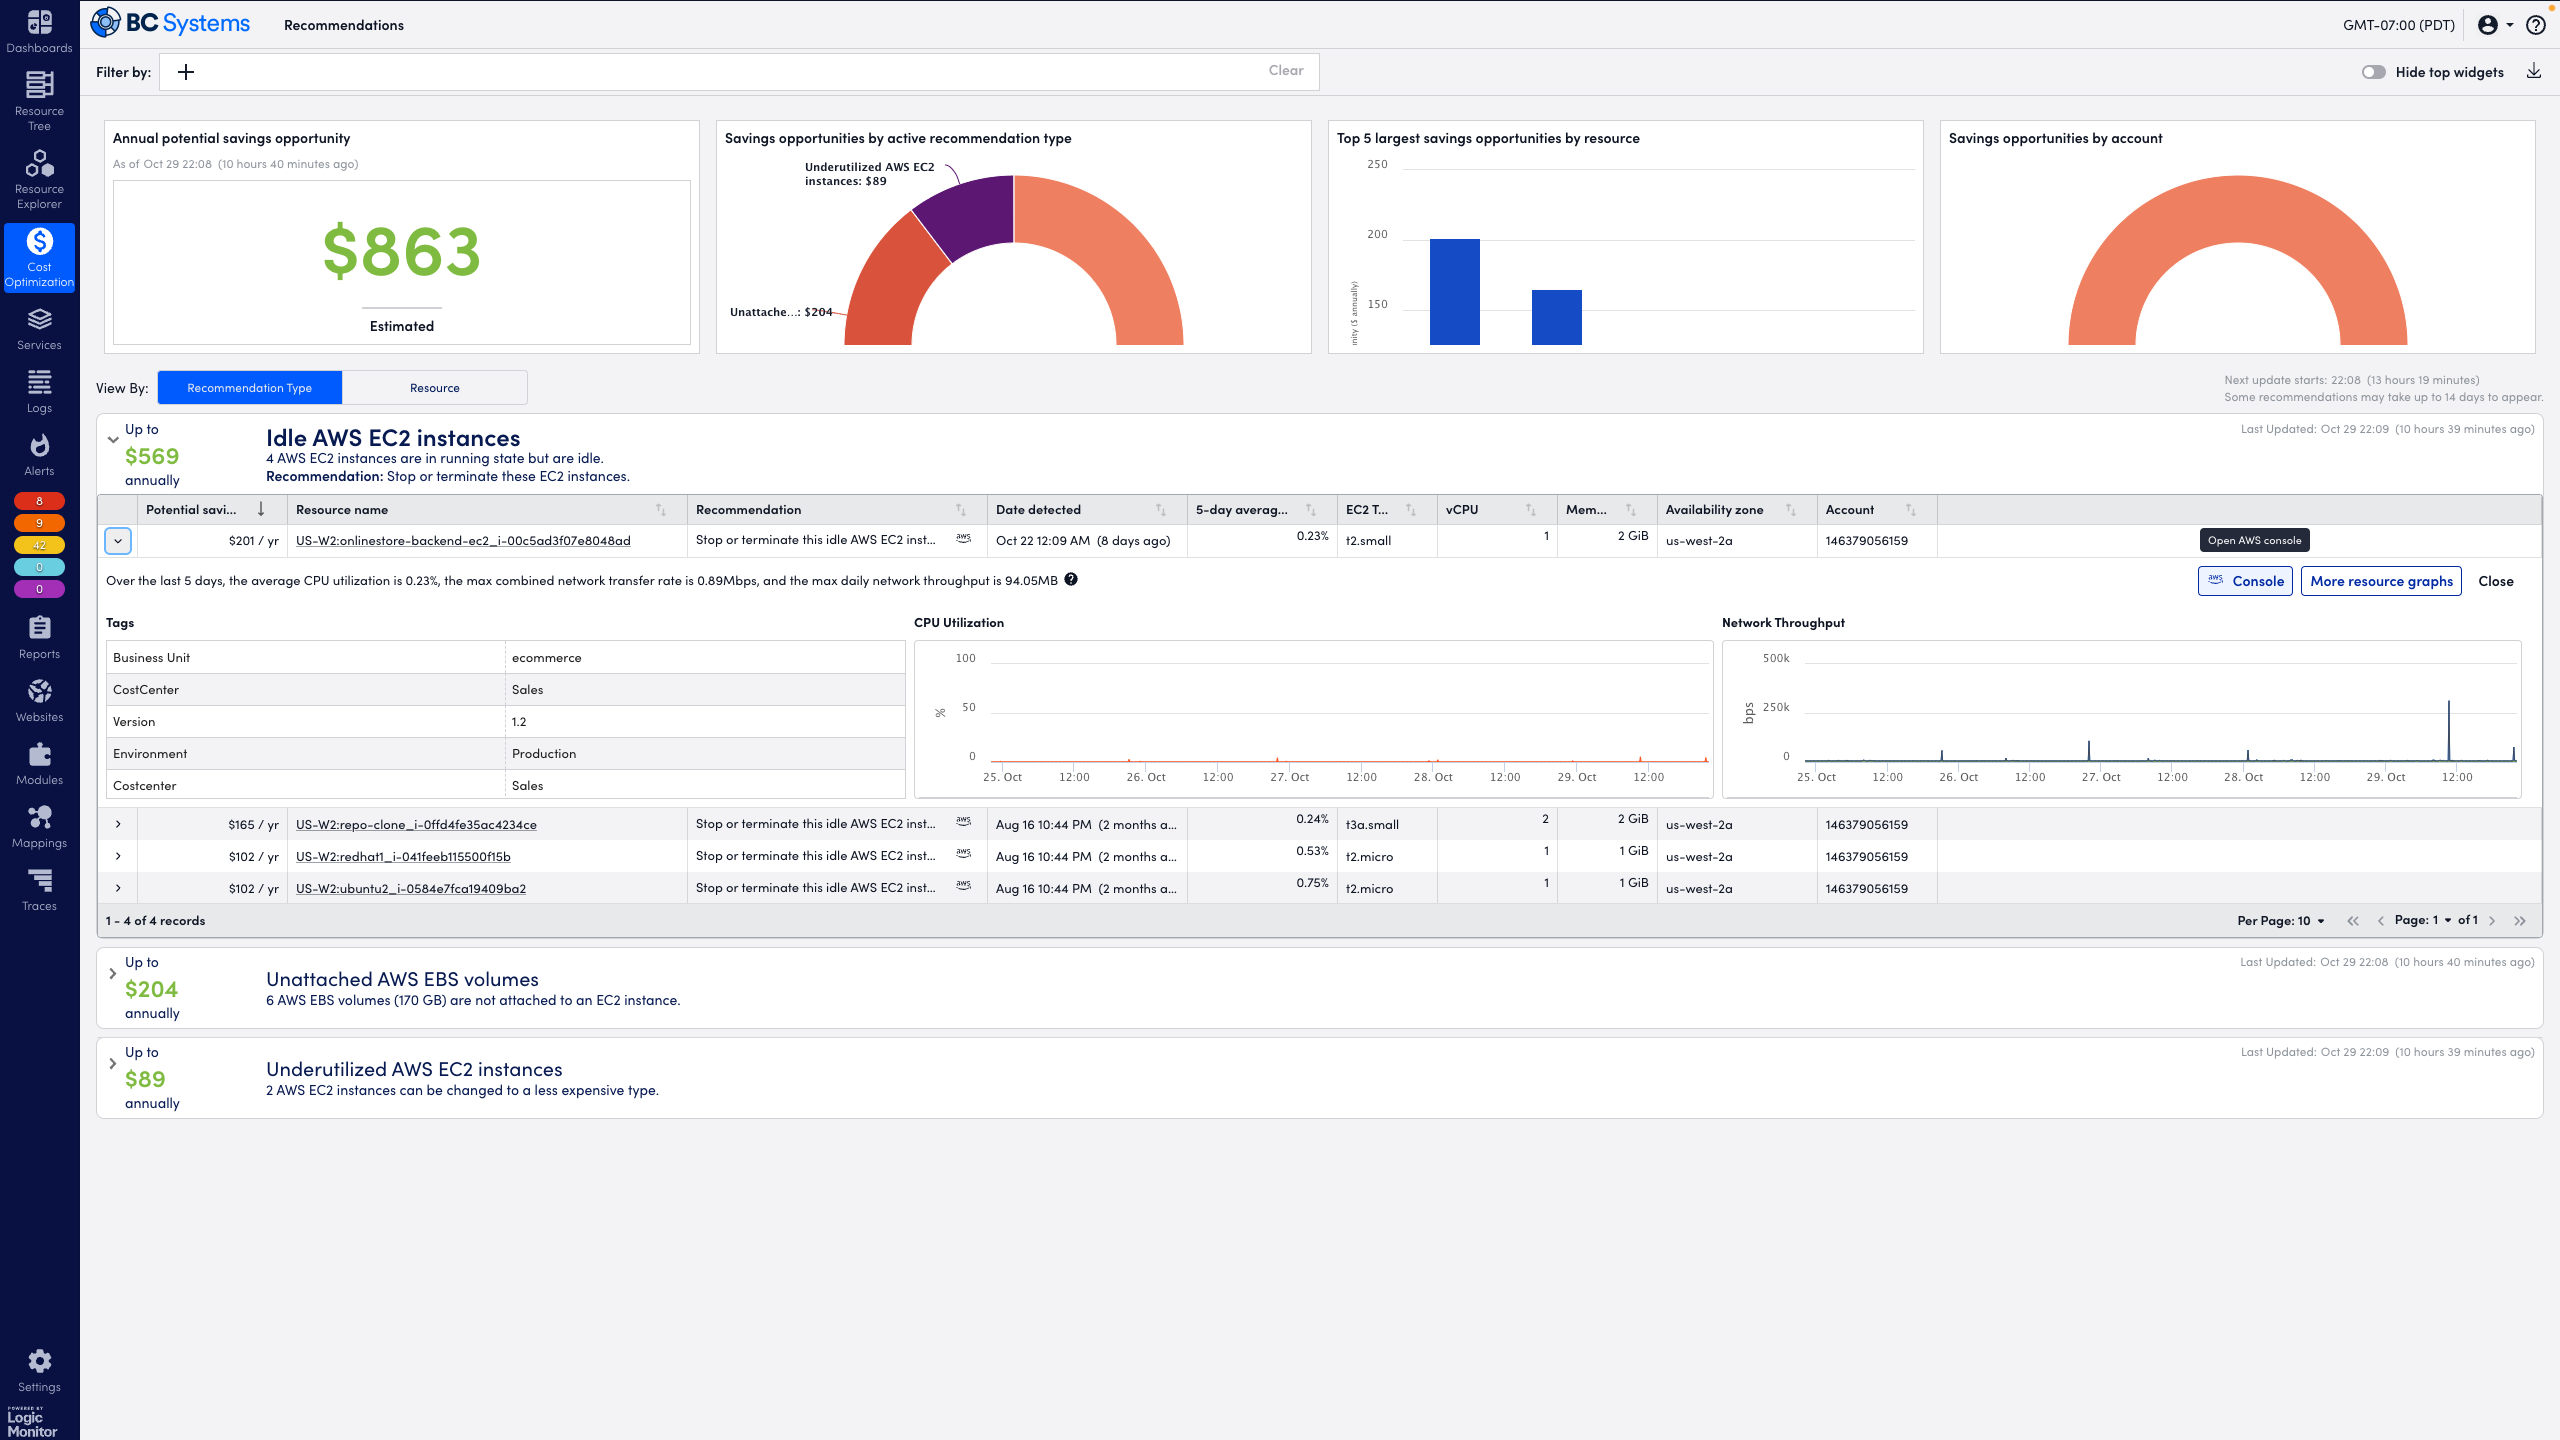
Optimisation des coûts
Équilibrez performance et coûts cloud grâce à une visibilité sur la facturation multicloud et des recommandations d’économies générées par l’IA.
Service client primé
Services professionnels
Accélérez la rentabilité grâce à un accompagnement personnalisé par les services professionnels LM.
En savoir plus
Formation client
Tirez le meilleur parti de LogicMonitor grâce à des sessions de formation en groupe ou privées.
Que se passe-t-il si un client dépasse son quota d’utilisation engagé?
Les clients qui dépassent leur quota d’utilisation engagé sont facturés 1,5 fois leur tarif contractuel.
Qu’est-ce qu’une ressource d’infrastructure à des fins de facturation?
Les ressources sont les composants qui constituent votre infrastructure sur site, comme les serveurs (physiques ou virtuels), le stockage et les réseaux. Sur la plateforme LogicMonitor, chaque ressource est représentée par une seule adresse IP de gestion (ou un nom DNS). Vos ressources peuvent se trouver à plusieurs emplacements physiques ainsi que dans le cloud.
Qu’est-ce qu’une ressource cloud à des fins de facturation ?
LogicMonitor simplifie la tarification cloud et la rend plus prévisible en ne comptabilisant que les ressources de calcul.
À des fins de facturation, LogicMonitor comptabilise les parties de vos charges de travail liées au calcul. Les ressources de calcul sont généralement connues et déployées de manière intentionnelle. Cela inclut des unités IaaS telles que les instances AWS EC2, Azure VM, Azure ScaleSet VM et GCP Compute Engine. L’unité IaaS cloud inclut la surveillance de jusqu’à 10 services cloud non liés au calcul, comme le stockage, le réseau, les pare-feux, les services d’équilibrage de charge, et plus encore.
Les ressources non liées au calcul sont plus difficiles à prévoir, c’est pourquoi elles sont incluses dans la licence de calcul.
Les services de calcul PaaS seront comptabilisés séparément à des fins de facturation. Cela inclut des services courants des fournisseurs cloud tels que ECS Cluster, AWS Lambda, Azure Virtual Desktop, GCP App Engine, les pods Kubernetes, et plus encore.
Les clients peuvent-ils ajouter une couverture de surveillance cloud supplémentaire à mesure que leur entreprise se développe ?
Oui. La couverture de surveillance pour 10 services IaaS cloud non liés au calcul est incluse avec l’achat de chaque unité Cloud IaaS. Pour surveiller un bloc supplémentaire de jusqu’à 10 services non liés au calcul, vous devrez acheter une unité Cloud IaaS supplémentaire.
Les clients peuvent-ils surveiller plusieurs fournisseurs cloud simultanément avec LogicMonitor ?
Les entreprises utilisent souvent des environnements multicloud pour répartir les ressources informatiques et réduire les risques d’interruption de service ou de perte de données. La plateforme LogicMonitor applique une stratégie de surveillance complète pour optimiser les performances globales du cloud. Elle offre aux utilisateurs une visibilité en temps réel, fondée sur les données, sur chaque composant potentiellement critique de leur déploiement cloud, à travers trois éléments fondamentaux : la surveillance des fournisseurs cloud, la surveillance des performances des ressources et une analyse détaillée du retour sur investissement. component of their cloud deployment through three fundamental elements: cloud provider monitoring, resource performance monitoring, and detailed ROI analysis.
La stratégie en trois volets de la plateforme LogicMonitor (surveillance des ressources, surveillance de la disponibilité des fournisseurs cloud et surveillance du retour sur investissement) ne dépend pas du fournisseur cloud. Actuellement, les services cloud pris en charge incluent Amazon Web Services, Microsoft Azure et Google Cloud Platform. En outre, la fonction de surveillance SaaS de LogicMonitor permet un suivi approfondi des applications SaaS telles qu’Office 365, Salesforce, Zoom, Slack, et bien d’autres.
Qu’est-ce qu’une ressource SaaS à des fins de facturation ?
La couverture de surveillance SaaS s’adapte à la taille de votre entreprise et dépend du nombre d’utilisateurs pour un service SaaS donné. Par exemple, la surveillance de Microsoft Office 365 est facturée en fonction du nombre d’utilisateurs M365 dans l’entreprise. La tarification est établie par utilisateur et par an.
Les traces APM sont mesurées en spans. Qu’est-ce qu’un span ?
Un span désigne une unité transactionnelle de travail effectuée dans un système, avec une heure de début et de fin. Il peut s’agir de fonctions, d’appels à une base de données, de scripts de démarrage, etc. Plusieurs spans reliés entre eux par des relations parent-enfant forment une trace.
Les synthetics APM sont mesurés en invocations. Qu’est-ce qu’une invocation synthétique ?
Une invocation synthétique correspond à l’exécution individuelle d’un test synthétique scripté avec Selenium. Les utilisateurs peuvent créer et téléverser leur propre test synthétique et définir un intervalle de sondage spécifique. Les tests synthétiques peuvent être exécutés simultanément depuis plusieurs emplacements et/ou navigateurs, ce qui génère des invocations supplémentaires.
Qu’est-ce qui est pris en compte dans le SKU Cloud PaaS ?
Le SKU LM Cloud PaaS fait partie de la solution de surveillance cloud de LogicMonitor. LM Cloud offre une visibilité approfondie sur les charges de travail cloud grâce à la découverte automatique, la collecte de métriques préconfigurées, des seuils d’alerte prêts à l’emploi, des tableaux de bord intégrés, et d’autres fonctionnalités de plateforme adaptées aux entreprises comme le contrôle d’accès basé sur les rôles (RBAC), le routage des alertes, etc. Avec le SKU PaaS, vous bénéficiez des métriques des fournisseurs cloud avec tous ces avantages pour vos charges de travail PaaS, intégrées au reste de votre environnement surveillé dans LogicMonitor.
Les ressources Cloud PaaS incluent :
AWS
ECS Cluster
Lambda
AppStream
CloudSearch
DocumentDB
ElastiCache
Glue
MSK (Brokers)
MQ
OpenSearch (anciennement ElasticSearch)
Redshift
RDS
Azure
App Service
Analysis Services
Data Factory
HDInsight
Function
Serveur de base de données MariaDB
Serveur de base de données MySQL
Serveur MySQL Flexible
Serveur de base de données PostgreSQL
Serveur PostgreSQL Flexible
Redis Cache
Instances SQL managées
Bureau virtuel
GCP
App Engine
Cloud Composer
Cloud Dataflow
Cloud Dataproc
Cloud Function
Cloud Redis
Cloud Run
Cloud SQL
Autres
Pods Kubernetes
Bases de données MongoDB Atlas
Qu’est-ce qui est pris en compte dans le SKU Cloud IaaS ?
Le SKU LM Cloud IaaS fait partie de la solution de surveillance cloud de LogicMonitor. LM Cloud offre une visibilité approfondie sur les charges de travail cloud grâce à la découverte automatique, la collecte de métriques préconfigurées, des seuils d’alerte prêts à l’emploi, des tableaux de bord intégrés, ainsi que d’autres fonctionnalités adaptées aux entreprises comme le RBAC (contrôle d’accès basé sur les rôles), le routage des alertes, etc. Le SKU IaaS inclut à la fois le collecteur cloud LM et le collecteur local LM, offrant une visibilité au-delà de ce que proposent les fournisseurs cloud — par exemple, des métriques au niveau du système d’exploitation et des applications.
Les ressources Cloud IaaS incluent toutes les machines virtuelles cloud prises en charge (AWS EC2, Azure VM, Azure ScaleSet VM, instances GCP Compute Engine), ainsi que toute ressource supplémentaire surveillée via un collecteur local LM. Pour chaque unité de SKU IaaS achetée, vous avez également le droit de surveiller 10 ressources cloud non liées au calcul.
Comment les clients peuvent-ils ajouter l’optimisation des coûts à leur environnement?
L’optimisation des coûts est proposée en complément de la surveillance LM Cloud et inclut à la fois les fonctionnalités de facturation cloud et de recommandations cloud. Elle est disponible au prix catalogue de 6 USD par licence de surveillance Cloud IaaS. Les clients doivent disposer d’au moins 200 licences de surveillance Cloud IaaS pour pouvoir en bénéficier.
Contactez-nous
Commencez votre aventure avec LogicMonitor dès aujourd’hui
Nos experts sont prêts à vous accompagner, que vous exploriez l’observabilité pilotée par l’IA ou que vous soyez prêt à optimiser votre environnement hybride.