
Microservices Monitoring Strategies and Best Practices
Microservices multiply both deployment speed and failure surface. Here is the monitoring strategy that keeps distributed systems visible and reliable.


Denton Chikura
The quick download:
Microservices do not reduce complexity; they distribute it. Without the right monitoring strategy, that complexity becomes invisible until something breaks.
-
In distributed systems, a single user request can touch dozens of services; distributed tracing is what makes that journey visible and debuggable.
-
Service mesh telemetry, container-level metrics, and application-level logs each tell part of the story; teams that rely on only one layer are flying partially blind.
-
Alert on service-level objectives tied to user experience, not on individual microservice health checks. The goal is a working product, not a green dashboard.
-
Build observability into each microservice at deployment, not as a retrofit. The cost of instrumenting later compounds with every service you add.
AIn the landscape of modern software architecture, the shift from monolithic systems to microservices has been revolutionary. Yet, with this transition comes the complexity of monitoring numerous smaller, interdependent services.
Effective microservices monitoring ensures optimal performance, swift problem resolution, and overall system robustness, which is pivotal for today’s digital businesses. Simply put, it’s like zooming in closely to see an entire picture and every tiny dot that makes it up. In a microservice architecture, each microservice can be considered a small, independent component of a larger system. Each microservice requires monitoring for specific characteristics such as response time, error rates, and resource usage for overall system health.
This article explores microservices monitoring strategies and best practices for enhanced efficiency and effectiveness.
Summary of key microservices monitoring concepts
| Microservices monitoring strategies | Summary |
|---|---|
| Emphasize granularity in individual service monitoring | Implement detailed monitoring at the individual service and transaction levels using OpenTelemetry or an alternative monitoring tool. Analyze metrics such as response time and error rate to identify issues in user-facing services. |
| Balance detail with efficiency | Apply selective and intelligent monitoring, using adaptive sampling to vary the level of detail based on the system state. |
| Dynamically adjust monitoring | Utilize IaaC and configuration management tools to script automated changes in monitoring levels based on certain conditions. |
| Prioritize anomaly detection | Implement monitoring for key user journeys and employ real-time data analysis with tools like Apache Kafka to detect and address anomalies quickly in microservices architectures. |
| Monitoring for capacity planning and infrastructure scaling | Analyze performance data to identify trends and inform capacity planning. Use predictive analysis and configure auto-scaling based on metric thresholds. |
| Comprehensive security monitoring | Secure each microservice by auditing endpoints, setting up WAFs, conducting regular security testing, and using machine learning for dynamic threat detection. |
| Integration of service mesh | Implement a service mesh like Istio for enhanced management and observability. Collect metrics such as request and error rates, and use the mesh for traffic control and management. |
Traditional vs. microservices monitoring
Traditional application monitoring typically focuses on overall server health, database performance, and application uptime, examining the system as one unified entity. For instance, it might track how long a webpage takes to load or if a database is accessible. In contrast, microservices monitoring delves into each independent service of a similar website: the product catalog, user authentication, payment processing, etc.
Monitoring practices have had to evolve significantly in transitioning from traditional to microservices architecture. Every microservice potentially runs in different environments and requires individual health checks. This shift demands tracking the performance of each service and understanding how they communicate and affect each other. While traditional monitoring might tell you that the website is down, microservices monitoring pinpoints that the issue originates specifically from the payment service failing to communicate with the user authentication service. It requires more sophisticated tools like distributed tracing.
| Aspect | Traditional monitoring | Microservice monitoring |
|---|---|---|
| Architecture | Monolithic components are interconnected and interdependent. | Decentralized, composed of small, independent services. |
| Focus | On larger, singular application systems. | On multiple, smaller, and independent services working together. |
| Complexity | Relatively simpler, with fewer moving parts. | Higher due to numerous services and interactions between them. |
| Scale | Scalability is often limited to the entire application. | Scalability at the level of individual services. |
| Data collection | Aggregated from the entire application. | Aggregated on a per-service basis, often with more granular data. |
| Monitoring tools | Traditional APM tools focused on server and application health. | Tools that support dynamic, distributed tracing, and real-time analysis. |
| Error Detection | May take longer due to its monolithic nature. | Faster due to independent services and granular monitoring. |
| Visibility | Overview of application performance and issues. | Detailed insights into the performance and issues of each service. |
| Traceability | Traces are typically within the confines of a single application. | Traces span across multiple services, requiring distributed tracing. |
An overview of the monitoring process
Monitoring collects data on performance metrics that serve as benchmarks to ensure the services operate within desired parameters. It’s vital to monitor each service’s performance meticulously. The process is as follows
● For each microservice, identify key performance indicators (KPIs) such as response time, error rate, and throughput.
● Track the performance over a period to establish a baseline.
● Based on the baseline and SLOs, set thresholds for performance metrics.
Metrics should align with the business goals and user experience objectives. For instance, observe the average response time of a microservice over a week. If the average response time of a service is 100ms, you might set a warning alert at 120ms and a critical alert at 150ms.
Collect data consistently across all services to analyze patterns and trends in the metrics. Look for deviations or anomalies that might indicate underlying issues. Use dashboards that provide a unified view of all microservices and their performance metrics.
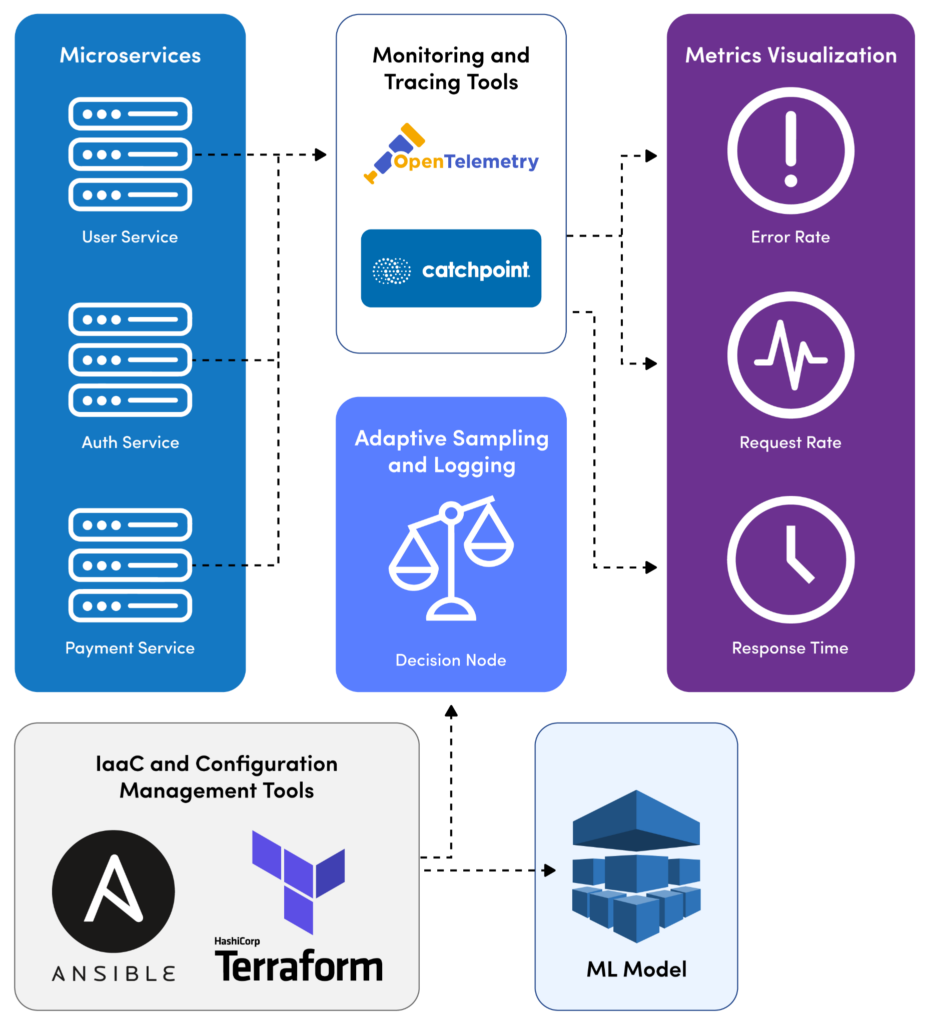
The above representation depicts a microservices monitoring ecosystem that works as follows.
● Microservices are integrated with monitoring tools OpenTelemetry and Catchpoint (now a LogicMonitor company) for data collection and analysis.
● Metrics and traces from these services are channeled through an adaptive sampling and logging mechanism controlled by decision-making processes.
● Configuration management tools Ansible and Terraform are utilized to manage the monitoring infrastructure.
● A machine learning (ML) model is incorporated for advanced data analysis.
The outcome of these processes is visualized, displaying key performance metrics like error rate, request rate, and response time to monitor the health and efficiency of the microservices architecture.
The role of distributed tracing in microservices monitoring
Distributed tracing provides clear visibility into how requests traverse various services.
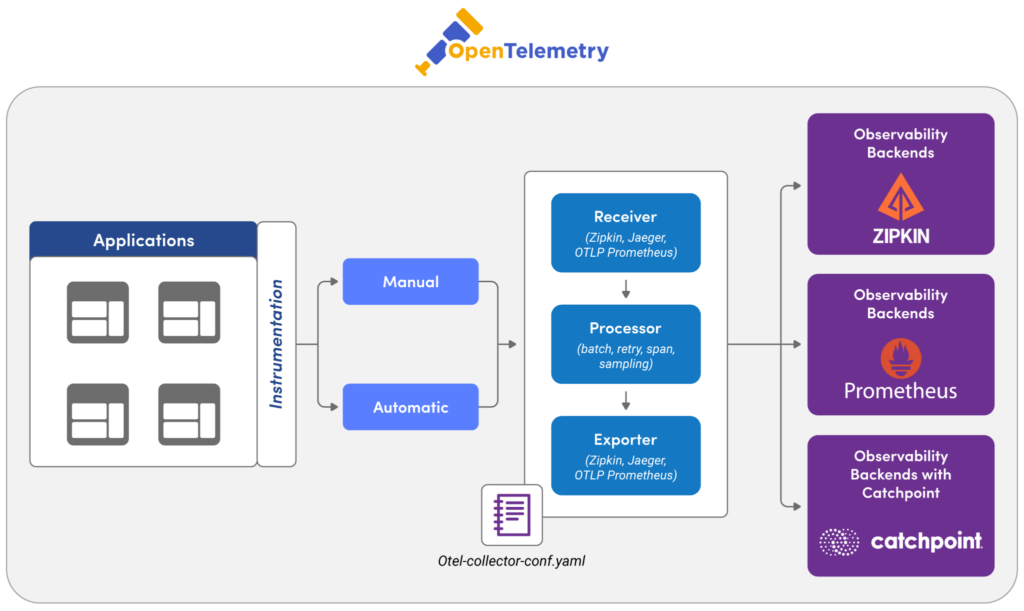
Start by choosing a tracing system compatible with your technology stack. Once a tool is chosen, the next step is to instrument your application. Libraries like OpenTelemetry provide APIs and SDKs for various languages, allowing you to annotate and track requests as they move through your services. Ensure that each request carries a unique identifier passed across service boundaries. This identifier, often called a “trace ID,” helps in stitching together the entire path of the request across various services. Tracing tools typically aggregate data in a backend system, where it can be analyzed. The choice of the backend (e.g., Elasticsearch, Apache Cassandra, Clickhouse, Hydrolix) depends on factors like scalability, query capability, and existing infrastructure.
Consider an online shopping application composed of multiple microservices: User Authentication, Product Catalog, Shopping Cart, and Checkout. By implementing distributed tracing, each user request receives a unique trace ID, from login to checkout. As the request moves through each service, spans (individual units of work, like querying a database or calling an external API) are recorded with this ID. If a user experiences a delay during checkout, engineers can trace the exact request path to identify the service causing the lag and focus their debugging efforts.
Example code
The code sample below adds a Google Cloud Trace.
Open the **pom.xml** file in the Java Application and add below dependency:
<dependency>
  <groupId>com.google.cloud.opentelemetry</groupId>
  <artifactId>exporter-trace</artifactId>
  <version>0.15.0</version>
</dependency>
Open you Java code and add below snippet to Create spans
TraceExporter traceExporter = TraceExporter.createWithConfiguration(
TraceConfiguration.builder().setProjectId("MY_PROJECT").build());
private static OpenTelemetrySdk setupTraceExporter() {
// Using default project ID and Credentials
TraceConfiguration configuration =
TraceConfiguration.builder().setDeadline(Duration.ofMillis(30000)).build();
SpanExporter traceExporter = TraceExporter.createWithConfiguration(configuration);
// Register the TraceExporter with OpenTelemetry
return OpenTelemetrySdk.builder()
.setTracerProvider(
SdkTracerProvider.builder()
.addSpanProcessor(BatchSpanProcessor.builder(traceExporter).build())
.build())
.buildAndRegisterGlobal();
}
private static void myUseCase(String description) {
// Generate a span
Span span =
openTelemetrySdk.getTracer(INSTRUMENTATION_SCOPE_NAME).spanBuilder(description).startSpan();
try (Scope scope = span.makeCurrent()) {
span.addEvent("Event A");
// Do some work for the use case
for (int i = 0; i < 3; i++) {
String work = String.format("%s - Work #%d", description, (i + 1));
doWork(work);
}
span.addEvent("Event B");
} finally {
span.end();
}
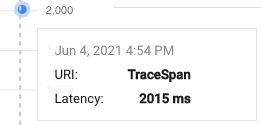
}Start your application and hit the endpoint, you will see output like below in Cloud Trace.
Best practices in microservices monitoring
Next let’s look at the top six strategies for microservices monitoring success.
#1 Emphasize granularity in individual service monitoring
Implement monitoring at the level of individual services and transactions using tools that offer transaction tracing capabilities to track the journey of a request across microservices.
Consider a user-facing service experiencing increased latency. By examining distributed tracing reports and specific metrics like average response time (calculated as total time taken / total number of requests) and error rate, engineers can quickly discover whether the issue originates from the service itself or downstream dependencies. A sudden spike in average response time and an increased error rate can indicate service-specific bottlenecks. Metrics to measure include:
● Request rate: Number of requests per unit time, indicating the load.
● Error rate: The percentage of all requests that result in an error (Error Rate = Total Errors / Total Requests * 100).
● Response time: Time taken to return a response, an indicator of service speed.
For instance, if a payment processing service shows a consistently high error rate, it might suggest issues like API errors or service timeouts, necessitating a deeper investigation into API health, database response times, or other downstream services/APIs.
#2 Balance detail with efficiency
Implement selective monitoring and intelligent data collection to maintain system efficiency without compromising the quality of insights. Implementing adaptive sampling for trace data can help. In periods of normal operation, sample a smaller percentage of traffic for detailed tracing (e.g., 1-5%). Increase this rate during anomalies or high-error states to capture more data for analysis.
Consider a user authentication service that logs only essential information (e.g., INFO level) and collects aggregated performance metrics in normal conditions. However, if an anomaly like a sudden increase in response time is detected, the service automatically switches to a more detailed logging level (e.g., DEBUG). The monitoring team can diagnose the issue without sifting through excessive logs during normal operations.
#3 Dynamically adjust monitoring based on conditions
Use infrastructure as a code (IaaC) and configuration management tools (e.g., Terraform, Ansible) to script and automate the conditions under which monitoring levels should change.
For e.g. in an e-commerce application, the checkout service is monitored for standard metrics like throughput and error rates. A machine learning model running on the monitoring data detects an anomaly i.e. a sudden drop in throughput, and triggers an alert. This alert then initiates a script that increases the granularity of logging and tracing for the checkout service, enabling rapid diagnosis and issue resolution.
#4 Prioritize anomaly detection
Anomaly detection in microservices monitoring is crucial for maintaining system reliability and user satisfaction. By detecting irregularities in system behavior or performance early, you can proactively address issues before they escalate into significant problems, affecting user experience or system stability.
Start by mapping out the critical user journeys within your application, such as sign-up, login, checkout, etc. Understanding these paths helps in prioritizing which microservices need closer monitoring. Implement a monitoring solution that captures key performance indicators (KPIs) across all services. This goes beyond error rates and response times to include more granular metrics like transaction volume, user concurrency, etc.
Use streaming data processing frameworks like Apache Kafka and Apache Flink for real-time data analysis. By analyzing data streams, you can correlate anomalies across different services in real time, quickly understanding their impact on overall system health.
Integrate diagnostic tools within each microservice to effectively drill down into anomaly origins. This involves setting up detailed logging and tracing systems that can be activated on-demand or in response to specific anomaly triggers.
Example
Consider an e-commerce platform with microservices for user authentication, product search, inventory management, and payment processing. An anomaly detection system might spot an unusual spike in error rates in the payment processing service. The system automatically initiates a deep trace, collecting extensive logs and performance metrics at a granular level. These logs include detailed information about database queries, external API calls, and internal processing steps. The detection also triggers alerts, so engineers can promptly analyze the data and pinpoint the exact step where the issue occurs, whether it’s a slow database response or a failed external API interaction.
#5 Use performance monitoring for capacity planning and infrastructure scaling
Start by analyzing current and historical performance data of your microservices to identify usage patterns and growth trends. Look at the long-term trends in metrics like CPU usage, memory demands, and network I/O. Identify peak usage times and normal operating baselines.
You can then use predictive analysis to forecast future capacity requirements. Tools like Google Cloud’s AI Platform can assist in predicting future traffic based on historical data. Predictions can further be used to configure auto scaling policies in cloud environments. For example, initiating a new service instance when CPU utilization remains over 70% for a certain period. The targeted approach to scaling is more efficient than scaling the entire application stack.
#6 Integrate a service mesh for enhanced microservice management and observability
Incorporating a service mesh into a microservices architecture can revolutionize how traffic management and observability are handled. This integration not only improves visibility into the performance and health of each microservice but also offers advanced control over inter-service communications.
Start by selecting a suitable service mesh platform, like Istio, that integrates easily with existing monitoring solutions. Deploy the service mesh across your microservices. This typically involves installing a sidecar proxy (like Envoy) alongside each microservice, which handles all network communications.
Configure the service mesh to collect and export metrics relevant to each service’s performance and health. Ensure these metrics are fed into your monitoring tools. Once you are set up, you can:
● Access granular data about service interactions.
● Experiment and optimize these interactions with service mesh traffic control features
● Pinpoint errors and their sources quickly via the service mesh’s logging and tracing capabilities.
For instance, you can use Istio’s telemetry features to understand the latency introduced by specific service paths or to trace request flows through the network. Techniques like canary deployments or A/B testing can be managed directly through the service mesh, monitoring how changes impact your key metrics.
Microservices monitoring for security
In the microservices paradigm, where services are loosely coupled yet function cohesively, the necessity of securing individual components and interactions become more essential.
Begin by auditing all exposed endpoints of each microservice. Document the nature (REST, GraphQL, etc.), purpose, and existing security measures of these endpoints. You can then implement Web Application Firewalls (WAFs) and network firewalls customized to each endpoint’s specific needs. This should be followed by setting up custom security rules based on the endpoint’s usage patterns and vulnerability assessments. Regularly update and refine firewall rules and network policies based on evolving threat landscapes.
Implement continuous security monitoring by integrating Intrusion Detection Systems (IDS) and Intrusion Prevention Systems (IPS) that are customized for microservices architecture. Use network segmentation, TLS encryption for data in transit, and robust authentication & authorization mechanisms for each service interaction.
Metrics to monitor may include:
● Count and type of security incidents detected within inter-microservice communications (e.g., unauthorized access attempts, data leaks).
● Latency and throughput metrics, indicating the impact of security measures on inter-service communication.
● Rate of successful vs failed intrusion attempts.
● Frequency and nature of policy updates and rule changes in response to detected threats and vulnerabilities.
● Incident response time for detected threats.
● Percentage of traffic flagged as suspicious or malicious.
● Compliance rate with predefined security standards and protocols.
Conclusion
In the dynamics of microservices architecture, monitoring forms the backbone of operational excellence, ensuring services run optimally and issues are quickly addressed. Key metrics such as request rate, error rate, and response time are vital for identifying issues like bottlenecks or service timeouts. LogicMonitor offers deep insights into request pathways across services. Ultimately, microservices monitoring strategies and best practices reflect an overarching goal: to improve the robustness, efficiency, and security of digital businesses in an increasingly service-oriented world.
NEWSLETTER
Subscribe to our newsletter
Get the latest blogs, whitepapers, eGuides, and more straight into your inbox.
SHARE
CHAPTERS
- API monitoring tools: must-have features for the modern API landscape
- REST API vs. GraphQL: Key Considerations for API Monitoring and Development
- API Performance Monitoring: Key Metrics and Best Practices
- API Gateway Timeout: Causes and Solutions
- API Performance Testing: Key Considerations for Modern APIs
- Microservices Monitoring Strategies and Best Practices
- API Observability: Benefits and Strategies
- API Monitoring: Best Practices, Benefits and Solutions
- API Monitoring: Metrics, Challenges and Best Practices
- Web API vs. REST API: Comparing RESTful and Non-RESTful Web APIs
- API Architecture Patterns and Best Practices
- API Metrics: What and Why of API Monitoring
Trace requests across every microservice, in real time, at any scale.
LogicMonitor gives distributed teams end-to-end visibility across services, containers, and infrastructure, so failures never stay hidden across service boundaries.
FAQs
Why is monitoring microservices harder than monitoring monolithic applications?
In a monolith, a request executes in one process and generates one log stream. In microservices, a single user request may traverse dozens of services, each with its own logs, metrics, and potential failure points. Correlating those signals across service boundaries requires distributed tracing, centralised log aggregation, and service-level metric collection, none of which are necessary for a monolith.
What is a service mesh and how does it help with microservices monitoring?
A service mesh is an infrastructure layer that handles service-to-service communication. It automatically collects telemetry (latency, error rate, traffic volume) for every service interaction without requiring code changes. This provides consistent visibility across all services and is a powerful way to bootstrap observability in a large microservices environment without instrumenting each service individually.
What is an SLO and why does it matter for microservices monitoring?
A Service Level Objective is a measurable target for how a service should behave: for example, 99.9% of requests must complete in under 200ms. SLOs give monitoring a clear purpose: rather than alerting on every fluctuation, you alert when you are at risk of breaching the user-impacting threshold. In microservices, SLO-based alerting prevents the alert fatigue that comes from monitoring individual service metrics in isolation.
How should you handle monitoring when deploying microservices at high frequency?
Correlate all monitoring data with deployment metadata (service name, version, deployment timestamp) so you can instantly determine whether a performance change followed a specific release. Use feature flags and canary deployments to limit blast radius, and ensure your monitoring platform can segment data by version to compare performance before and after any given deployment.
© LogicMonitor 2026 | All rights reserved. | All trademarks, trade names, service marks, and logos referenced herein belong to their respective companies.