
API Monitoring: Metrics, Challenges and Best Practices
APIs underpin every modern application. When monitoring falls short, so does everything that depends on them. Here is the foundation you need.


Denton Chikura

The quick download:
Your APIs are only as reliable as your ability to see what is happening inside them, in real time, at every layer.
-
API monitoring is not optional for production systems. Every unmonitored API is a failure waiting to be discovered by a customer rather than your team.
-
Effective monitoring covers availability, latency, error rates, and payload correctness; checking one without the others creates dangerous blind spots.
-
Establishing baselines before setting thresholds is what separates meaningful alerts from alert fatigue.
-
Build monitoring into your API development lifecycle from day one; retrofitting observability into production systems is exponentially harder.
In today’s increasingly distributed applications, Application Programming Interfaces (APIs) are the linchpin for communication and collaboration between systems. Once considered a gateway to monolithic applications, today’s APIs have evolved to enable real-time communication between microservices within a single application, and facilitate exchange of data between third-party service providers across the internet.
API monitoring is the practice of closely observing the performance and behavior of APIs to ensure their reliability, availability, and overall performance. It is a crucial step in delivering quality user experiences and maintaining the integrity of software systems.
In this article, we discuss the significance of API monitoring and equip you with a deeper understanding of monitoring metrics, their implementation, and measurement techniques. By focusing on metrics such as response time, error rate, and saturation, you can proactively manage your APIs, identify issues, and appropriately deal with them before they escalate. Let’s dig into the discussion.
Summary of Key API monitoring concepts
| Concept | Description |
|---|---|
| API monitoring metrics | Response timeError rateLatencyThroughputRate limitingAvailabilitySaturation |
| Architecture-based API monitoring challenges | Monolithic—a single point of failureMicroservices—requests may pass between several APIs, making troubleshooting difficult.Serverless—debugging challenges |
| Troubleshooting | You can leverage monitoring data for test-driven development, ongoing maintenance, and troubleshooting. |
Key API monitoring metrics
We give some critical metrics in API monitoring below.
Response time
Response time is a measure of how long it takes an API to process a request and return a response. Fast response times ensure a positive user experience and maintain system reliability. There are several different aspects to response time, including:
| Response time | The time it takes for the API server to receive the first byte of data after the client sends the request |
|---|---|
| p50—50th percentile or median response time. | Response time for 50% of API requests in a given period. It is a good indicator of the typical response time a user can expect. |
| p90—90th percentile, | Response time for 90% of API requests in a given period. This metric helps in understanding the performance for the majority of users. |
| p95—95th percentile | Response time for 95% of API requests in a given period. Used to understand the performance under slightly heavier loads or to capture more outliers in response time |
| P99—99th percentile | Response time for 99% of API requests in a given period. Used for understanding the worst-case scenarios. |
| Time to first byte | The time it takes for the client to receive the first byte of data from the API server after it sends the request. |
| Time to last byte | The time it takes for the client to receive all the response data from the API server. |
The specific aspects of response time necessary for a particular API depend on the use case. For example, a medical device like a pacemaker has strict real-time requirements. A delay could lead to adverse health events for patients. In contrast, other applications like monthly financial reporting have less stringent requirements and don’t depend on real-time responses.
In either case, it is important to monitor the response of your API to ensure system reliability. Both API requirements and API use cases influence the decision to implement real-time monitoring with live traffic vs. historical monitoring once the traffic has moved through your API infrastructure.
Error rate
Error rate represents the percentage of erroneous responses compared to total responses generated by the API. It’s important to mitigate the error rate as much as possible because a high error rate has a detrimental impact on user trust, application stability, and growth.
Most common errors belong to the three categories below—but there may be some exceptions.
- Data errors,
- Network errors,
- Authentication errors.
Understanding the codes for each error and how to interpret them are essential to discovering the source and solution method. Please see the below table for common types of errors and their associated categories.
| Error Code | Category | Description |
|---|---|---|
| 400 Bad Request | Data | The request was malformed or did not contain the required info. |
| 404 Not Found | Data | The resource being requested by the client doesn’t exist. |
| 401 Unauthorized | Authentication | The client doesn’t have the necessary authorization to access the resource. |
| 403 Forbidden | Authentication | The client is authorized to access the resource, but the request wasn’t allowed. |
| 408 Request Timeout | Network | The client took too long to send the request. |
| 502 Bad Gateway | Network | The server is acting as a gateway to another server, and that server is not responding. |
| 504 Timeout | Network | The server is acting as a gateway to another server, and that server took too long to respond |
| 500 Internal Server Error | Server | The server encountered an unexpected error while processing the request. |
| 503 Service Unavailable | Server | The server is temporarily unavailable |
Latency
Latency measures the time delay between requests being initiated and the corresponding response being received. It significantly impacts response time and is critical for real-time data delivery.
Many factors can impact latency. For example, a VPN connection traversing the network for multiple internet service providers may introduce latency, which is difficult to diagnose without monitoring the segments of the end-to-end transaction path.
Usually, as APIs become more complex, latency increases because the APIs involve more steps and more data. As you extend the architecture of an API, it is essential to leverage test-driven development and reduce latency early on.
Throughput
Throughput quantifies the number of requests an API can handle within a specific time frame. Throughput also has a significant impact on response time. Maintaining optimal throughput is crucial to meeting users’ needs and preventing bottlenecks during high usage.
Rate limiting
Rate limiting is an important metric to consider for API monitoring and ensuring the security of an API. Rate limiting is a mechanism that controls the number of requests that a single client can make to an API. Limiting the number of requests per second prevents abuse from bad actors. It also mitigates attacks like path gaming attacks by limiting the opportunities for hackers to probe the API architecture.
Availability
Availability is a fundamental metric to include in API monitoring. It refers to the proportion of time an API remains operational and accessible. Maintaining high availability for your API is important to build trust with users and maintain a good reputation for your application or service.
Saturation
Saturation occurs when an API’s resources are fully utilized. It can harm both response time and availability. As your API gets closer to its saturation point, response time increases because the API may have to queue requests or reject them altogether.
Ideally, the operations teams determine the saturation point in advance by conducting load testing and increasing synthetic emulated transactions until they discover the systems’ breaking point. They would then set a threshold of transactions per minute (TPM) in their monitoring tool to alert when the system nears the peak.
API monitoring example in Python
You can use several Python open source libraries for API monitoring, including Requests, Locust, GRErequests, Pyperfect, Requests-Mock, Flask-Limiter, and Django-Ratelimit. In addition, software as a service (SaaS) tools like LogicMonitor that adhere to the OpenTelemetry framework, prevent vendor lock-ins, and save you the time to set up and maintain an API monitoring tool based on open-source projects.
Your exact API monitoring implementation depends on the needs and architecture of your API. Below is an example in Python of monitoring some of the key metrics discussed above. We implement it with the Requests open-source library.
import requests
import time

# API endpoint for fictional coffee shop website
api_url = "https://GreatfulGrounds.com/products"

# Number of requests to make
num_requests = 20

# Initialize variables for tracking metrics
total_response_time = 0
error_count = 0
successful_requests = 0

# Loop to make API requests
for _ in range(num_requests):
    start_time = time.time()
    response = requests.get(api_url)
    end_time = time.time()

    # Calculate response time
    response_time = end_time - start_time
    total_response_time += response_time

    # Check for errors
    if response.status_code != 200:
        error_count += 1
    else:
        successful_requests += 1

# Calculate average response time
average_response_time = total_response_time / num_requests

# Calculate error rate
error_rate = (error_count / num_requests) * 100

# Calculate throughput
throughput = num_requests / total_response_time

# Calculate availability
availability = (successful_requests / num_requests) * 100

# Print metrics
print(f"Average Response Time: {average_response_time:.4f} seconds")
print(f"Error Rate: {error_rate:.2f}%")
print(f"Throughput: {throughput:.2f} requests per second")
print(f"Availability: {availability:.2f}%")
Open source solutions have their limitations. It is better to use observability solutions that provide a set of dashboards, reports, and alerts as part of an integrated solution, and includes monitoring third-party services involved in the end-to-end transaction path, such as DNS, CDN, and internet service providers.
Another important capability is monitoring the end-user experience via both real user monitoring (RUM) and synthetic monitoring, which together provide visibility into what users actually experience in the application UI and validate key transactions even when no one is actively using the application.
By leveraging open standards such as the OpenTelemetry framework, these platforms can take advantage of community-maintained instrumentation for multiple programming languages and flexible collectors that receive, process, and export telemetry data to one or more backends, helping teams avoid vendor lock-in while still benefiting from an integrated solution..
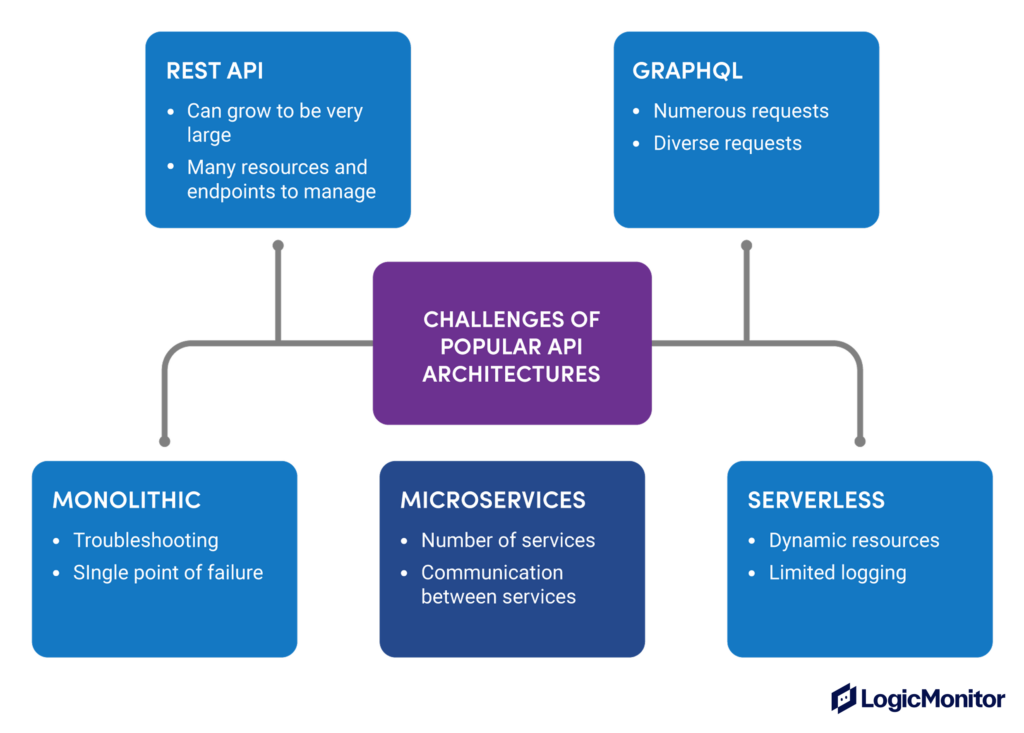
Architecture related API monitoring challenges
API architecture is very diverse and continues to expand due to the emergence of new technologies. Today’s most common architectures are monolithic, microservices, serverless, REST, and GraphQL APIs. Each of the architectures has its strengths and challenges.
Monolithic vs. microservices
Monolithic architecture consists of a single, self-contained system. While the simplicity makes monitoring more straightforward, managing its upgrade and uptime can be challenging. If a monolithic API fails in one part, the whole API will fail.
In contrast, the microservices architecture consists of a collection of small, independent services and is recognized as the reference architecture for applications that require large-scale and uninterrupted availability. The design offers more flexibility and horizontal scalability compared to monolithic systems. However, monitoring becomes more tedious because of the complex mesh of interdependent microservices communicating via local APIs. The APIs are typically containerized and orchestrated using Kubernetes and service mesh frameworks like Istio. You can learn more about the transition from monolithic to microservices in this article.
Serverless
Serverless architecture uses cloud providers like GCP, AWS, and Azure to handle API hosting and management. This approach streamlines resource management and also reduces the in-house personnel requirements.
Even with these benefits, there are some drawbacks. Monitoring becomes more complex in this scenario due to
- Lack of direct server access
- Constant variability in resource usage with dynamic scaling
- Challenges in debugging the system due to hidden complexities in the cloud platform.
REST vs. GraphQL
The choice of REST versus GraphQL is independent of the application architecture options described above. REST APIs have established themselves as a staple in API architecture choices due to industry longevity, simple request-response model, and adherence to well-defined industry standards. Also, a wide range of both open-source and closed-source tools are available to help facilitate their development and monitoring. However, they can be quite large, with numerous endpoints, creating their own monitoring challenges.
GraphQL, a more recent addition to the API design, has gained traction in recent years. Its unique approach to data fetching allows clients to have really granular control of their data requests. This often leads to more data requests and introduces additional challenges for monitoring the large variety and number of requests.
API monitoring recommended best practices
A strategic plan for API monitoring should be considered before, during, and after API development. Here are some strategies to consider in developing an API monitoring plan.
Choose the appropriate tooling
You should choose the tooling that best works with your use case, architecture, and tech stack, as well as your budget. Let’s examine two scenarios – an order management app and a global supplier management app. The order management app is primarily used for special and advanced customer orders. Due to the simplicity of the app and its limited user base, target monitoring is sufficient for monitoring the APIs that support the app.
In contrast, consider the global supplier app serves thousands of supplier partners across six continents to ensure timely delivery of raw materials and finished products to their target destinations. As a result of the more complex architecture of the app and a much larger global audience, comprehensive monitoring is essential. One failure in the supplier app could cause a domino effect on stakeholders worldwide.
Synthetic monitoring is an essential tool in a comprehensive plan for monitoring global APIs, like the use case in our second example. Its core value is the ability to simulate diverse scenarios and proactively address issues before they occur and impact stakeholders across several continents and service providers.
Determine your monitoring frequency and intervals
The choice between real-time monitoring versus periodic monitoring should be based on the use case of your API, requirements for the freshness of the data, service level agreements, and how critical the API is to any fundamental needs of your business organization. For example, APIs supporting medical devices require real-time data availability. The severity of the consequences leaves little room for delays. Consequently, an API monitoring strategy for pacemaker APIs and similar technologies requires real-time monitoring measured in seconds and not minutes or hours.
On the other hand, consider financial reporting for a retail application that supports financial projections. The API reports the inventory and sales numbers at the end of the day. While there are definite business requirements for API result accuracy, there is less urgency. API monitoring, in this case, may only require daily checks to make sure the API is still up and running for when users need to access it.
Embrace tracing
Metrics are the staple of API monitoring, but transaction tracing has also become quasi-mandatory in environments that involve a large mesh of microservices and third-party APIs. Microservices architectures allow operations teams to scale their applications without introducing a single point of failure, while third-party APIs enable efficient communication across company boundaries, however, their value comes at the cost of complexity. Troubleshooting a slowdown in an environment comprised of dozens of microservices and third-party APIs is too complex without transaction tracing, so make sure the tool you choose to monitor your APIs includes this feature. You can learn more about distributed tracing concepts by reading this article.
Rely on OpenTelemetry framework
Open standards and frameworks like OpenTelemetry help clients and vendors alike. They help clients by avoiding lock-in to proprietary technologies, and they help vendors minimize research and development costs because the framework supports multiple programming languages and offers tracing, logging, and metrics. The lower development costs translate into a more competitive pricing that, in turn, benefits the customers. The peace of mind of knowing as an end-user that you can change vendors without replacing the libraries used to instrument your API code is immensely valuable.
Customize your alerts
Customizing alerts for your API can be a powerful tool to maintain your API’s reliability and meet business critical requirements. There are as many opportunities to customize alerts as diverse applications that use APIs, each with distinct needs. Set alerts for the metrics most critical to business needs with appropriate threshold values.
For example, consider an energy application that directly markets to consumers. The APIs that support the app could be set up for alerts like response time, checkout process success rate, and payment gateway uptime. Each of the alerts could have unique thresholds tied to a business need. For instance, alerts could be triggered if the app response time exceeds a two-second threshold. Strategic alerting prevents the app from losing potential customers due to the long response time.
Once your alerts are set, they can trigger further automation to resolve the issue.
Document your testing process
Document your testing process throughout to discover opportunities for optimizing your product or service. Also, continue to test throughout the life cycle of the API iteratively. Most importantly, create a central document or runbook containing your company’s standard operating procedures for identifying and resolving common issues with your API. When organizing your documentation or runbook, consider organizing tasks by automation level. This gives you the opportunity for partial or complete automation of tasks by using relevant scripts. It also helps to streamline your service workflow further and optimize the operational efficiency of your team.
Create real-time dashboards with SLO Management
Real-time dashboards provide an easy way to visualize, track, and share service level objectives (SLO). SLOs are measurable targets defining the level of service a business or organization has committed to delivering to its customers. They typically include uptime, response time, and error rates. For example, if a service level objective is 99% uptime, you can use a real-time dashboard to check and see that this objective is being met. Also, they are easy to interpret and share key metrics with technical and business users. It helps to identify problems and begin remediation quickly. By tracking these service level objectives in real-time, you can ensure you’re meeting your customers’ needs.
Troubleshoot across the entire transaction path
Troubleshooting relies on API monitoring to identify the root cause of performance problems. Common challenges, such as bottlenecks, scaling, and error handling, can all be improved by strategically leveraging API monitoring data and error codes.
For example, throughout can be a good indicator of how well your API is scaling. It is also important to differentiate if the API is the cause of the performance issue or if it relates to third-party tools in the API request path. For instance, network disruptions such as DNS delays, IP traffic delays, and even loss of data packets can cause performance issues unrelated to the API itself. Hence, it’s important to monitor the entire path of an API transaction, including the end-user experience, to understand the impact of slowdowns on the applications and pinpoint the root cause of performance problems without tedious troubleshooting.
Conclusion
APIs play a major role in applications today, and their significance is increasing. By using key metrics and appropriate tools and implementing a clear strategy for monitoring, you can make your APIs durable, scalable, and resilient. Use the API monitoring tips and best practices outlined above to improve API monitoring for your use case, tech stack, and infrastructure.
NEWSLETTER
Subscribe to our newsletter
Get the latest blogs, whitepapers, eGuides, and more straight into your inbox.
SHARE
CHAPTERS
- API monitoring tools: must-have features for the modern API landscape
- REST API vs. GraphQL: Key Considerations for API Monitoring and Development
- API Performance Monitoring: Key Metrics and Best Practices
- API Gateway Timeout: Causes and Solutions
- API Performance Testing: Key Considerations for Modern APIs
- Microservices Monitoring Strategies and Best Practices
- API Observability: Benefits and Strategies
- API Monitoring: Best Practices, Benefits and Solutions
- API Monitoring: Metrics, Challenges and Best Practices
- Web API vs. REST API: Comparing RESTful and Non-RESTful Web APIs
- API Architecture Patterns and Best Practices
- API Metrics: What and Why of API Monitoring
Every API in your stack deserves to be monitored, not just the critical ones.
LogicMonitor gives you coverage across availability, latency, errors, and payload correctness, with the context to act fast when something breaks.
FAQs
What is API monitoring?
API monitoring is the continuous practice of testing and measuring the availability, performance, and correctness of APIs in production. It involves checking that endpoints respond within expected latency windows, return correct status codes, deliver valid payloads, and remain accessible from the locations your users depend on.
What is the difference between API monitoring and API testing?
API testing is typically performed before deployment to verify that an API behaves correctly against its specification. API monitoring is continuous and runs in production, verifying that the API continues to behave correctly under real traffic conditions, real infrastructure, and real user load. Testing catches defects; monitoring catches regressions and degradation.
How do I monitor a third-party API my application depends on?
Use synthetic monitoring to make scheduled requests to the third-party API from outside your own infrastructure, mirroring what your application experiences. Track response time, availability, and payload structure. Set alerts on degradation so you know about third-party issues before your own error rates rise. This gives you data to inform SLA conversations with the vendor.
What does an effective API monitoring dashboard show?
A well-designed dashboard shows real-time and historical availability, latency trends (average, p95, p99), error rate by endpoint, request throughput, and geographic availability if you test from multiple locations. Effective dashboards surface anomalies and correlate metric changes with deployment events, not just static numbers.
© LogicMonitor 2026 | All rights reserved. | All trademarks, trade names, service marks, and logos referenced herein belong to their respective companies.