
API Observability: Benefits and Strategies
Monitoring tells you something broke. Observability tells you why. For distributed APIs, that distinction changes everything about your recovery time.


Denton Chikura
The quick download:
Monitoring catches fires; observability tells you why the building burned down, and how to make sure it never happens again.
-
Observability is built on three pillars (metrics, logs, and traces), and all three are required to diagnose failures in distributed API environments.
-
High cardinality data is what makes observability powerful; without it, you have dashboards that look busy but cannot answer the questions that matter during incidents.
-
The gap between monitoring and observability grows with system complexity. Teams running microservices need observability, not just uptime checks.
-
Instrument for unknown failures, not just known ones. The incidents that hurt most are the ones your monitoring was never designed to detect.
In the digital world, APIs (Application Programming Interfaces) are like the diligent workers who run the show behind the scenes. They help different software programs communicate with each other. For instance, when you check the weather on your phone, an API is quietly working to fetch that information from a remote server and display it on your screen.
But what if this conversation hits a snag? What if the weather app suddenly stops working or gives incorrect information? This is where API observability comes in. It’s a bit like being a digital detective, constantly keeping an eye on these API conversations to ensure everything is going smoothly.
This article explores the importance of API observability and several important strategies to enhance your API monitoring efforts.
Summary of key API observability strategies
| API observability strategies | Summary |
|---|---|
| Context-rich telemetry | Gather various data types (metrics, logs, traces) to understand API performance comprehensively. |
| High-cardinality data analysis | Dive into data with a high level of detail, like unique user IDs, for granular insights. |
| Data correlation | Link data across different areas (infrastructure, application, UX) for a holistic view of API health. |
| Distributed tracing and tagging | Track API calls throughout the service architecture for a complete journey view and use tagging for categorization. |
| Predictive issue detection | Use AI and machine learning to analyze API data and predict issues before they affect users. |
| Automated root cause identification | Use advanced analytics for quicker identification of the root causes of API issues, which helps in speedier problem-solving and pattern recognition for future incidents. |
| SLO compliance observability | Monitor APIs to ensure they meet set performance standards (SLOs) and provide real-time compliance reports. |
| Log analytics and visualization | Centralize log data from various sources and use advanced analytics for deeper insights. |
| Collaborate with third parties | Many organizations today integrate third-party and public APIs into their API ecosystem. Collaborating and sharing knowledge benefits everyone. |
Why is API observability critical?
Imagine if your banking app showed the wrong account balance. Quite alarming, right? API observability helps prevent such mishaps by continuously monitoring APIs for any signs of trouble. It’s not just about finding out something went wrong but also understanding why.
Today’s digital services are complex. Multiple APIs often communicate with each other in the background, so the application works as expected. Observability helps untangle the web, making it easier to see how each software component contributes to the bigger picture. It provides deeper insights to help quickly fix issues and improve the overall user experience. Understanding how APIs function and interact is not just a technical necessity; it’s a core part of ensuring seamless digital experiences.
But why exactly do we need to probe so deeply into API behaviors? As users, we often see the end result of an API’s work – a loaded webpage, a completed transaction, or a streaming video. But behind these seemingly simple actions are complex processes and decisions being made. Let’s say an API suddenly starts slowing down. Observability tools can trace this change by looking into the system’s depth. For example, they can check if the delay is due to database queries taking longer to run or if a new code deployment is causing the delay.
A good API observability tool will enable you to track the journey of an API request from start to finish. You can even observe delays due to components outside your control—such as network errors. API observability helps you see where the delays happen – is it in the network, the server, or the API processing itself?
It’s like being a detective. Once you understand how different API request—response mechanisms work, you start solving problems more effectively. When you see a change, like slower response times, observability tools can help you backtrack and find out what changed in the input or the processing steps.
API observability vs. monitoring
Sometimes API observability is confused with API monitoring, but API observability has a different scope than monitoring. You can think of observability as a more mature monitoring capability within an organization.
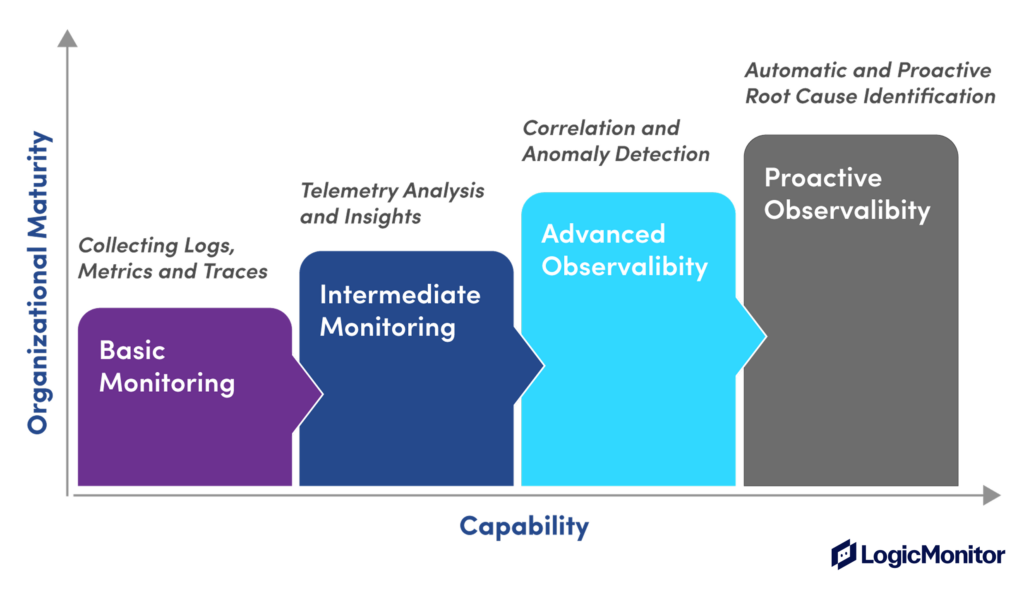
Monitoring tracks metrics and raises alerts when issues occur. However, observability actively explores API data to understand both known and unknown issues. Let’s look at more differences below.
| Monitoring | Observability |
|---|---|
| The goal is to keep systems running to meet user expectations. | The goal is to actively troubleshoot and fix issues to improve system performance and user experience continuously. |
| Insights focused on whether API performance is as expected or not. | Deep insights into how APIs function and interact. |
| Tracks metrics like uptime or response times. | Uses complex data including detailed logs, metrics, and traces. |
| Mostly reactive, responding to problems after they occur. | Highly proactive, often predicting and solving problems before they affect users. |
Strategies in API observability
Next, let’s look at some API observability strategies for troubleshooting and preventing API incidents more effectively.
#1 Context-rich telemetry
The data observability tools collect about APIs is called telemetry data. Telemetry enables DevOps engineers, developers, and site reliability engineers to better understand the API’s internal state. Telemetry data mainly consists of events, metrics, logs, and traces.
Events
Events are records of specific occurrences within a system, often signaling a change in state or a notable occurrence. They track specific occurrences, such as API calls, changes in system state, or user actions.
Metrics
Metrics are numerical values that measure various aspects of system performance or behavior over some time. They include API data like response times, error rates, throughput, and system resource utilization (CPU, memory, etc.).
Logs
Logs are records of events that happen within an application or system. They are typically textual and can range from basic information messages to detailed error reports. Logs provide a detailed, chronological record of API events, including detailed request/response data, error messages, and system events.
Traces
Traces represent the lifecycle of a request as it travels through various components of a distributed system. Traces are made up of spans. A span is a single operation or a unit of work in the process of handling a request. Traces are crucial in microservices architectures where a single request may involve multiple services. They give you data about every step in the API communication pathway. You can understand the topology of the API ecosystem, such as services, databases, and external integrations. Understanding this relationship allows discovering how different elements impact API performance and user experience, enabling effective optimization
Context
Context-rich telemetry in API observability refers to the practice of collecting and analyzing telemetry data with an added layer of contextual information. Beyond metrics, logs, events, and traces, you also collect detailed information about the application’s environment, configuration, and state. You focus on the end-user experience by relating technical metrics to user activities and behaviors, gaining a more holistic view of the API’s performance and usage patterns. Having as many different types of telemetry points as possible gives IT teams the best chance of identifying potential performance issues. For example, the LogicMonitor platform combines additional telemetry points like
- Synthetic test data—real browsers perform full page loads or emulate full user journey transactions – such as logins or checkouts.
- Network data—data from every part of the network from initial DNS resolution to the web application front end to traces across the application stack and the wider internet that you don’t control
- Real user web performance data—like page load and response time in the same viewport as business metrics
- Endpoint data captures your employee’s experience
LogicMonitor also gives you the ability to measure user sentiment and track what your customers are saying and how they are feeling about your product. It provides invaluable contextual tools to support the hard data offered by other telemetry points.
#2 High-cardinality data analysis
High-cardinality data analysis is the process of analyzing large and diverse sets of unique data points or dimensions within your API metrics. “Cardinality” in this context refers to the number of unique values in a dataset. It means looking closely at data that has many unique values, such as user IDs, API endpoints, IP addresses, transaction IDs, etc.
It helps you understand the unique behavior of each user or how each part of your API performs. Sometimes, the smallest details can reveal big trends. For example, if you notice that users from a certain region are experiencing slow API responses, this high-level detail can help you pinpoint and solve these issues.
This detailed data can help in planning. For instance, if you know which API endpoints are the busiest, you can allocate more resources to improve performance. Another way could be to analyze API’s performance over time rather than a single snapshot.
| API Endpoint | Average Requests per min | Action |
|---|---|---|
| Login | 500 | Increase capacity |
| Payment | 100 | Monitor for spikes |
#3 Data correlation in API observability
Data correlation in API observability links and analyzes related data points from various sources within a system. You identify and connect disparate data related to each other through direct interactions or shared attributes and provide a cohesive view of the API’s operations and its impact on the overall system.
It is comparable to putting together a jigsaw puzzle. You gather different pieces of information from various parts of your system, like how long an API takes to respond, server health, and user satisfaction levels. When you put all these pieces together, you get a complete picture of how well your API is performing.
By correlating data from the past and present, you can make intelligent guesses about future issues. It’s like noticing that server memory usage spikes every time your app slows down, so you decide to upgrade your server to prevent future slowdowns.
Similarly, correlating API data with user behavior can reveal usage patterns. Maybe your API gets more requests on weekends, or more errors pop up after a new feature release. This insight helps you prepare better, like beefing up resources on busy days or being extra vigilant after new releases. You can also analyze specific metrics that indicate future issues and provide insights into the API’s health and performance trends. For example,
- Average Response Time (ART), higher ART could indicate potential bottlenecks.
- Server CPU usage helps identify when the server is under heavy load, which might impact API performance.
#4 Distributed tracing and tagging
Distributed tracing tracks every request as it travels through different services in your system. It provides a way to visualize the journey of a request from its inception point through all the services it interacts with until it completes its process. It is particularly crucial for microservices architectures where a single request might pass through multiple services.
Tagging in distributed tracing is the practice of attaching key-value pairs, or “tags,” to telemetry data. It is similar to adding labels to your email inbox. It helps organize and categorize API traces based on different criteria, like which part of your app they are serving or which user group they belong to, making it easier to analyze and understand API performance for different segments.
LogicMonitor offers advanced distributed tracing capabilities that allow you to visualize the entire journey of an API request. With detailed user experience and distributed tracing data in the same platform you can gain a holistic, end-to-end view with analytics and drill-down. This helps in identifying bottlenecks or failures in the service chain and solves the problem of complex, large, distributed environments having an impact on your customer’s digital experience.
#5 Predictive issue detection
Predictive issue detection involves analyzing specific metrics that can indicate future issues. These metrics provide insights into the API’s health and performance trends.For example
| Metric | KPI |
|---|---|
| Response time | Indicates API efficiency |
| Error rate | Reflects API reliability |
| Traffic volume | Helps predict load and scalability |
| User engagement patterns | Indicates changing user behaviors |
| Outage | Identify regional outages |
Using the below formula, you can calculate an anomaly score:
AnomalyScore = ABS(CurrentMetricValue − HistoricalAverage) / StandardDeviation
ABS is the absolute value. An unusually high or low anomaly score can alert you to performance deviations, prompting a closer examination.
An ideal monitoring solution will provide predictive issue detection through advanced analytics, leveraging machine learning algorithms to analyze collected metrics.
#6 Automated root cause identification
Key to automated root cause identification is implementing detailed and structured logging within the API. Effective logging practices use appropriate log levels to efficiently filter through the noise, help capture the right data at the right time, and facilitate quicker issue identification. You don’t log everything—logging too many unnecessary events can make things problematic in critical situations.
You can use structured logging formats (like JSON) in your API development. This enables easier parsing and analysis of log data. For instance, log API responses with status codes, response times, and error messages in a structured format.
logger = logging.getLogger(logger_name)
logger.setLevel(logging.DEBUG) # better to have effective logs rather too much
logger.addHandler(get_console_handler())
logger.addHandler(get_file_handler()) # with this pattern, it's rarely necessary to propagate the error up to parent
logger.propagate = False
return logger
#7 SLO compliance monitoring
Service Level Objectives (SLOs) are crucial in setting clear performance benchmarks for your API. They define acceptable performance and availability levels, providing a tangible target for your API to meet. Establish SLOs based on critical API performance metrics such as uptime, response time, and error rate. For example, an SLO might define that the API should have an uptime of 99.9% and an average response time of less than 200ms.
Implement continuous monitoring to track your API’s adherence to these established SLOs. Integrating SLO compliance monitoring with broader business objectives ensures your API’s performance aligns with organizational goals. If certain SLA breaches correlate with customer complaints or decreased usage, prioritize fixing these issues to align with overall business goals.
#8 Log analytics and visualization
Effective log analytics starts with centralizing log data. This involves gathering logs from various sources within your API ecosystem into a single repository. It’s like collecting all the story pieces scattered across different locations into one book, making it easier to understand the narrative. Approach below:
- Set up a log aggregation tool that collects and stores logs from all parts of your API, including servers, databases, and application code.
- Once logs are centralized, the next step is to apply advanced analytics to extract actionable insights. This process involves parsing logs, identifying patterns, and detecting anomalies.
logs.forEach(log => {
  if (log.includes("error")) {
    parseLog(log);
  }
});
Visualizing log data can significantly enhance the understanding of API behavior. Graphs, charts, and dashboards translate raw log data into an easier format to interpret and analyze. Implement real-time log monitoring to enable immediate response to critical issues.
#9 Collaborate with third parties
Imagine a digital ‘war room’ where companies come together in real-time to tackle an API crisis, sharing updates and solutions. Think of it like neighborhood watch meetings where companies share details of API incidents. These stories provide valuable lessons that benefit everyone involved. Company A experiences a data breach through an API. In a shared review session, they explain how the breach occurred and the steps taken to mitigate it. Company B, using a similar API, uses this insight to strengthen its own security measures as shown below:
| Incident | Company | Solution |
|---|---|---|
| Data breach | A | Enhanced encryption |
| Server downtime | B | Redundancy protocols |
Conclusion
API observability helps you oversee the complex web of API interactions present in modern enterprise applications. Context-rich telemetry, high cardinality data, and distributed tracing uncover the layers that make APIs functional, resilient, and efficient from the end user perspective. Predictive analytics and automation help you respond proactively to incidents before they occur.
NEWSLETTER
Subscribe to our newsletter
Get the latest blogs, whitepapers, eGuides, and more straight into your inbox.
SHARE
CHAPTERS
- API monitoring tools: must-have features for the modern API landscape
- REST API vs. GraphQL: Key Considerations for API Monitoring and Development
- API Performance Monitoring: Key Metrics and Best Practices
- API Gateway Timeout: Causes and Solutions
- API Performance Testing: Key Considerations for Modern APIs
- Microservices Monitoring Strategies and Best Practices
- API Observability: Benefits and Strategies
- API Monitoring: Best Practices, Benefits and Solutions
- API Monitoring: Metrics, Challenges and Best Practices
- Web API vs. REST API: Comparing RESTful and Non-RESTful Web APIs
- API Architecture Patterns and Best Practices
- API Metrics: What and Why of API Monitoring
Monitoring tells you something broke. LogicMonitor tells you why.
Get metrics, logs, and traces in one platform, with the high-cardinality data your team needs to diagnose distributed failures fast.
FAQs
What are the three pillars of observability?
The three pillars are metrics, logs, and traces. Metrics provide aggregated, time-series measurements of system behaviour. Logs provide detailed, timestamped records of individual events and errors. Traces show the path of a request across distributed services and components. All three are required to diagnose failures in complex environments; any one pillar alone leaves critical blind spots.
Is API observability the same as API monitoring?
No. Monitoring tells you when something is wrong by alerting on known conditions. Observability tells you why by giving you enough data to ask and answer questions about system behaviour, including failure modes you have never seen before. Observability enables debugging; monitoring enables alerting. Teams need both working together.
What is high cardinality data and why does it matter for observability?
High cardinality data contains many unique values per field: for example, individual user IDs, request IDs, or specific endpoint paths. High cardinality is what makes observability powerful: it allows you to filter and drill into specific requests, users, or services during an incident rather than looking at aggregated averages that obscure the problem.
How do distributed traces help debug API failures?
A distributed trace records the full journey of a request as it passes through every service, database call, and external dependency in your system. When a failure occurs, the trace shows you exactly where latency was introduced or where an error originated, even across dozens of microservices. Without traces, you see that something failed; with traces, you see precisely where and why.
© LogicMonitor 2026 | All rights reserved. | All trademarks, trade names, service marks, and logos referenced herein belong to their respective companies.