
API Performance Monitoring: Key Metrics and Best Practices
Performance problems kill user trust long before your alerts fire. Here is how to monitor API performance in ways that actually protect the experience.


Denton Chikura

The quick download:
API performance issues rarely announce themselves. By the time users complain, your latency has been degrading for longer than you think.
-
Response time, throughput, error rate, and resource utilization together form the performance baseline every API team needs to establish before incident response.
-
Latency percentiles (p95, p99) reveal the user experience outliers that average response times systematically hide.
-
Performance degradation follows patterns. Trending metrics over time surfaces slow deterioration before it reaches the threshold where users notice.
-
Correlate performance data with deployment events and infrastructure changes to cut mean time to root cause in half.
Why is API performance monitoring critical in distributed applications?
Software design has shifted from monolithic systems towards more distributed software components to meet the increasing demand for flexibility, scalability, and modularity. Microservices architecture has hundreds of services performing discrete functions that communicate with each other using APIs. While the business benefits are many, it has resulted in a complexity explosion in the API monitoring landscape.
Organizations now use external APIs to access third-party functionality and internal APIs for sharing functionality between components. It is also not uncommon to find hybrid models with large monolithic stacks that expose certain functionalities as APIs. A simple slowdown in one endpoint compounds as systems become more complex, leading to slow loading times, timeouts, and other problems that negatively impact the user experience.
API performance monitoring helps DevOps teams proactively address concerns, identify the root cause behind issues, and ensure that third-party API providers adhere to expected service level objectives. Developers get valuable insights into their API’s efficiency, detect potential performance bottlenecks, and take action to ensure consistency and reliability.
Monitoring and telemetry shouldn’t be afterthoughts; they must be at the forefront of API design. This article explores critical metrics and best practices for API performance monitoring in distributed applications.
Summary of key API performance monitoring metrics
API performance is influenced by many factors like response time, server capacity, and network latency. For a better understanding, collecting and analyzing various measurements that provide insights into different aspects of the API’s functionality is crucial. We summarize some key metrics in the table below.
| Metric | Description |
|---|---|
| Response Time | The time it takes for the API to respond to a request. |
| Latency | The delay between sending a request and receiving the first byte of the response. |
| Failed Request Rate | The percentage of requests that result in an error or failure. |
| Throughput | The number of successful requests processed by the API per unit of time. |
| Availability | The percentage of time the API is operational and accessible to users. |
Key API performance monitoring metrics
Metrics define an API’s acceptable level of service quality and performance. Metric values can be used to define service level objectives(SLOs) and provide a clear understanding of what users can expect from your API. They provide a baseline for performance and inform decisions related to resource allocation, system design, and operational priorities.
We elaborate on key API performance metrics and discuss their benefits and use cases.
Response time and latency
Response time is a critical metric in API performance monitoring and one of the most important factors impacting the end-user experience. It measures your API’s time to respond to requests and reflects how quickly it processes incoming requests and delivers results. For instance, consider an API providing real-time access to the financial market so users can trade stocks. The stock market’s volatility and high-frequency trading demand low response times to ensure seamless and efficient trading experiences.
It is preferable to use percentiles to assess API performance. Exclusively relying on the average or the median response time graphs may not fully demonstrate response time outliers. Most users may see requests handled quickly, but a few users may experience long delays. Imagine you have a caching layer in front of your database. Your average response time may seem like 40 ms, but the response rate may be as high as 500 ms for some users. Thus, it is better to look at percentile latency to capture worst-case scenarios.
Percentiles represent the percentage of API requests that fall below specific response time thresholds to help detect outliers. Some of the most used percentiles:
- 50th percentile (P50) or median, which reveals the API’s typical response time and indicates the time below which 50% of the requests fall.
- 75th percentile (P75) offers insights into the response time experienced by most users.
- 99th percentile (P99) detects rare cases of unusually high response times (highest 1% of the values).
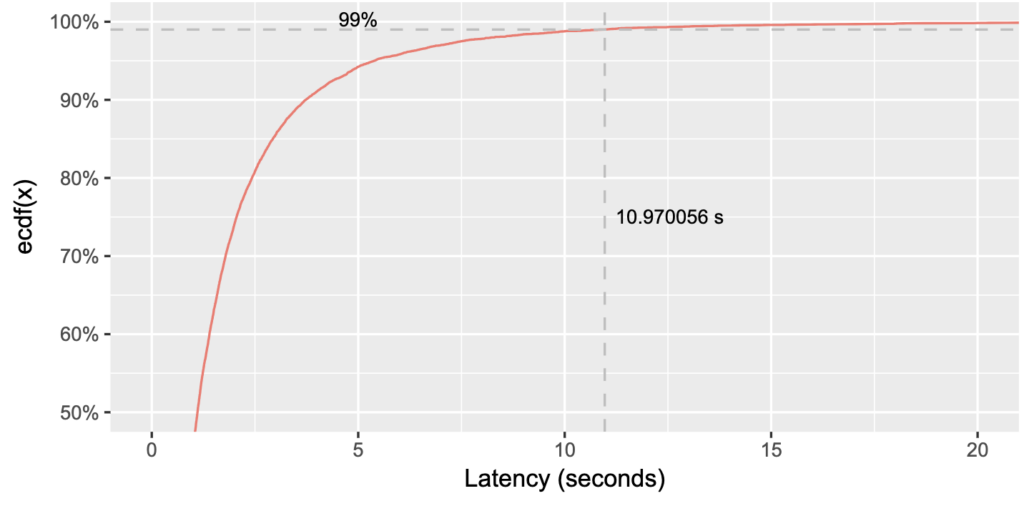
It is recommended to set alerts based on percentile thresholds to flag unusual behavior. For instance, if your average response time is 100 ms, you may set the alert condition if your p99 percentile lasts more than 5 minutes. You can detect problematic outliers without setting off false alarms.
Failed requests rate and count
The failed requests rate metric measures the percentage of API requests that result in errors or failures. It indicates the frequency of unsuccessful API interactions and is crucial for understanding the health and reliability of your API.
When monitoring failed requests, it is essential to consider each error’s importance and tolerance level. Not all errors have the same impact on the overall system and user experience. Some errors may be more tolerable, while others are critical and demand immediate action. You can use log levels such as WARN, ERROR, and CRITICAL to measure the different types of failed requests and incorporate error levels in your metric.
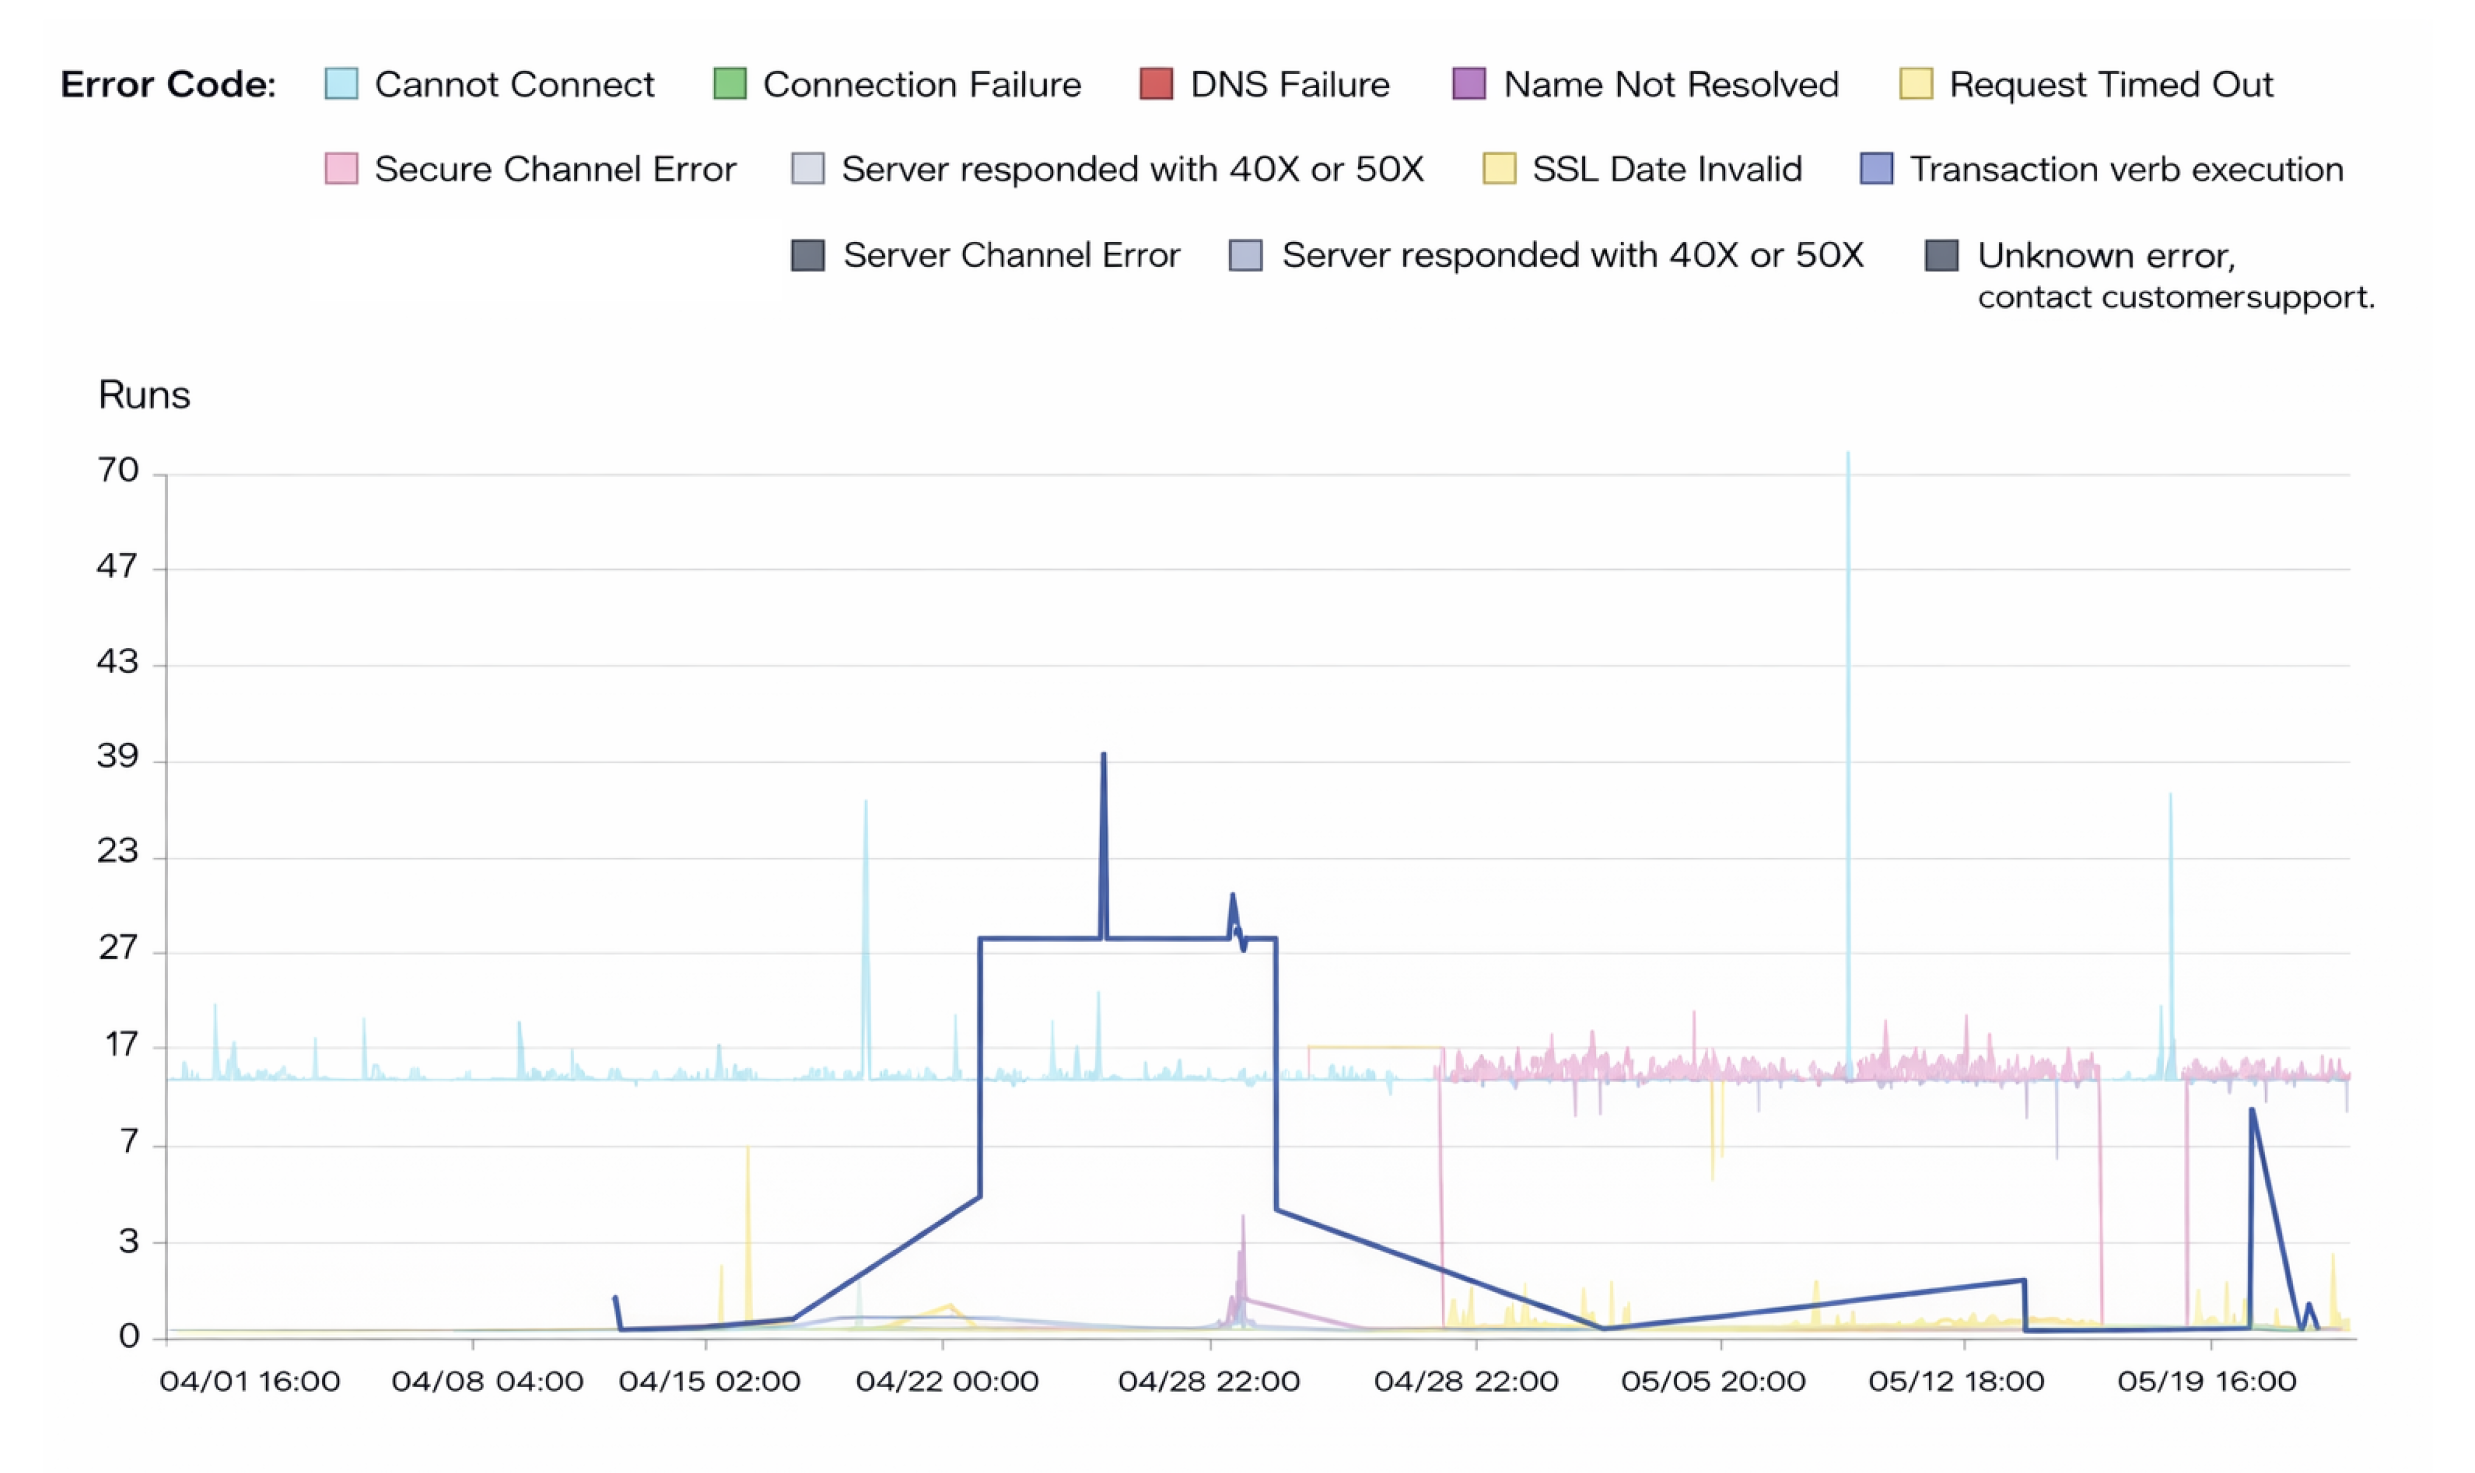
Some of the reasons that requests fail are given below.
Timeouts
Timeouts are inevitable due to network problems and instantaneous throughput spikes. It’s crucial to set the thresholds correctly to detect the correct kind of timeouts.
For example, in fault-tolerant systems like search APIs, timeouts are common and often expected due to the nature of the technology stacks. Setting a higher tolerance level and not triggering alerts for occasional timeouts is reasonable in such cases. Sometimes, a threshold of 0.01% (out of total requests) may be good enough to maintain expected availability, assuming clients restart.
In contrast, errors related to financial transactions are of utmost importance and must be taken much more seriously. In this case, you have to take a different approach and set an alert for a more aggressive threshold of 10 RPM (requests per minute) out of total requests.
Server internal errors
Sometimes DevOps teams generate alerts on every 5xx error incident. But you have to consider if doing so will be very noisy, especially if you have automated mechanisms that help you retry or recover gracefully. Instead of alerts for every error, you may consider
- Setting a threshold after which an alert is set off. This can be done based on the requests per minute of receiving a 5xx error.
- Tracking 5xx errors that went under the radar to prioritize addressing the reasons before they start to affect more users.
Additionally, it is important to note that every error does not require a call out to customers. For example, failed payment or failed login attempt errors are reported to users, but internal database errors don’t need to appear on the client interface.
Availability
Availability, or uptime, is a metric in API monitoring that reflects how often the API or service remains operational and accessible to users. You may have an application with 99.99 percent uptime, but the reality is there are multiple dependencies on other independent APIs. This means that the uptime is critically tied to the behavior of those independent APIs and the performance degradation of any of these APIs can cascade down and impact your API’s availability. This makes it vital to measure API reliability over different timeframes and different locations.
Achieving high availability requires thoughtful consideration of geographical distribution and the implementation of alert systems to detect and respond to potential outages proactively.
Real-time availability monitoring
Consider a cloud-based SaaS platform that provides various software solutions to businesses globally. The platform operates in multiple regions, each hosted by different cloud providers, ensuring redundancy and fault tolerance. For instance:
- Region 1: US-East (Cloud Provider: AWS)
- Region 2: Europe-West (Cloud Provider: Azure)
- Region 3: Asia-Pacific-Southeast (Cloud Provider: Google Cloud Platform)
To effectively prioritize responses, customers are categorized into different tiers based on their importance and the potential impact of an outage. For example:
- Tier 1 Customers: Enterprise clients with critical business operations.
- Tier 2 Customers: Smaller businesses with less time-sensitive operations.
In case of an outage or performance degradation affecting a Tier 1 customer, the platform’s alerting system immediately notifies the dedicated support team. This enables the team to prioritize Tier 1 customer issues and allocate resources promptly to resolve the problem.
In addition to regional redundancy, the SaaS platform should implement failover and disaster recovery mechanisms. If a region experiences an unexpected outage or degradation, traffic is automatically rerouted to an alternate healthy, preferably nearby region, ensuring minimal disruption to customer operations.
The platform should continuously evaluate and fine-tune its availability strategy based on historical data and usage patterns. By employing load balancing techniques, it distributes traffic evenly across regions and availability zones, optimizing resource utilization and enhancing overall performance.
Throughput
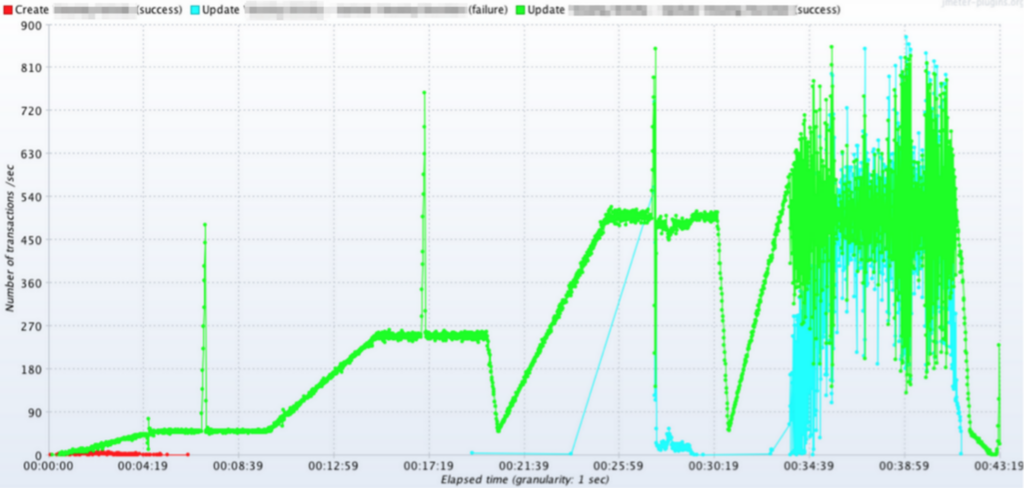
Throughput measures how an API handles incoming requests and delivers responses within a specific timeframe. You can measure it in such forms as requests per minute (RPM) or transactions per second (TPS). Monitoring throughput is useful for detecting potential system issues—a sudden drop may signify system failures, or sudden spikes may suggest unwanted bot activity. Setting up alerts on throughput outliers can help you detect problems and escalate when necessary.
Some reasons for monitoring throughput are given below.
Establish a performance baseline
When tracking throughput, you’ll have a baseline performance metric to compare against. If your system suddenly experiences a drop in throughput due to a gateway failure, you can quickly identify the issue. The monitoring allows you to respond promptly to minimize downtime and potential losses in revenue. Without throughput tracking, you might not notice the problem until it significantly impacts your users.
Context for other metrics
Throughput adds context and relevance to other metrics like error rate and response time. For example, if you have 99 percentile response times in a certain period, checking throughput can help determine if the response time outlier is relevant or simply a result of no one using the API.
Take proactive action
By closely observing throughput trends, you gain valuable insights to make informed decisions about your infrastructure. For instance, consider a scenario where your APIs typically operate with 100 instances. However, you observe a sudden 20% spike whenever your company runs a marketing campaign. You can anticipate such surges in demand and proactively scale your infrastructure during the next campaign to ensure a consistent user experience.
Why are logging and alerting essential for API performance?
Logging and alerting are integral aspects of API performance monitoring, helping teams maintain the health and reliability of their APIs while ensuring that performance aligns with user expectations and business goals.
Logging
Logging involves recording and storing detailed information about API requests, responses, errors, and other relevant events in a log file or database. API monitoring tools offer logging capabilities to capture valuable data for troubleshooting, performance analysis, and security audits.
Benefits of using logging tools:
- Centralized log storage makes accessing and analyzing log data from multiple sources in one place easier.
- Real-time log analysis lets you search and filter logs instantly. This capability is beneficial for quickly identifying and resolving issues as they happen.
- You can retain log data for an extended period, ensuring historical records are available for performance analysis and compliance requirements.
Alerting
Alerting in API performance monitoring involves setting up notifications and alarms to promptly inform relevant stakeholders when metrics or events exceed thresholds or exhibit abnormal behavior. You can define static threshold-based alerts for metrics like response times, error rates, and throughput that trigger alerts when exceeded. You can also set up dynamic or adaptive thresholds based on historical data and usage patterns to prevent false alarms during expected traffic anomalies(e.g., traffic peaking over the holidays). Modern monitoring tools utilize machine learning algorithms to detect unusual behavior and trigger alerts for significant deviations from expected patterns.
What role does end-to-end tracing play in API monitoring?
Logging and alerting are base technologies in API performance monitoring. But modern complex distributed architecture requires end-to-end transaction monitoring to understand the why behind metric values and address the root cause of issues.
An end-to-end transaction path refers to a transaction’s complete journey or flow from its initiation to its finalization. It describes the entire sequence of steps in a transaction involving multiple APIs in a distributed system. Understanding the end-to-end transaction path is crucial for identifying performance bottlenecks impacting your API.
Modern API performance monitoring tools like LogicMonitor help with end-to-end tracing, visibility, and performance monitoring of distributed applications across containers, serverless architectures, and virtual machines. For example, with LogicMonitor API performance monitoring, you can
- Monitor the full transaction path for a complete context, including the public networks and third-party services like domain name service (DNS) and content delivery networks (CDN) that can affect end-to-end API performance
- Capture performance metrics for long-term regression analysis.
- Run API transactions to test functionality, execute payloads, and parse for expected responses.
- Correlate performance to business results by measuring compliance with API service-level objectives.
- Provide automated instrumentation and distributed tracing of your applications on VMs, serverless, and containers without having to write any code or do any additional work.
- Use record and replay features for offline debugging so you can step over each line of code after it runs and track the value of local variables.
Conclusion
API performance monitoring is crucial for ensuring the success of applications and services. By continuously tracking metrics like response time, latency, throughput, error rates, and availability, businesses can proactively address issues and provide a seamless user experience. API performance monitoring tools typically use logging and alerting mechanisms to help you meet your service level objectives. However, complex distributed systems require end-to-end transaction path analysis and distributed tracing mechanisms to troubleshoot the root cause of performance issues.
NEWSLETTER
Subscribe to our newsletter
Get the latest blogs, whitepapers, eGuides, and more straight into your inbox.
SHARE
CHAPTERS
- API monitoring tools: must-have features for the modern API landscape
- REST API vs. GraphQL: Key Considerations for API Monitoring and Development
- API Performance Monitoring: Key Metrics and Best Practices
- API Gateway Timeout: Causes and Solutions
- API Performance Testing: Key Considerations for Modern APIs
- Microservices Monitoring Strategies and Best Practices
- API Observability: Benefits and Strategies
- API Monitoring: Best Practices, Benefits and Solutions
- API Monitoring: Metrics, Challenges and Best Practices
- Web API vs. REST API: Comparing RESTful and Non-RESTful Web APIs
- API Architecture Patterns and Best Practices
- API Metrics: What and Why of API Monitoring
Catch API performance degradation before users notice it.
LogicMonitor tracks latency percentiles, correlates performance trends with deployments, and alerts on meaningful deviations rather than just hard thresholds.
FAQs
What causes sudden API performance degradation?
Common causes include a code deployment introducing a slower algorithm or database query, increased traffic exceeding capacity, a slow downstream dependency, infrastructure changes such as VM resizing or network route changes, or resource exhaustion such as connection pool limits or memory pressure. Correlating performance data with deployment events is the fastest way to narrow down root cause.
How is API performance monitoring different from load testing?
Load testing is performed pre-production to understand how an API behaves under controlled, simulated load. Performance monitoring is continuous and observes real production traffic. Load testing validates capacity; performance monitoring protects it by detecting degradation as it develops, before it reaches the threshold where users notice.
What is a reasonable API response time target?
Common guidelines suggest under 100ms for simple read operations, under 300ms for more complex queries, and under 1 second for operations involving significant computation or external calls. Google’s research suggests 200ms as the threshold beyond which users begin to notice latency in interactive applications. Define targets based on your specific use case and user expectations, then monitor against them.
How do you detect gradual performance degradation in production APIs?
Monitor p99 latency over days and weeks rather than just minutes; soak testing under sustained load and long-running trend analysis are the primary methods. Alerting on week-over-week trend increases, rather than just threshold breaches at a single point in time, catches slow deterioration before it becomes a production incident.
© LogicMonitor 2026 | All rights reserved. | All trademarks, trade names, service marks, and logos referenced herein belong to their respective companies.