
Real-Time Website Monitoring
Real-time website monitoring goes beyond snapshots. Learn how continuous measurement across locations, devices, and browsers reveals the full user experience.


Denton Chikura
The quick download:
Real-time website monitoring only works if it covers every dimension of the user experience.
-
Real-time monitoring requires frequent measurements (every five minutes or less) across multiple geographies, browsers, and device types. Infrequent checks miss intermittent issues entirely.
-
The full transaction path matters. DNS, CDN, third-party APIs, and network latency all affect what end users experience. Monitoring only your own infrastructure misses the rest.
-
Synthetic monitoring covers you when real users aren’t online. It’s especially important for detecting off-peak slowdowns and testing from regions with low real traffic.
-
Combine synthetic testing with real user monitoring for the complete picture: one shows you what’s happening systematically, the other shows you what’s happening in practice.
Unlike point-in-time snapshots of a website’s performance using metrics like Core Web Vitals, real-time website monitoring requires collecting measurements at regular time intervals (e.g., five minutes or less) to determine the end-user experience from various geographies (e.g., the East Coast of the US vs. Germany), computing platforms (desktop vs. mobile), browser types (e.g., Chrome vs. Safari), and service providers (e.g., Verizon vs. AT&T).
Regular measurements must cover all segments along the transaction path to provide an accurate perspective on the website performance experienced by end users. These measurements should be collected for the browsers of real users and from simulated transactions (especially relevant when and where users aren’t actively online), network latency, domain name resolution (DNS) services, content delivery networks (CDN), and third-party APIs—basically, all the components that could affect the end-user experience while using a website.
Real-time monitoring helps detect performance problems before, or at least as soon as they are experienced by the end-users, and provides insights to help the responsible team resolve the issues to meet the service level objectives (SLO) set for the website.
This article explains the relevant measurements required for real-time website monitoring to ensure end-to-end coverage of the transaction path. This helps pinpoint the root cause of problems more quickly and deliver a higher level of service.
Measurements to collect for real-time website monitoring
| Real-time website monitoring measurement | Description |
|---|---|
| Uptime and availability | Measures the percentage of time a website is operational and accessible to users, indicating its reliability. |
| Error rate | Tracks the frequency of errors (such as 404 or server errors) that occur when users interact with the website, helping identify issues. |
| Real user monitoring (RUM) | Captures data from actual user interactions with a website to provide insights into metrics like response time (the time a server takes to respond to a user’s request) and page load speed (the time required for a webpage to fully load). |
| Synthetic monitoring | Uses periodic pre-configured tests to verify specific aspects of a website’s performance, from the full user journey to individual elements or dependency performance. Helps detect issues before real users experience them and ensures complete coverage, even for pages that may not be used often by real users. |
| Network latency | Measures the amount of time that a packet takes to be transmitted between the client (browser) and the server. Breaking down the network latency into hop-by-hop latency using a tool like traceroute can help identify network segments that contribute to high latency. |
| Domain name service (DNS) | Determines the availability and performance of domain name resolution, which is the starting point of an end-user session. |
| Content delivery network (CDN) | Measures the CDN’s performance in serving up images, videos, and files stored close to the geographic locations of the end-users around the globe. |
| API monitoring | Measures the response time and error rate of the third-party APIs the application depends on to function. |
| User behavior metrics | Tracks user behavior through engagement metrics (bounce rate, session duration, page views) and identifies potential usability issues with frustration metrics (rage clicks, error clicks, etc.) to optimize website performance and improve user satisfaction. |
Uptime and availability
Measuring uptime and availability is the first step in real-time website monitoring. Uptime refers to the percentage of time a website is operational and accessible to users, while availability measures the site’s readiness to serve requests. These measurements are critical because even brief periods of downtime or micro-outages can lead to significant losses in revenue, user trust, and search engine rankings.
Real-time monitoring of uptime and availability involves continuous checks across multiple geographic locations to ensure the website is globally accessible. When issues arise, instant alerts allow teams to respond quickly, minimizing downtime. Additionally, historical uptime data helps identify patterns and potential recurring issues, enabling proactive maintenance and improvements to overall site reliability.
Error rate
Error rate measures the frequency of errors occurring on a website. It’s typically expressed as a percentage of total requests that result in errors. These errors range from client-side issues (like 404 Not Found) to server-side problems (such as 500 Internal Server Error). Monitoring error rates in real time allows teams to identify and address intermittent issues affecting user experience that may not be reported. A sudden spike in error rates could indicate a critical problem, such as a broken feature, database issue, or server overload. By setting thresholds for acceptable error rates and receiving alerts when exceeded, teams can maintain high-quality user experiences and prevent small issues from escalating into major problems that could affect the business’s bottom line.
Real user monitoring
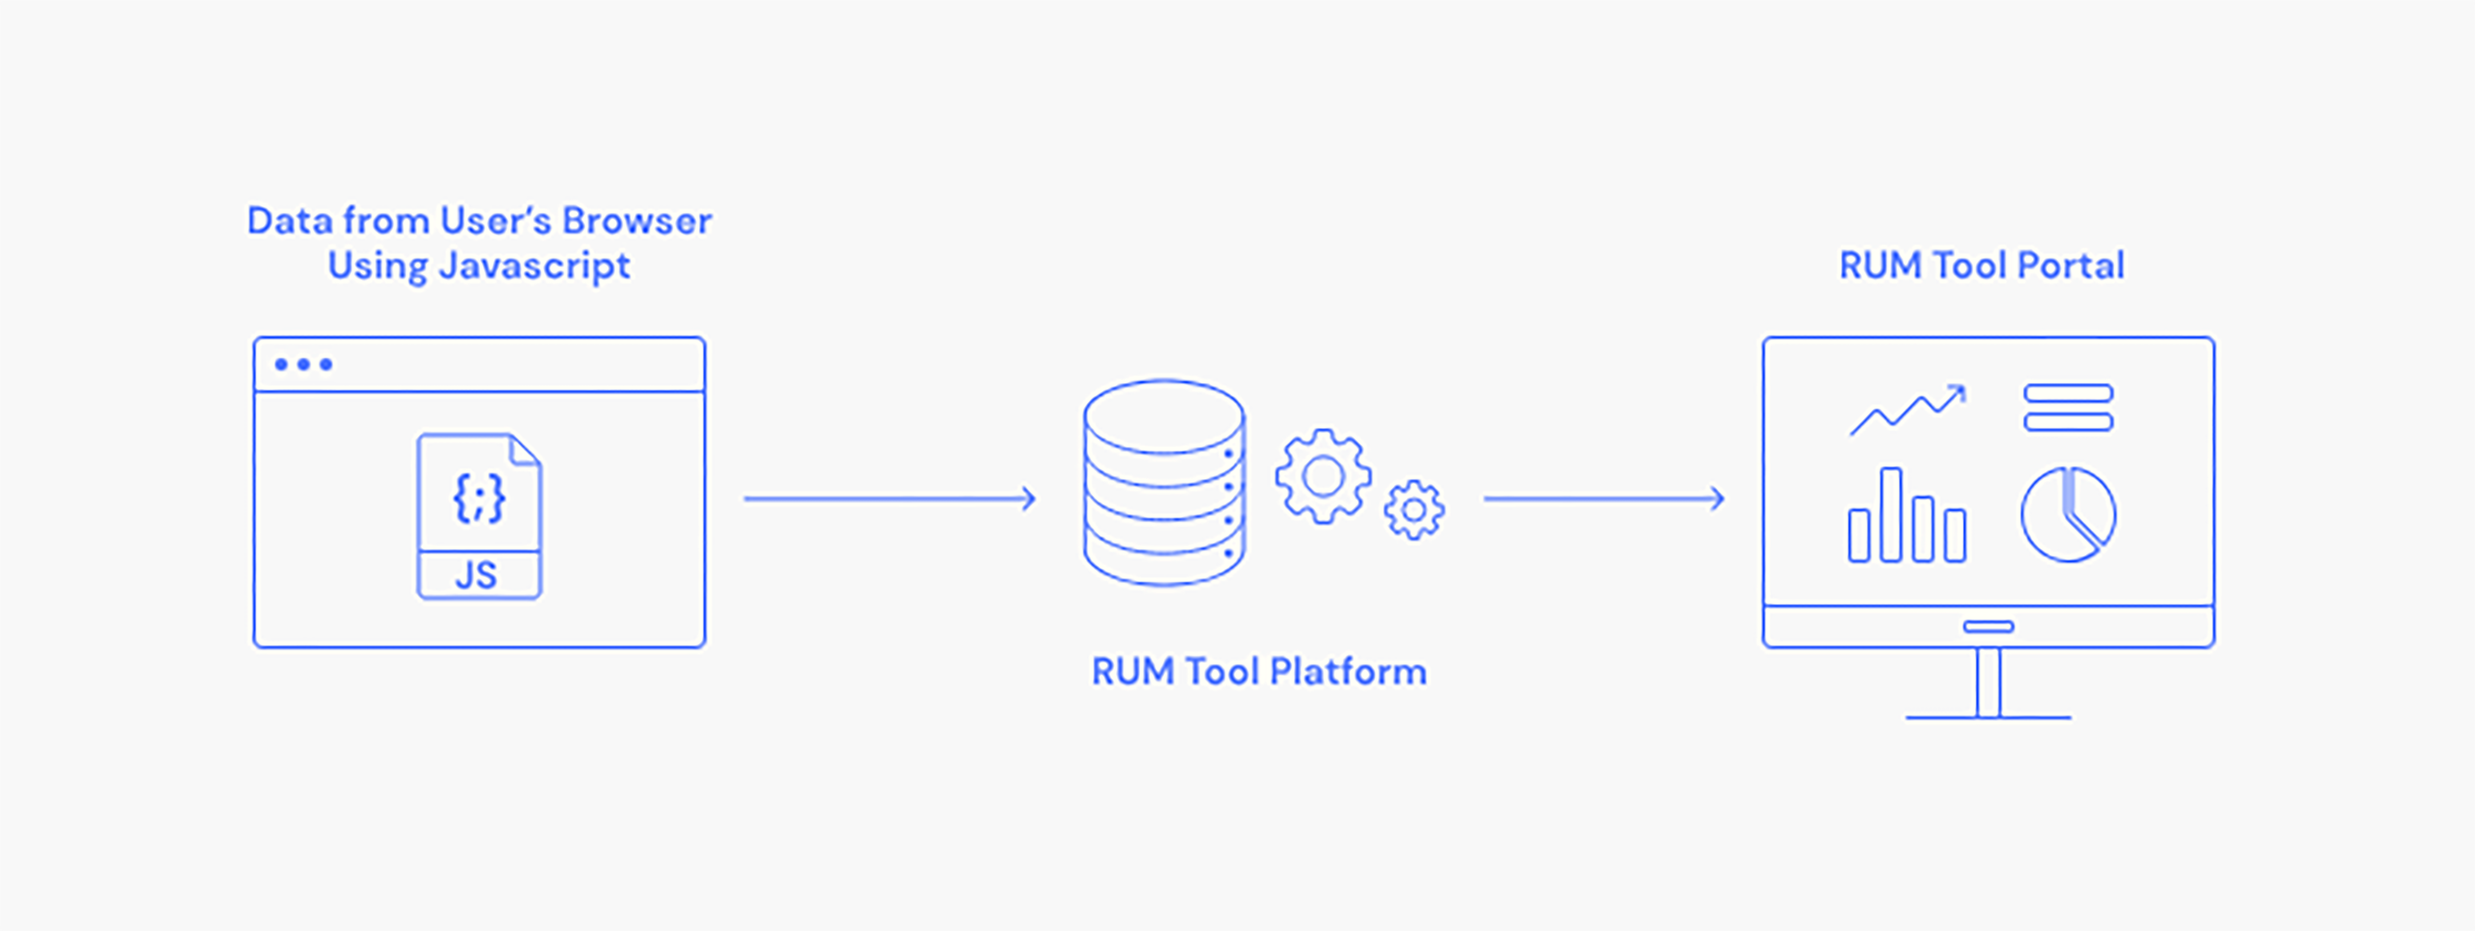
Real user monitoring (RUM) is a powerful technique that captures and analyzes the actual experiences of users interacting with a website. Unlike synthetic monitoring, RUM provides insights based on real-world usage patterns and conditions. It collects data on various aspects of user interactions, including page load times, navigation paths, and user behaviors. This data is invaluable for understanding how different user segments experience the site across various devices, browsers, and network conditions. RUM helps identify performance bottlenecks, usability issues, and areas for improvement that might not be apparent through synthetic testing alone. Real user monitoring is particularly useful for tracking the following metrics:
Time to First Paint/Render
It measures the time it takes for the browser to render the first pixel on the screen after a user navigates to a webpage. This metric indicates how quickly users perceive that the page is loading. A small JavaScript snippet is embedded in the webpage to collect this metric. This script listens for specific browser events, such as when the rendering engine begins painting pixels, enabling developers to analyze and optimize loading times effectively.
Document Complete
It tracks the moment when the browser fully loads and parses the entire HTML document. This includes all scripts and stylesheets but does not account for images or other resources that may still be loading. This metric can be collected via JavaScript event listeners that fire when the DOMContentLoaded event occurs, signaling that the document is fully loaded and ready for manipulation.
Visually Complete
It measures when all visible elements of a webpage are rendered and visible to users without scrolling. To collect this data, developers can use JavaScript libraries that monitor the loading of elements on the page, such as images and videos, and determine when all critical components are visible.
Time to Interactive (TTI)
TTI measures how long it takes for a page to become fully interactive, meaning users can click buttons, fill out forms, and interact with content without delay. To collect TTI data, JavaScript code is used to monitor when all critical resources have loaded and when event handlers are registered, allowing developers to pinpoint interactivity delays and optimize performance accordingly.
Synthetic monitoring
Synthetic monitoring simulates user interactions with a website or application to proactively identify performance issues before they affect actual users. This method employs automated scripts to execute predefined actions—such as logging in, navigating through various pages, or completing transactions—under controlled conditions. Synthetic monitoring provides consistent and comparable data on website performance by conducting various checks at regular intervals, including:
- Availability checks: Verify that the website and its critical pages are accessible.
- Performance checks: Measure page load times, response times, and resource utilization.
- Functionality checks: Ensure core features such as search, forms, and shopping carts are functioning correctly.
- API checks: Monitor the performance and availability of APIs that the website relies on.
- Third-party content checks: Track the performance of external scripts and resources.
Synthetic monitoring allows for granular analysis of user journeys by breaking down response times into incremental steps. This detailed approach helps uncover specific performance bottlenecks that may not be evident through traditional monitoring methods. Synthetic monitoring can also help simulate different browser environments and network conditions, ensuring that all potential user scenarios are accounted for. This capability is particularly beneficial for testing new features before production deployment, allowing teams to validate functionality and performance in a controlled setting.
While RUM captures actual user experiences, its reliance on real-world conditions can introduce variability that obscures the root cause of performance issues. Synthetic monitoring, with its controlled environment and predefined actions, provides a stable baseline and can complement RUM to offer a clearer picture of website performance. The approach proves especially useful for testing in staging environments, monitoring during off-peak hours, and evaluating critical user journeys that might otherwise occur infrequently in organic traffic.
Network latency
Network latency measures the time it takes for data to travel from its source to its destination across a network. In website monitoring, it often refers to the delay between a user’s action (like clicking a link) and the website’s response.
However, it’s important to recognize that today’s websites rarely operate from a single server. Instead, they depend on a complex web of interconnected services and resources.
Latency in a multi-dependency environment
Modern websites rely on various dependencies, including:
- CDNs (Content Delivery Networks): Serve static content, such as images and scripts, from servers located closer to users.
- APIs (Application Programming Interfaces): Connect to external services for data and functionality, such as payment gateways or social media integrations.
- Third-party scripts: Integrate features such as analytics tracking, advertising, and social media widgets.
- Databases: Store and retrieve dynamic content.
Each of these dependencies introduces potential points of latency. The overall performance of a website is determined not just by the latency between the user and the main server, but also by the latency between the client and each of these dependencies. A slow-loading API or a congested CDN can significantly impact the user experience, even if the main server is performing optimally.
Analyzing network paths with Traceroute
The traceroute command available in Linux and Windows operating systems helps visualize a complex network path by providing valuable insights into the path data packets take from one host to another. For example, running the command traceroute www.google.com might yield a result like this:
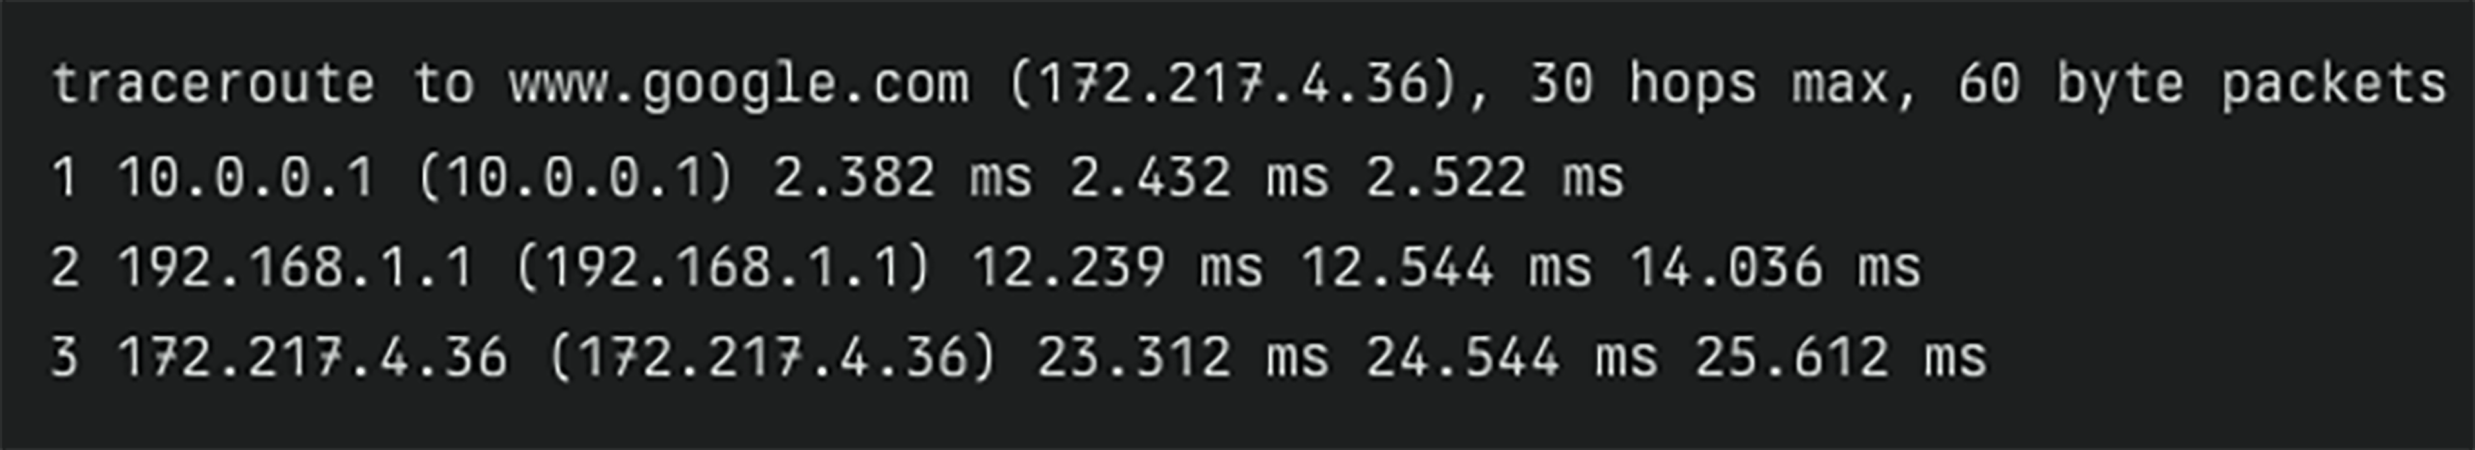
In this output, each line represents a “hop” that a data packet makes along its journey to the destination server, starting from your local router and progressing through intermediate routers until it reaches Google’s server.
- Hop Number: The first column indicates the sequence of hops to reach the destination.
- IP Address: The second column shows the IP address of each router along the path.
- Response Times: The three-time values (in milliseconds) represent the round-trip time for each packet sent to that hop.
Real-time monitoring of network latency can help identify issues related to server location, network congestion, or inefficient routing. By tracking latency across different geographic regions and network providers, businesses can optimize their infrastructure, implement content delivery networks (CDNs), or adjust server locations to minimize delays and improve overall user experience. Read our article titled “How to Read a Traceroute” to learn more about using this command.
Domain Name Service (DNS)
DNS monitoring focuses on assessing the performance, reliability, and resolution speed of the Domain Name System (DNS) to ensure users can consistently access website resources. DNS is responsible for translating human-readable domain names into IP addresses, making it a critical component of website accessibility. In other words, without DNS, users can’t access a website by typing its URL domain in a browser unless they know its specific IP address. Often, because modern websites rely on a network of different services, each with its own domain name that needs resolving.
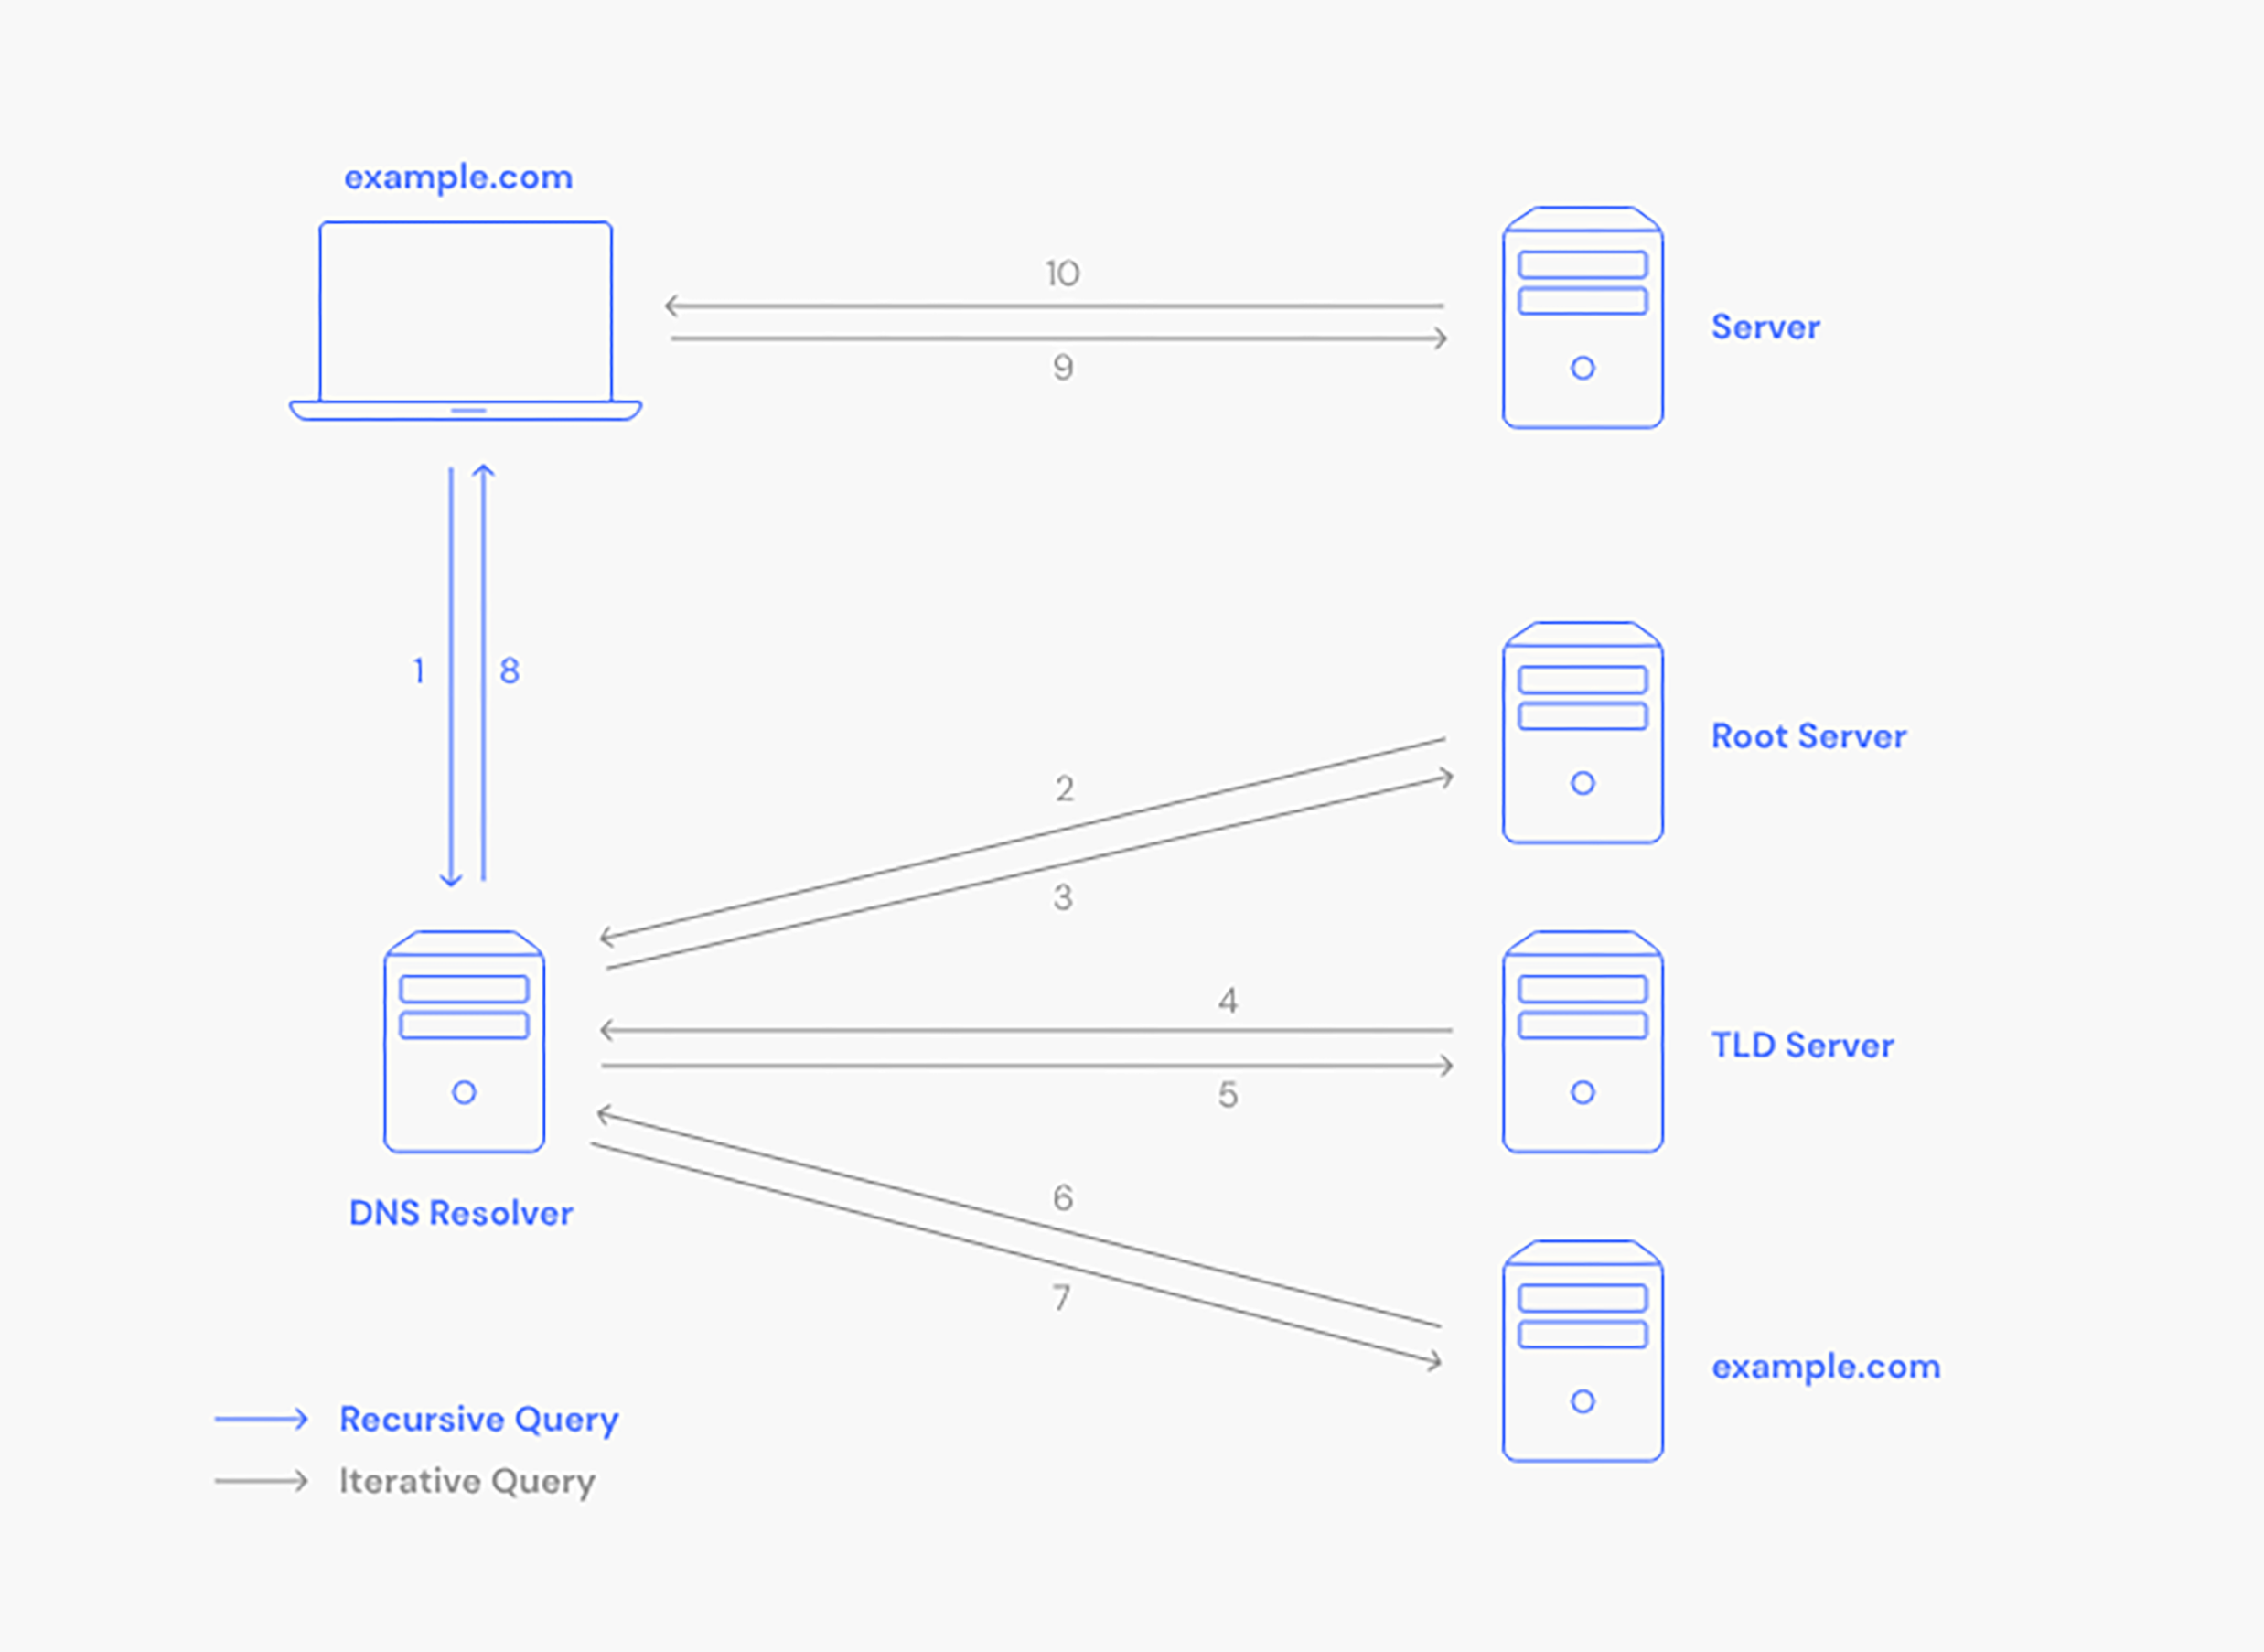
To further complicate matters, DNS is a recursive protocol. When a user attempts to access a website, their computer first asks its configured DNS server (often provided by their ISP) to resolve the domain name. This server then traverses a hierarchical tree of DNS servers across the internet, starting with the root servers and progressing through top-level domain servers and authoritative name servers, until it finds the IP address associated with the domain. The process is repeated for each dependency involved in loading the website. If any of these servers in the chain are slow to respond or misconfigured, the entire resolution process is delayed, ultimately making the website appear slow or even inaccessible to the user.
Monitoring DNS involves checking the responsiveness of DNS servers, the accuracy of DNS records, and the time taken to resolve domain names. Real-time DNS monitoring can detect misconfigured DNS records, slow DNS resolution times, or DNS server outages. By promptly addressing these issues, businesses can prevent situations in which users are unable to access their website at all due to DNS-related problems.
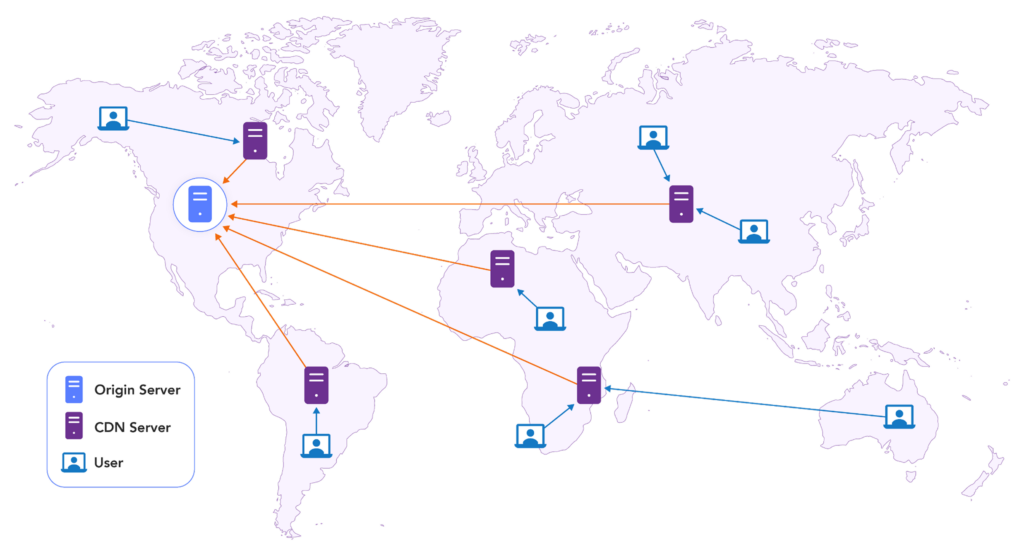
Content Delivery Network (CDN)
For websites using CDNs to optimize performance and minimize latency, monitoring ensures that cached content is effectively distributed and accessible, maintaining high availability and fast load times across regions. A CDN distributes website content across multiple geographically dispersed servers, allowing users to access data from the nearest location.
Real-time CDN monitoring involves tracking the performance of these distributed servers to ensure content is properly cached and delivered efficiently. Key metrics include cache hit ratios, origin fetch times, and regional response times.
By monitoring CDN performance in real-time, businesses can identify issues such as misconfigured caching rules, overloaded edge servers, or regional performance discrepancies. This enables quick optimizations to ensure fast, reliable content delivery to users worldwide, enhancing the user experience and potentially improving search engine rankings.
API monitoring
API monitoring is essential for websites and applications that depend on external data sources. The API on which the website depends might be from a service supported by the IT team that manages the website (e.g., a microservices API) or provided by a third-party service (e.g., stock market ticker data).
API monitoring involves real-time tracking of API performance, availability, and payload correctness, focusing on various key aspects, including:
- Response time: Measuring the time it takes for the API to respond to requests for identifying potential bottlenecks and slowdowns.
- Error rates: Tracking the frequency of errors, such as HTTP status codes (e.g., 400 Bad Request, 500 Internal Server Error), to identify API failures and inconsistencies.
- Data validation: Verifying the accuracy and completeness of the data returned by the API to ensure it meets the expected schema and format.
- SLA monitoring: Tracking API performance against defined SLAs to ensure compliance and avoid penalties.
- Security monitoring: Implementing measures to detect and prevent unauthorized access and malicious activity targeting the API.
A collective form of monitoring helps detect issues such as slow responses, outages, and unexpected changes in API schemas (for example, the format of the JSON payload used in a REST API). The collected data from API monitoring also helps in the long term by alerting to SLA breaches caused by API issues and guiding priorities for internal API development to add new features.
User behavior metrics
User behavior metrics provide insights into how visitors interact with a website, offering valuable data for technical performance and business objectives. These metrics include session duration, page views per session, bounce rate, and user flow through the site. Real-time monitoring of user behavior can reveal immediate issues with site usability or performance. For instance, a sudden spike in bounce rate might indicate a problem with a landing page, while changes in typical user flows could suggest navigation issues or broken links.
Going beyond these traditional metrics, it’s also essential to consider those that reveal user frustration. Are visitors encountering obstacles or experiencing friction in their interactions? Metrics like rage clicks (repeated clicks on unresponsive elements), error clicks, and dead clicks can highlight pain points in the user experience. For instance, a high number of rage clicks on a particular button might indicate that it’s not working as expected or is too slow to respond.
Segmenting users based on behavior, such as frequent visitors versus first-time users, can provide deeper insights into differing needs and preferences. For example, if returning users exhibit a high drop-off rate during checkout, it may indicate a need for streamlined processes or enhanced loyalty incentives. Tools like session recordings can further illuminate this by showing real-time interactions, helping teams observe how users navigate the site and where they encounter obstacles.
Building an integrated monitoring strategy
Real-time website monitoring needs an integrated platform that connects all of these data sources. A fragmented monitoring strategy results in disjointed troubleshooting and delays in identifying root causes.
LogicMonitor’s platform brings together real user monitoring, synthetic monitoring, network and DNS visibility, CDN performance, and API tracking in a single system. Through Catchpoint, LogicMonitor provides Internet and experience visibility across the full digital delivery chain, covering real users, simulated transactions, networks, CDNs, DNS, and APIs from a global agent network. Tools like Internet Stack Map and Internet Sonar offer teams a real-time view of Internet infrastructure health and third-party dependencies, so they can distinguish between problems inside their environment and problems on the Internet path between them and their users.
By correlating data across these layers, teams can catch problems before users report them, cutting mean time to resolution and protecting digital experience.
CHAPTERS
NEWSLETTER
Subscribe to our newsletter
Get the latest blogs, whitepapers, eGuides, and more straight into your inbox.
SHARE
Get real-time visibility into every layer of your website performance.
See how LogicMonitor brings RUM, synthetic, DNS, CDN, API, and network monitoring together in one platform, so you can detect and resolve issues before they hit your users.
FAQs
What is real-time website monitoring?
Real-time website monitoring involves collecting performance data at frequent intervals, typically every few minutes, from multiple geographic locations, device types, and browsers. Unlike one-time audits, it provides a continuous view of availability and user experience as conditions change.
How is real-time monitoring different from a performance audit?
A performance audit gives you a point-in-time snapshot under specific conditions. Real-time monitoring runs continuously and captures how performance changes over time, including slowdowns during off-peak hours or in specific regions that a single audit would miss.
What does real-time monitoring measure that standard tools don’t?
Real-time monitoring tracks the entire transaction path: DNS resolution, CDN performance, network latency, third-party script behavior, and API response times. It also captures variation across device types and service providers, giving a fuller picture than any single point-in-time measurement.
How do I choose the right real-time website monitoring tool?
Look for global coverage from a large network of vantage points, support for both synthetic and real user monitoring, alerting on performance degradation, and visibility into external dependencies like DNS and CDN. Coverage depth matters as much as measurement frequency.

By Denton Chikura
Technical Writer

Denton Chikura is a technical writer and longtime observability advocate focused on helping site reliability engineers and engineering teams discover the tools and capabilities that strengthen internet resilience. He works at the intersection of monitoring, performance, and infrastructure to make complex systems more understandable and usable, bridging the gap between deep technical detail and real‑world operations. His goal is to help teams build faster, detect issues earlier, and recover smarter, ultimately making the internet a better, more reliable place for everyone.
Disclaimer: The views expressed on this blog are those of the author and do not necessarily reflect the views of LogicMonitor or its affiliates.
© LogicMonitor 2026 | All rights reserved. | All trademarks, trade names, service marks, and logos referenced herein belong to their respective companies.
