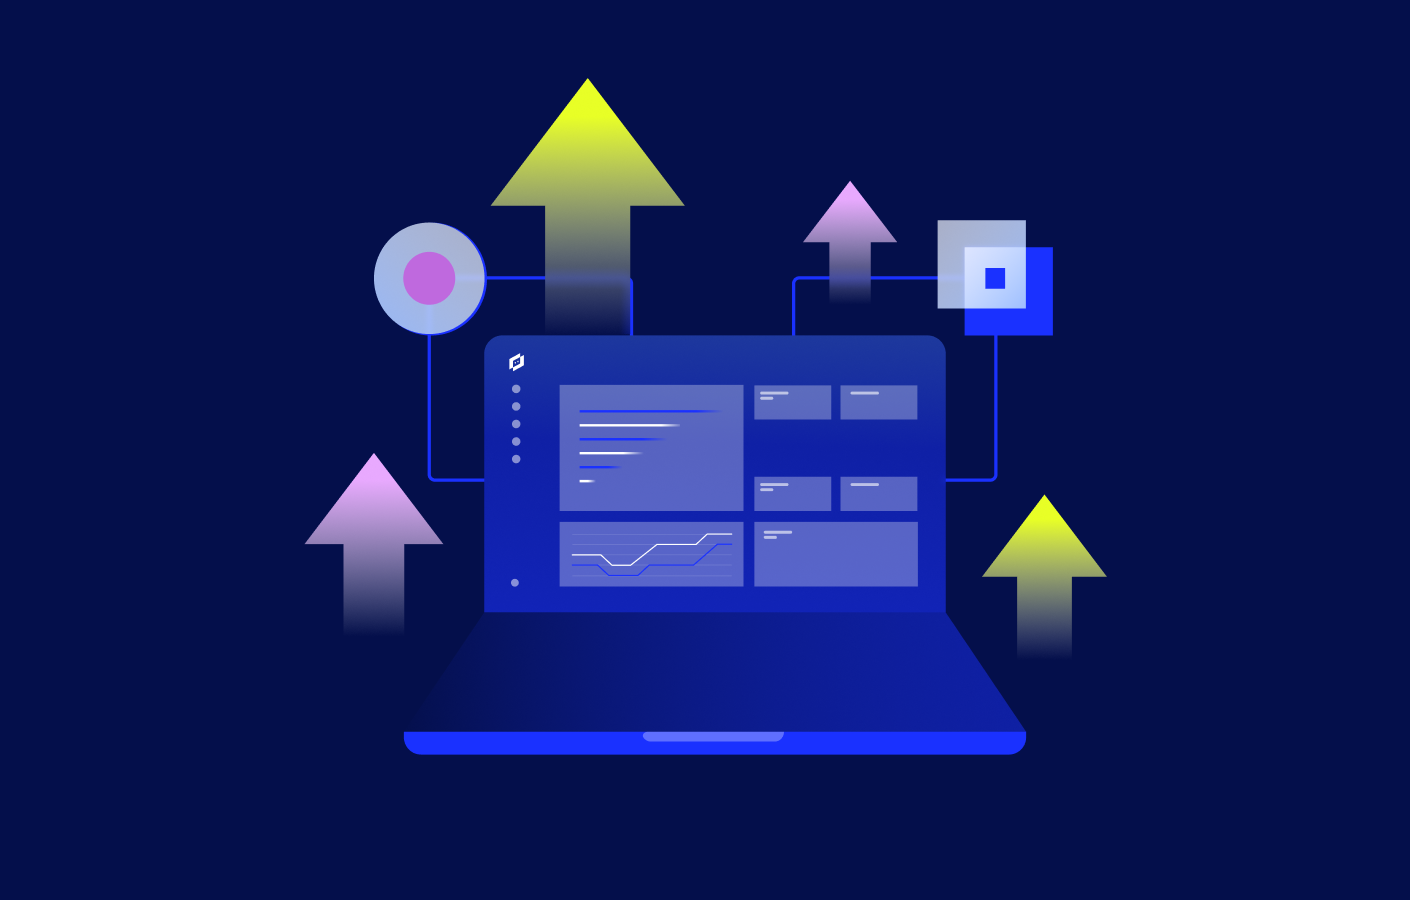
Internet Performance Monitoring (IPM) is essential for MSPs to move from reactive support to proactive experience assurance.
Internal metrics like server CPU and LAN latency don’t show you what’s happening in the last mile. ISPs, wireless carriers, BGP routing, CDNs, DNS, SSL, and dozens of third-party integrations sit between your infrastructure and the end user. Any one of them can cause an outage even when your core stack looks healthy
LogicMonitor via Catchpoint covers the full picture. LogicMonitor provides inside-out visibility across infrastructure, while Catchpoint IPM adds the outside-in layer, so MSPs can tell clients exactly what’s broken and whose problem it is
MSPs that can identify exactly where a SaaS or SASE provider is underperforming have something concrete to bring to vendor SLA conversations. That’s a different kind of relationship than finger-pointing
Few MSPs offer Internet Performance Monitoring today. Adding it creates a higher-margin service tier, stronger SLA capabilities, and a credible path into larger enterprise accounts
Green lights on your internal dashboard don’t mean users are having a good experience. That was the central tension in this conversation between LogicMonitor RVP of Managed Services, Daniel Gad, and Catchpoint Field CTO, Gerardo Dada, and it’s a problem most MSPs haven’t fully solved.
The discussion covered what it actually takes to monitor the full path between a user and an application, why traditional infrastructure tools miss most of it, and how MSPs can use that blind spot as a service differentiator rather than a liability.
What Experts Discussed
Why the internet is now the application layer
Almost every business process now runs across a globally distributed network of APIs, cloud services, and third-party integrations. Dada used a restaurant as an example with cloud-based POS, payment networks, and digital menus, to make the point that monitoring individual hardware devices tells you almost nothing about whether any of that is actually working for the people depending on it.
The blind spot between inside-out and outside-in monitoring
Traditional observability tools are built to monitor what you control: your network, your data center, your cloud infrastructure. Dada discussed what they’re not built to do: measure what a user in a different city, on a regional ISP, actually experiences. Internet Performance Monitoring fills that blind spot by testing from the user’s vantage point, not the infrastructure owner’s.
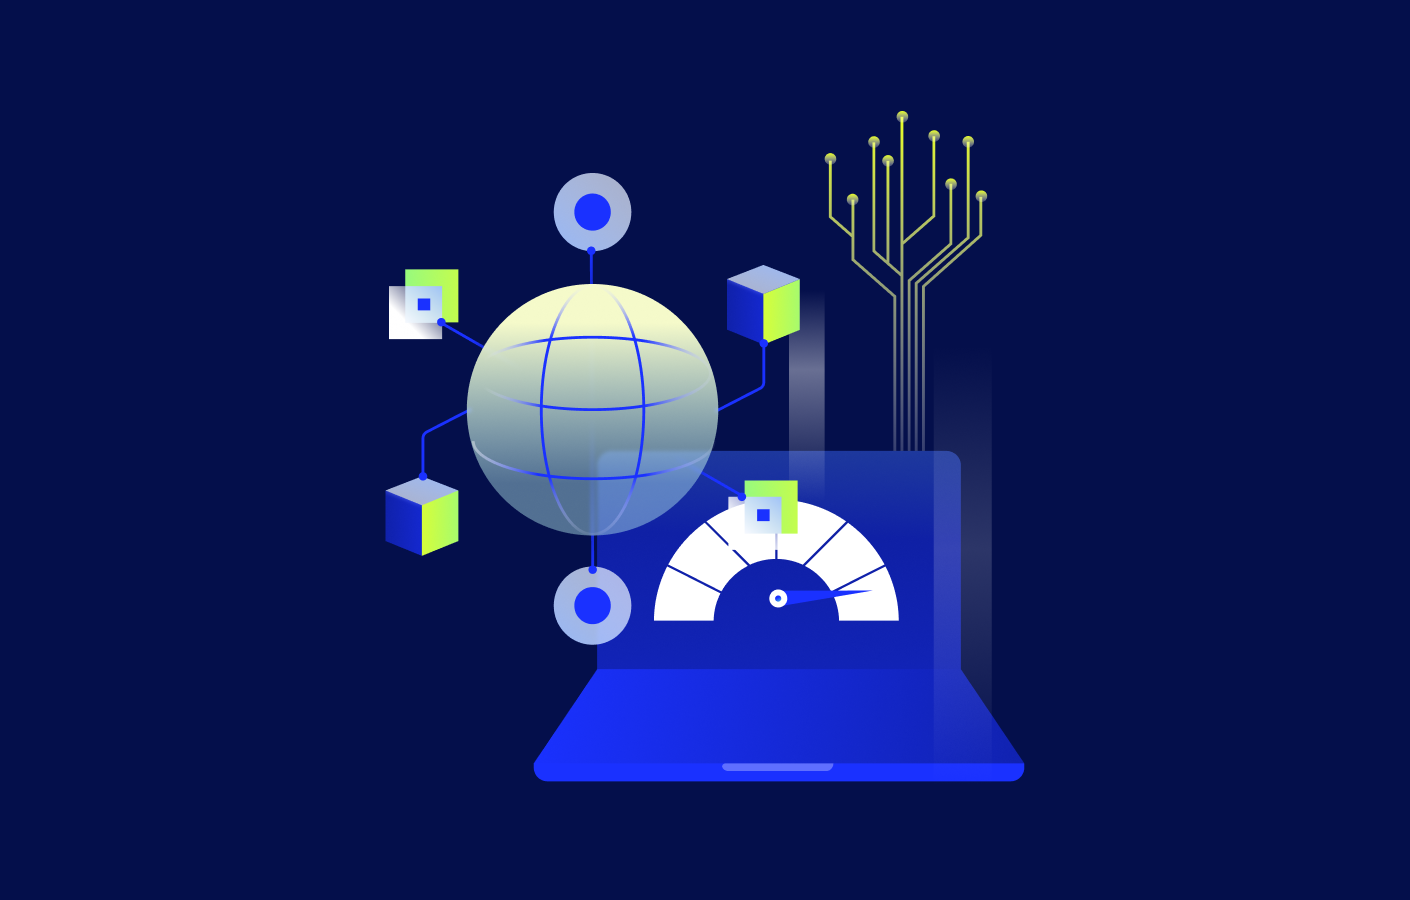
Mapping the stack nobody monitors
Gad and Dada kept returning to how much sits between a user’s device and an application’s code, DNS, SSL certificates, BGP routing, CDNs, and how rarely any of it gets monitored until something breaks. They walked through tools like Internet Stack Map and AI-driven Experience Scores as ways to visualize those dependencies and pinpoint root causes without wasting time investigating systems that are working fine.
From vendor disputes to accountable SLAs
Dada focused on a practical shift: instead of getting pulled into vendor finger-pointing when a third-party service underperforms, MSPs with objective telemetry can identify exactly where the problem is. That changes the dynamic with vendors, enables more accurate SLA tracking, and gives MSPs a credible basis for routing optimization decisions.
What MSPs should take from this
APM node coverage is narrower than most teams assume. Dada pointed out that traditional APM tools typically test from nodes inside major cloud hyperscalers, which doesn’t reflect what a user on a local wireless carrier or regional ISP actually sees. Useful Internet Performance Monitoring requires thousands of diverse global nodes, not a handful of well-connected ones.
One failing script can take down an entire site. The average enterprise website depends on dozens of external services, image delivery, tag managers, analytics. Dada’s point was that real-time visibility into those dependencies means you can identify and disable the problem quickly, rather than spending an incident window figuring out what broke.
Catching problems before users do is the whole point. Dada put it plainly: “If you’re waiting for the customers to show up at the bank and something’s broken and then they have to call IT, you’re being very reactive. LogicMonitor tests all the time so that if something happens at four o’clock in the morning, you get an alert, and ideally, you might be able to avert the problem and solve it before the customer finds out.”
Watch the On-Demand Webinar
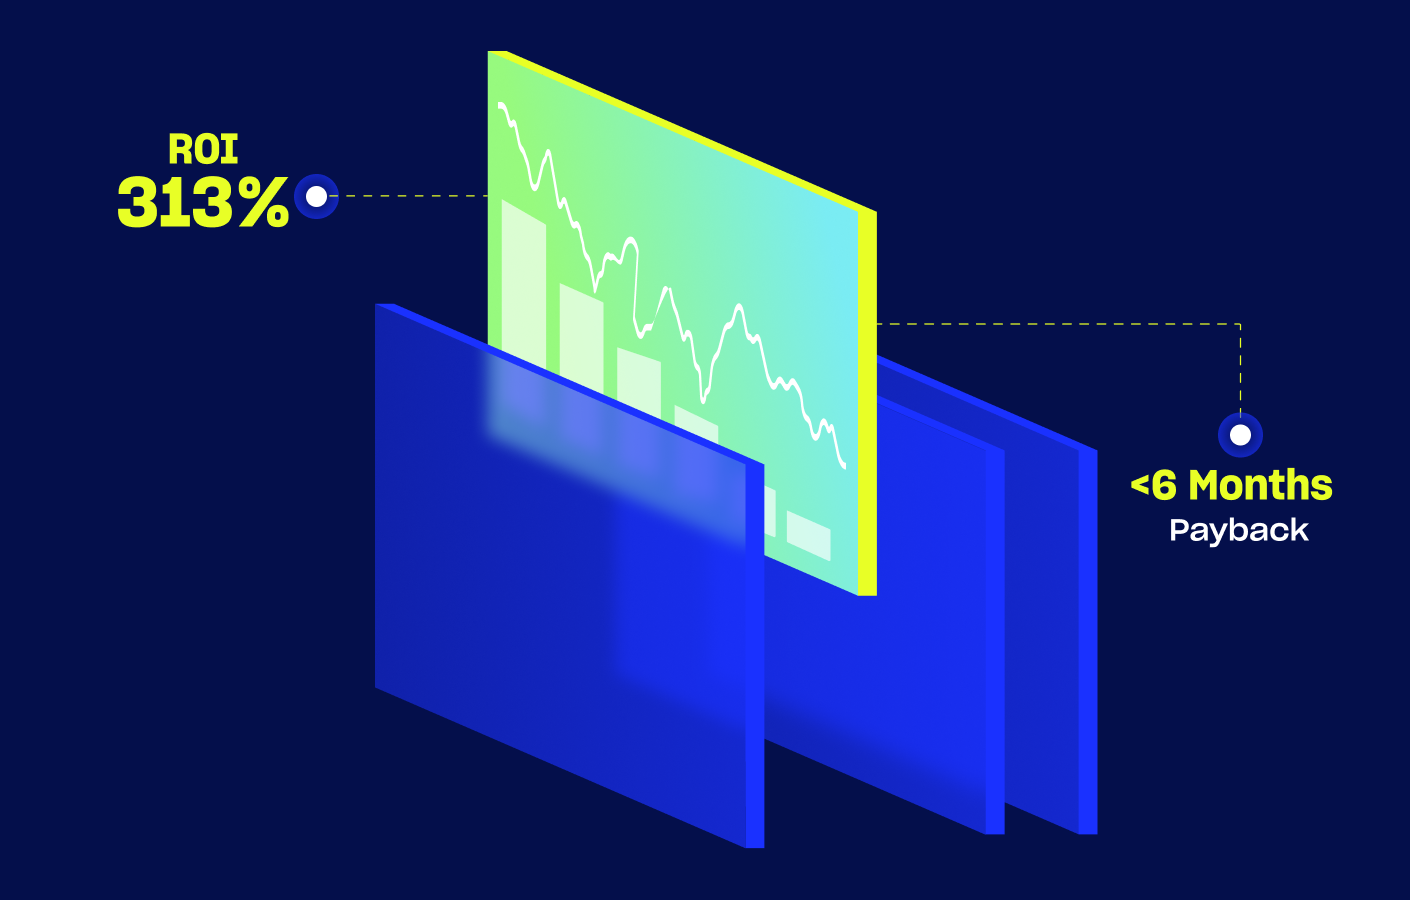
See how MSPs are adding Internet Performance Monitoring to their service offering and turning proactive experience assurance into a competitive advantage.
Autonomous IT Without Blind Spots: Covers how LogicMonitor addresses the visibility limitations that constrain most AI-powered monitoring tools, relevant context for MSPs evaluating what full-stack observability actually means in practice.
How to Reduce MTTR with AI: “Covers how AI helps operations teams detect issues earlier and reach root cause faster, directly relevant to the proactive monitoring case made in this session.
How to build a proactive and predictive monitoring approach: How an AIOps early warning system can shift teams from minimizing outages to avoiding them altogether, directly relevant to the proactive monitoring case made in this session.
Navigating observability challenges: A fireside chat with 451 Research — 451 Research analyst Mike Fratto and LogicMonitor’s Ben Radke discuss unified monitoring with real-world examples of organizations that solved fragmented visibility across hybrid and multi-cloud environments.
Hybrid Cloud Clarity Powered by AI: LogicMonitor and AWS walk through unified visibility across on-premises and cloud environments, with AI-driven alert prioritization.