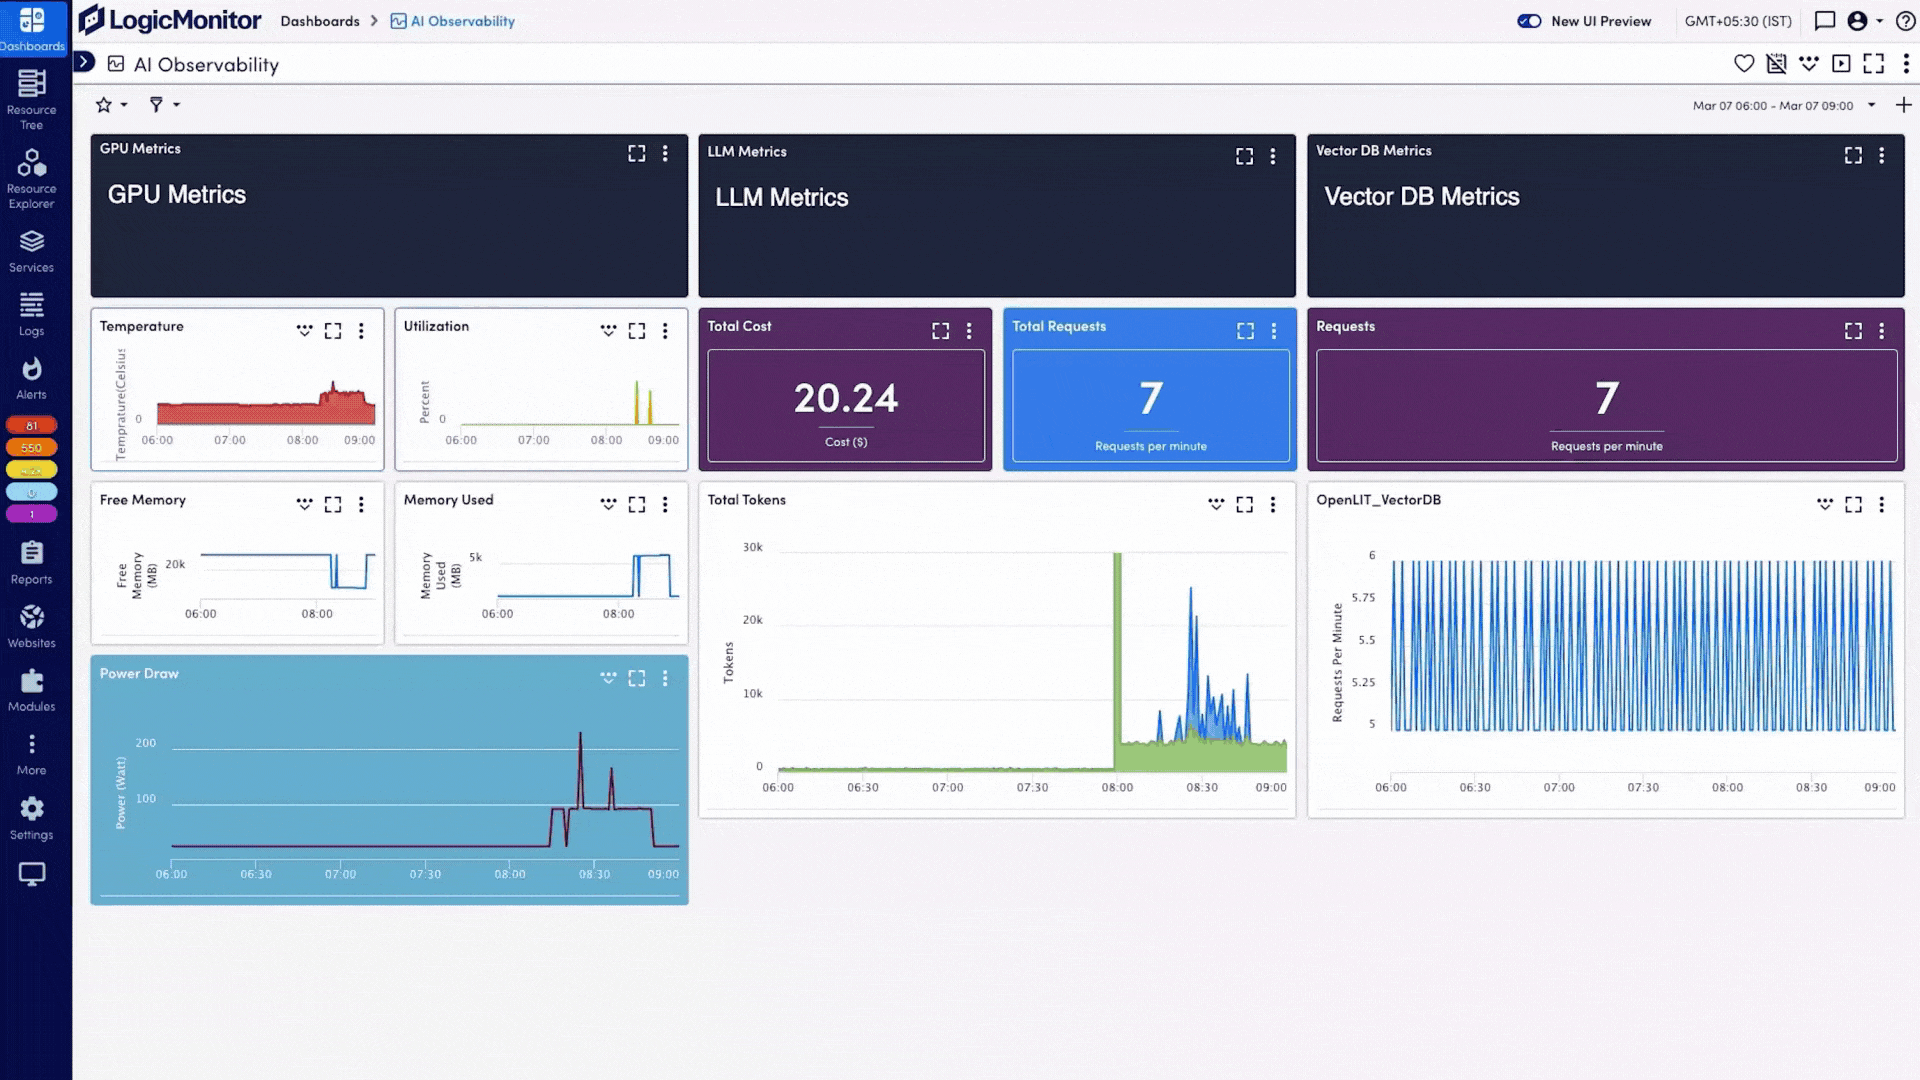
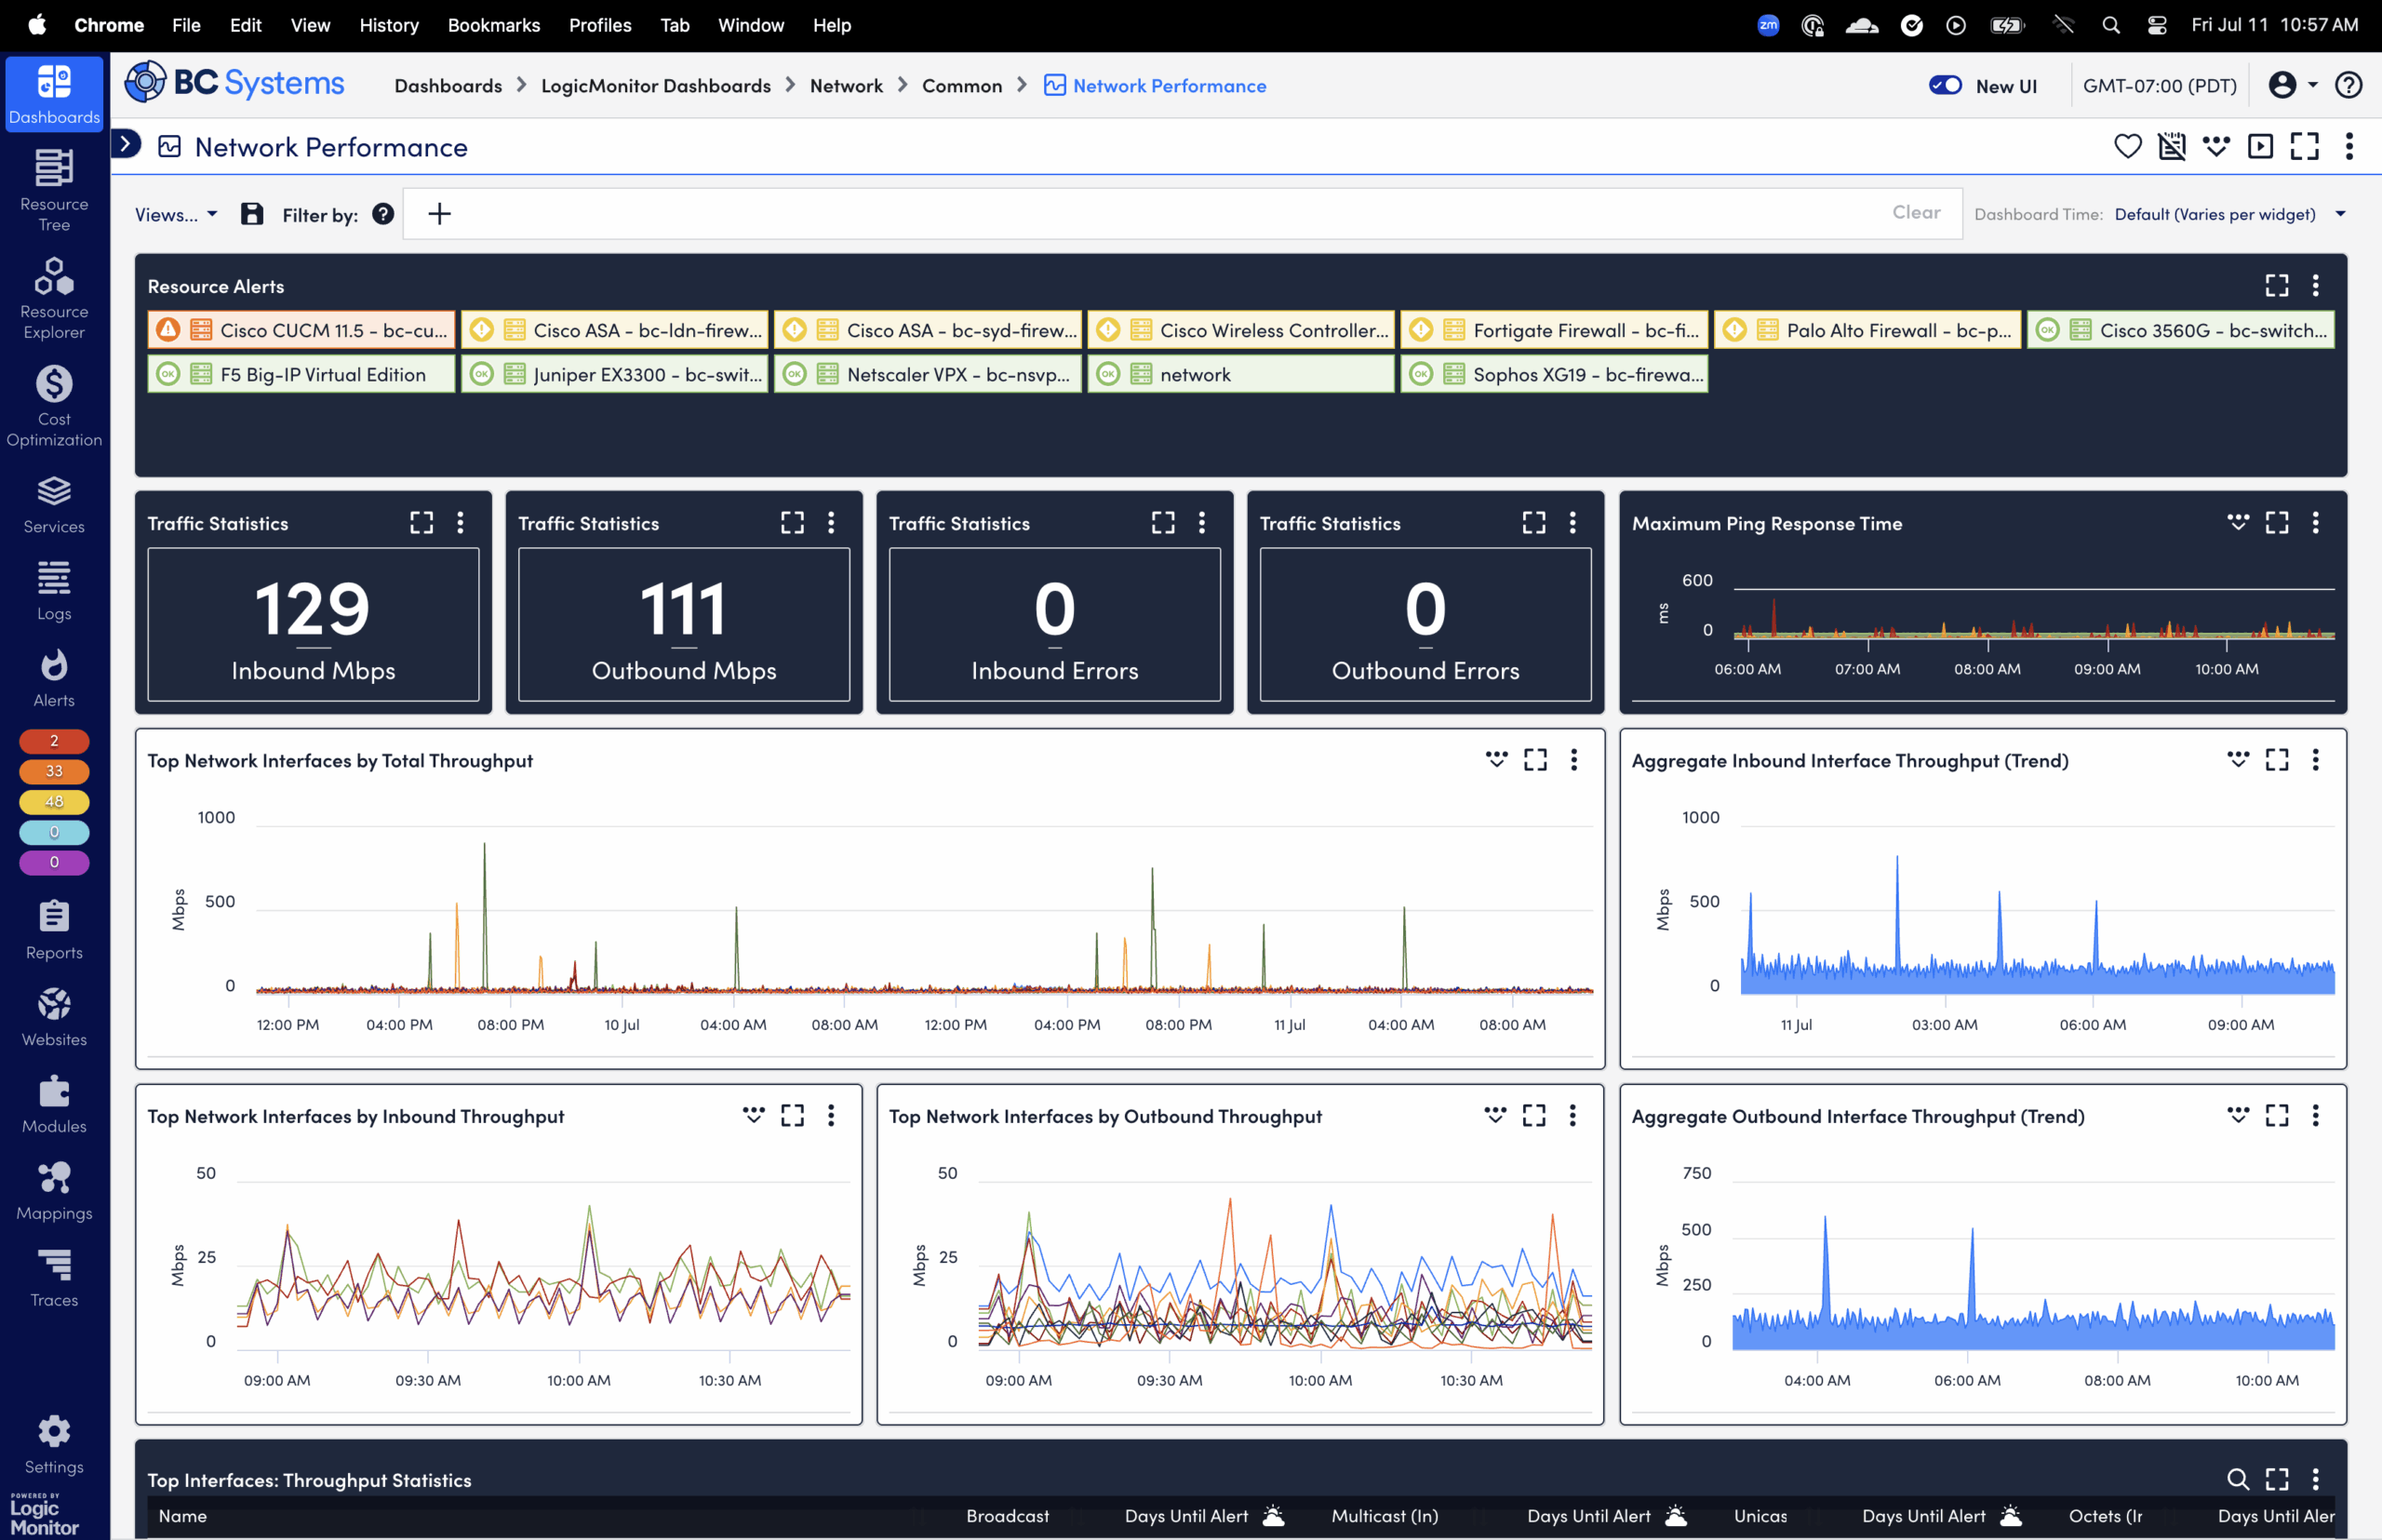
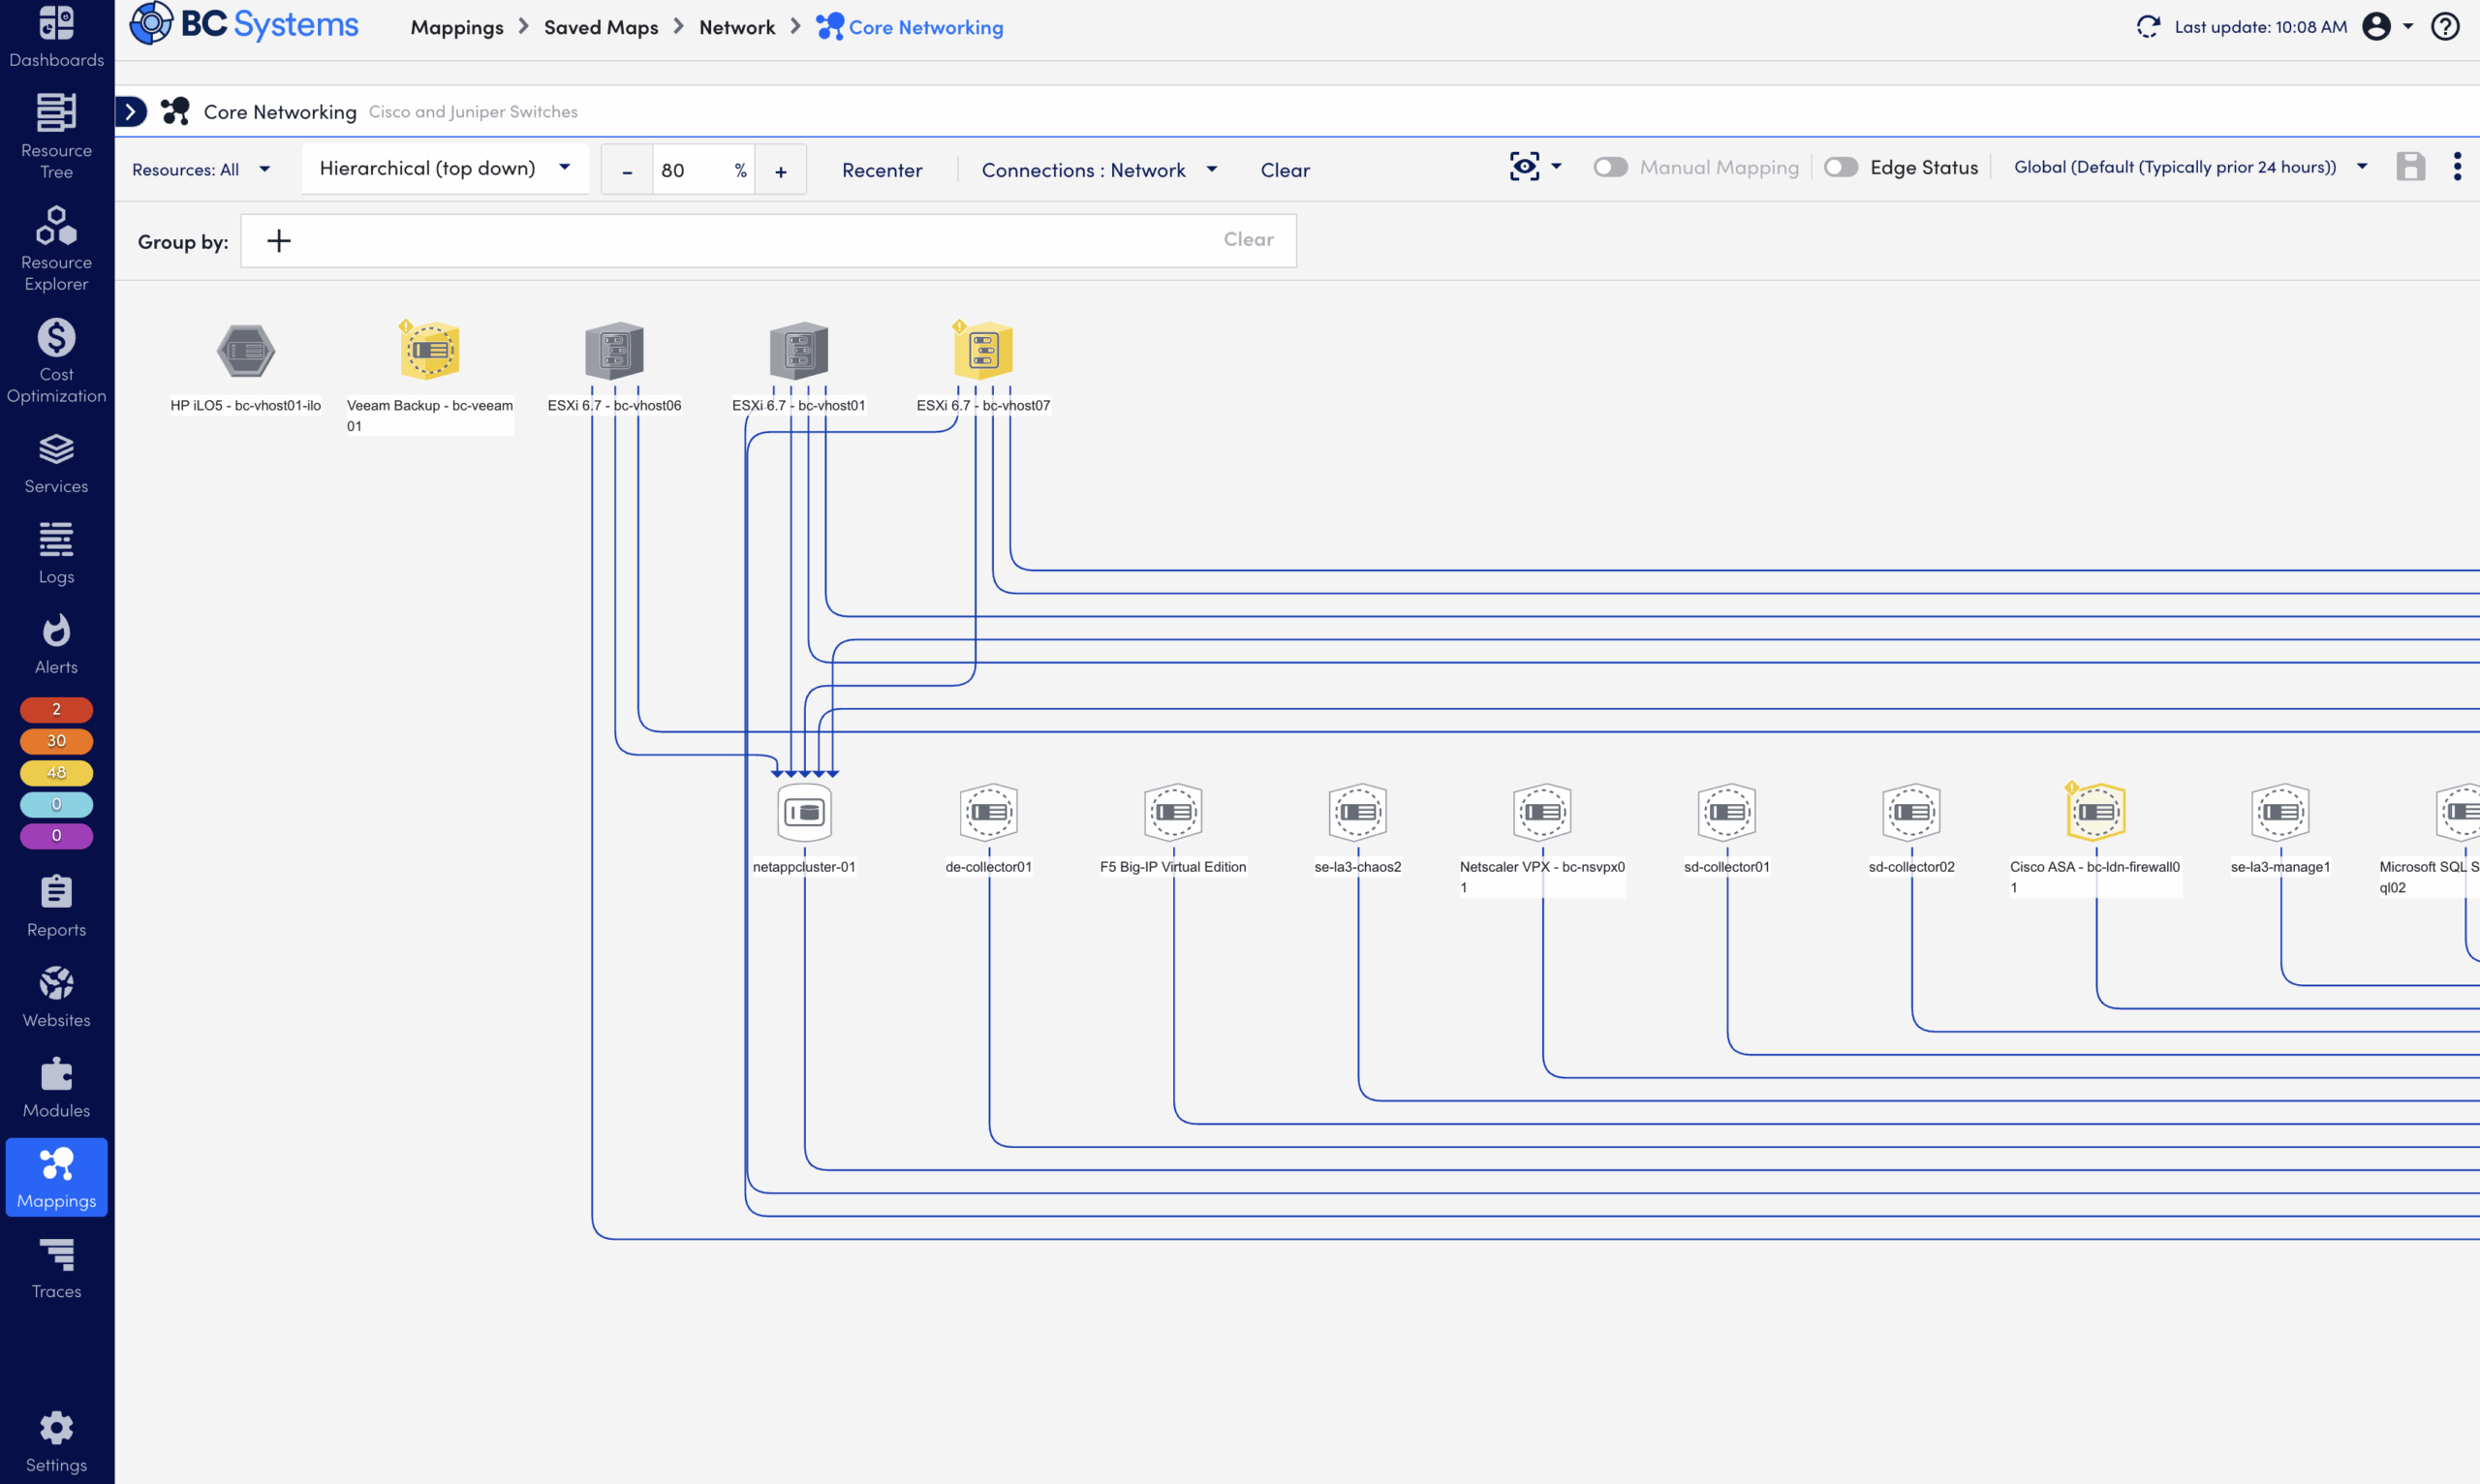
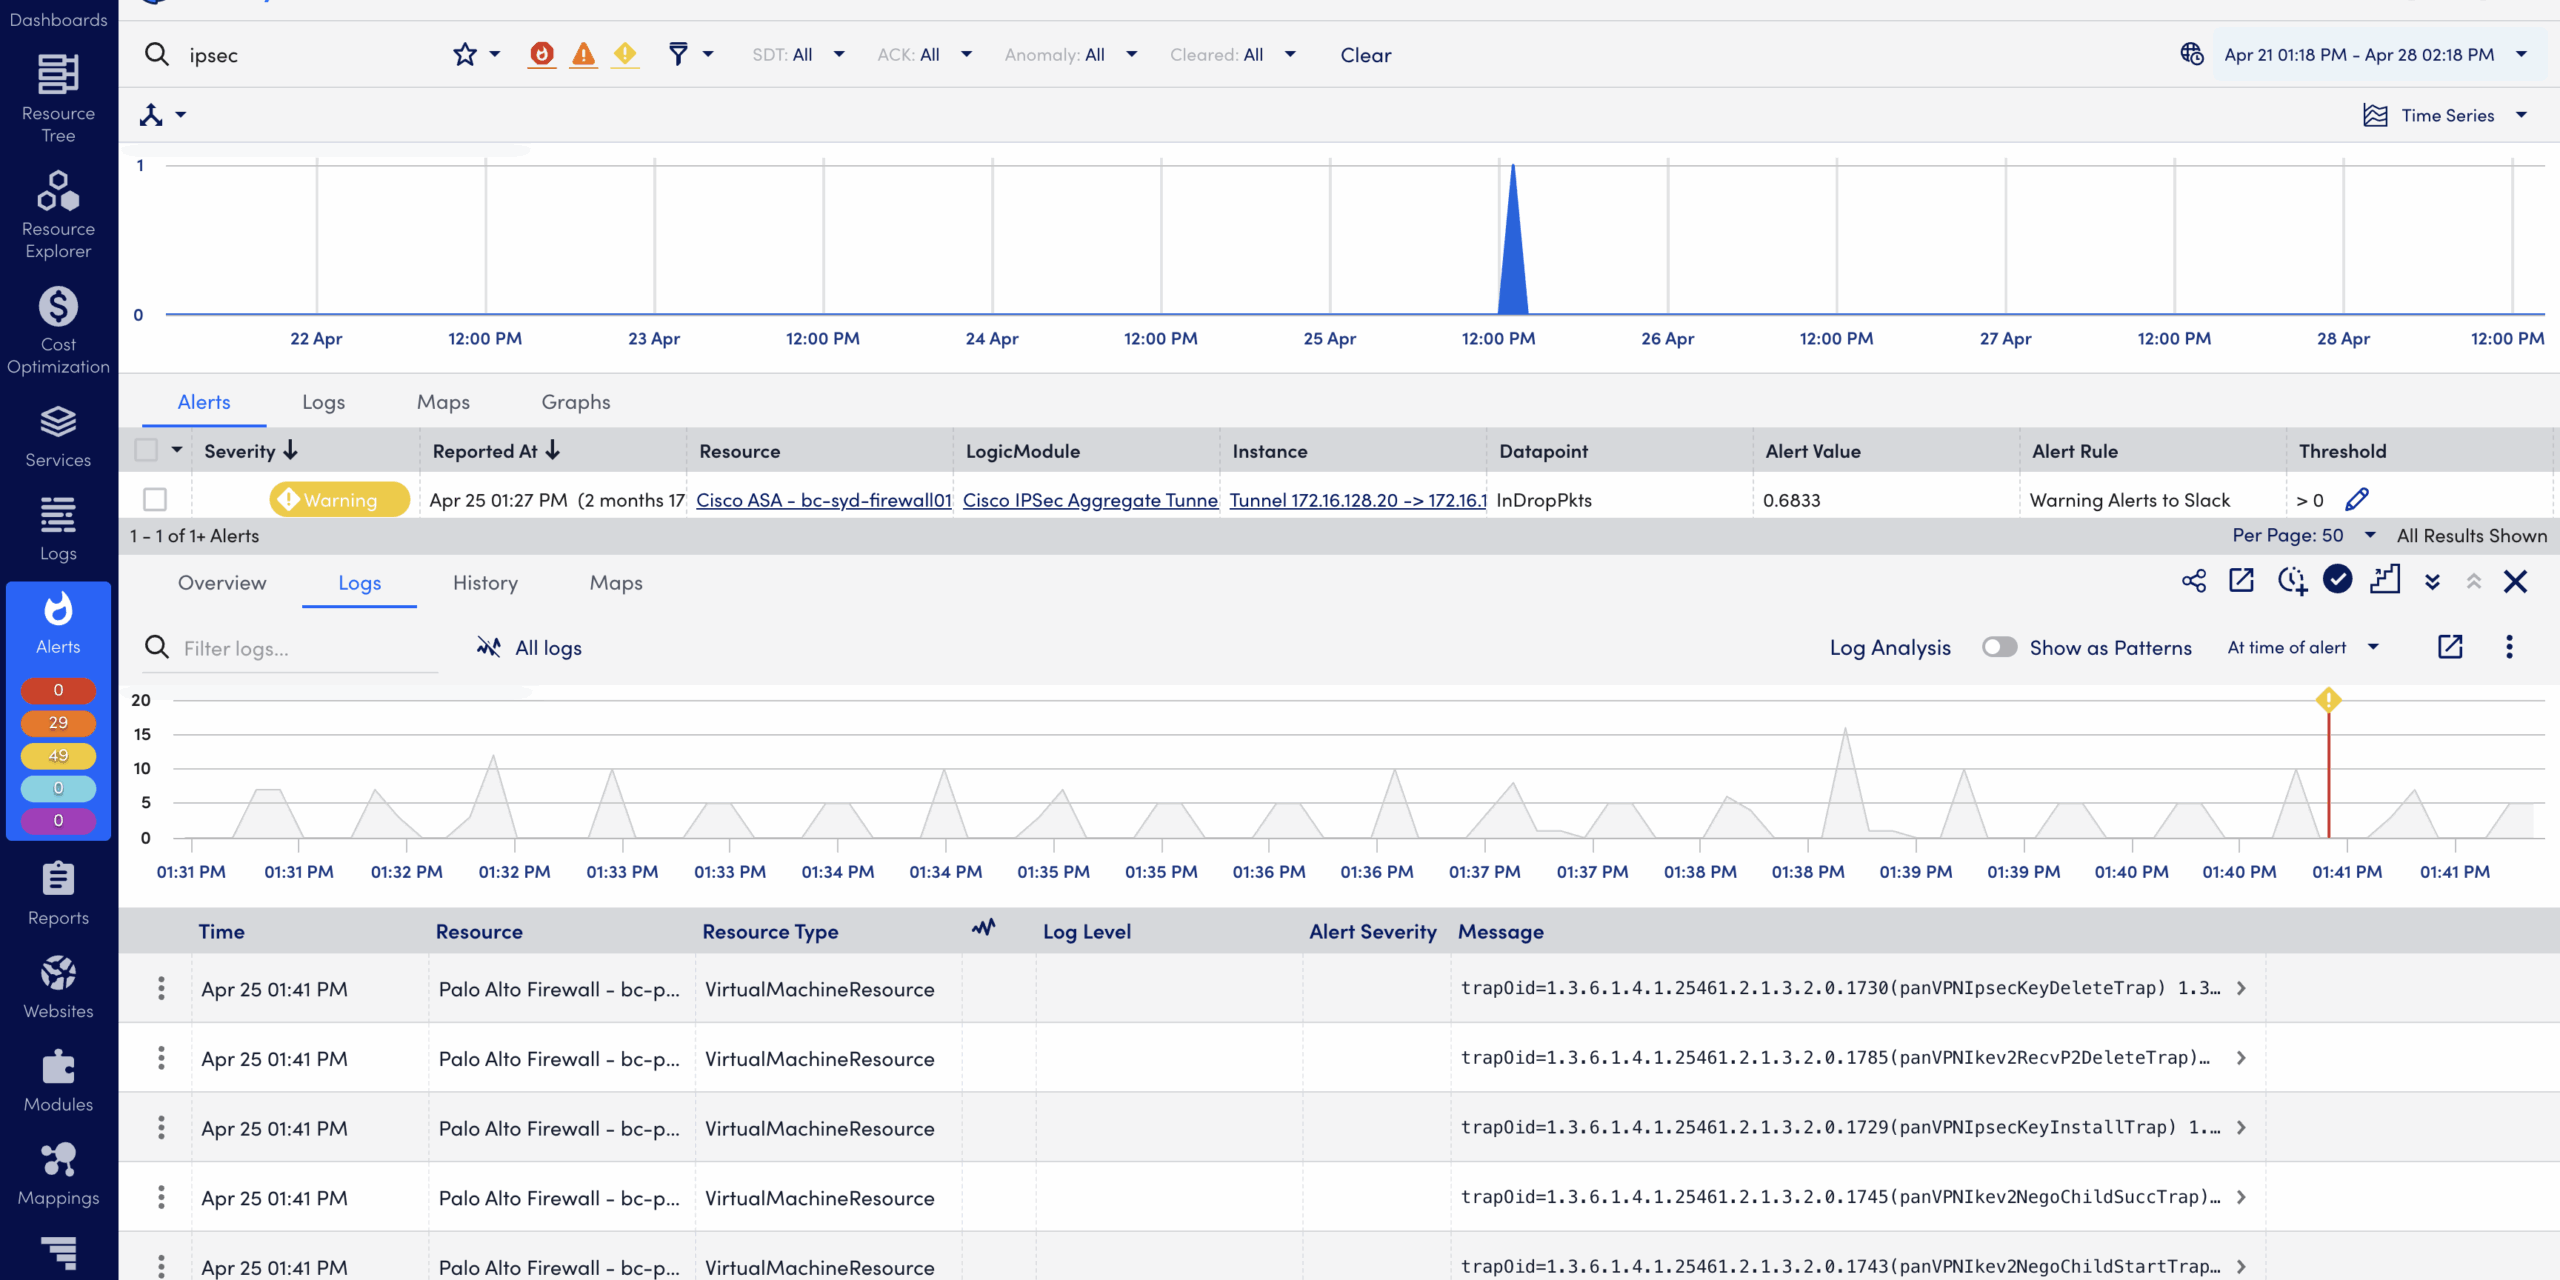
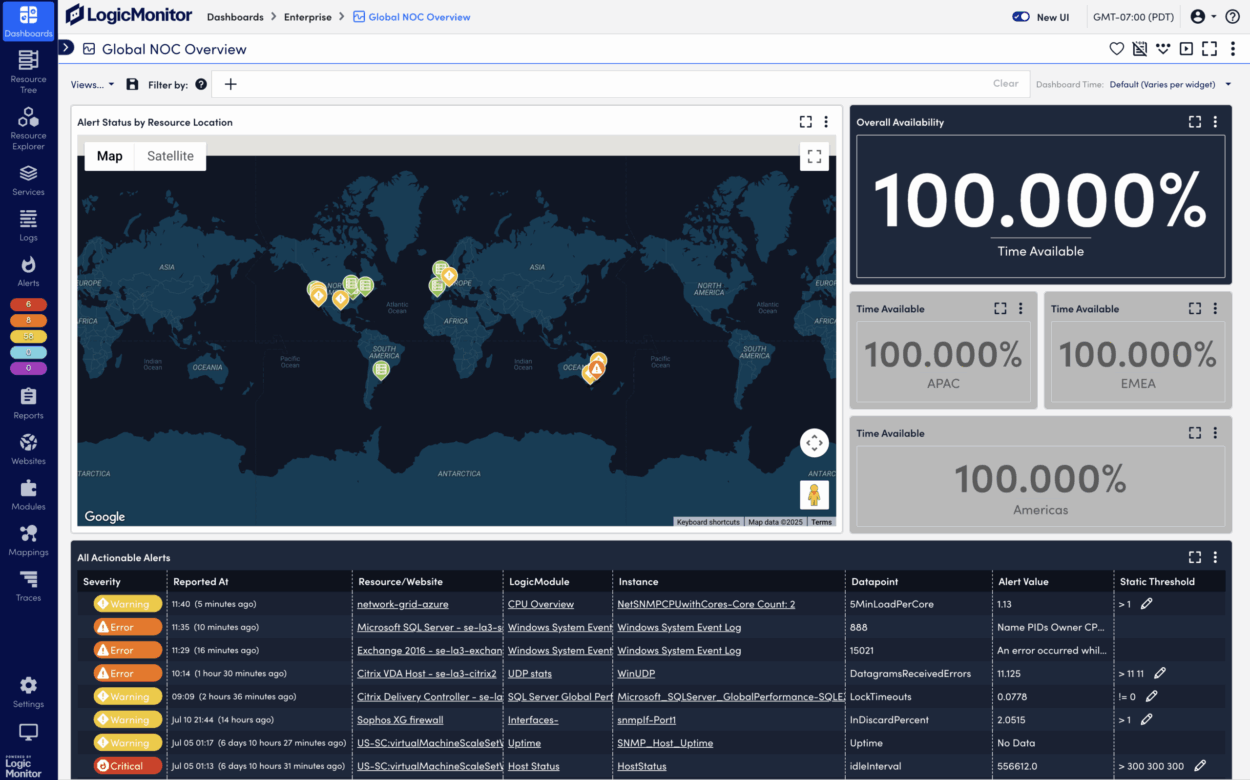
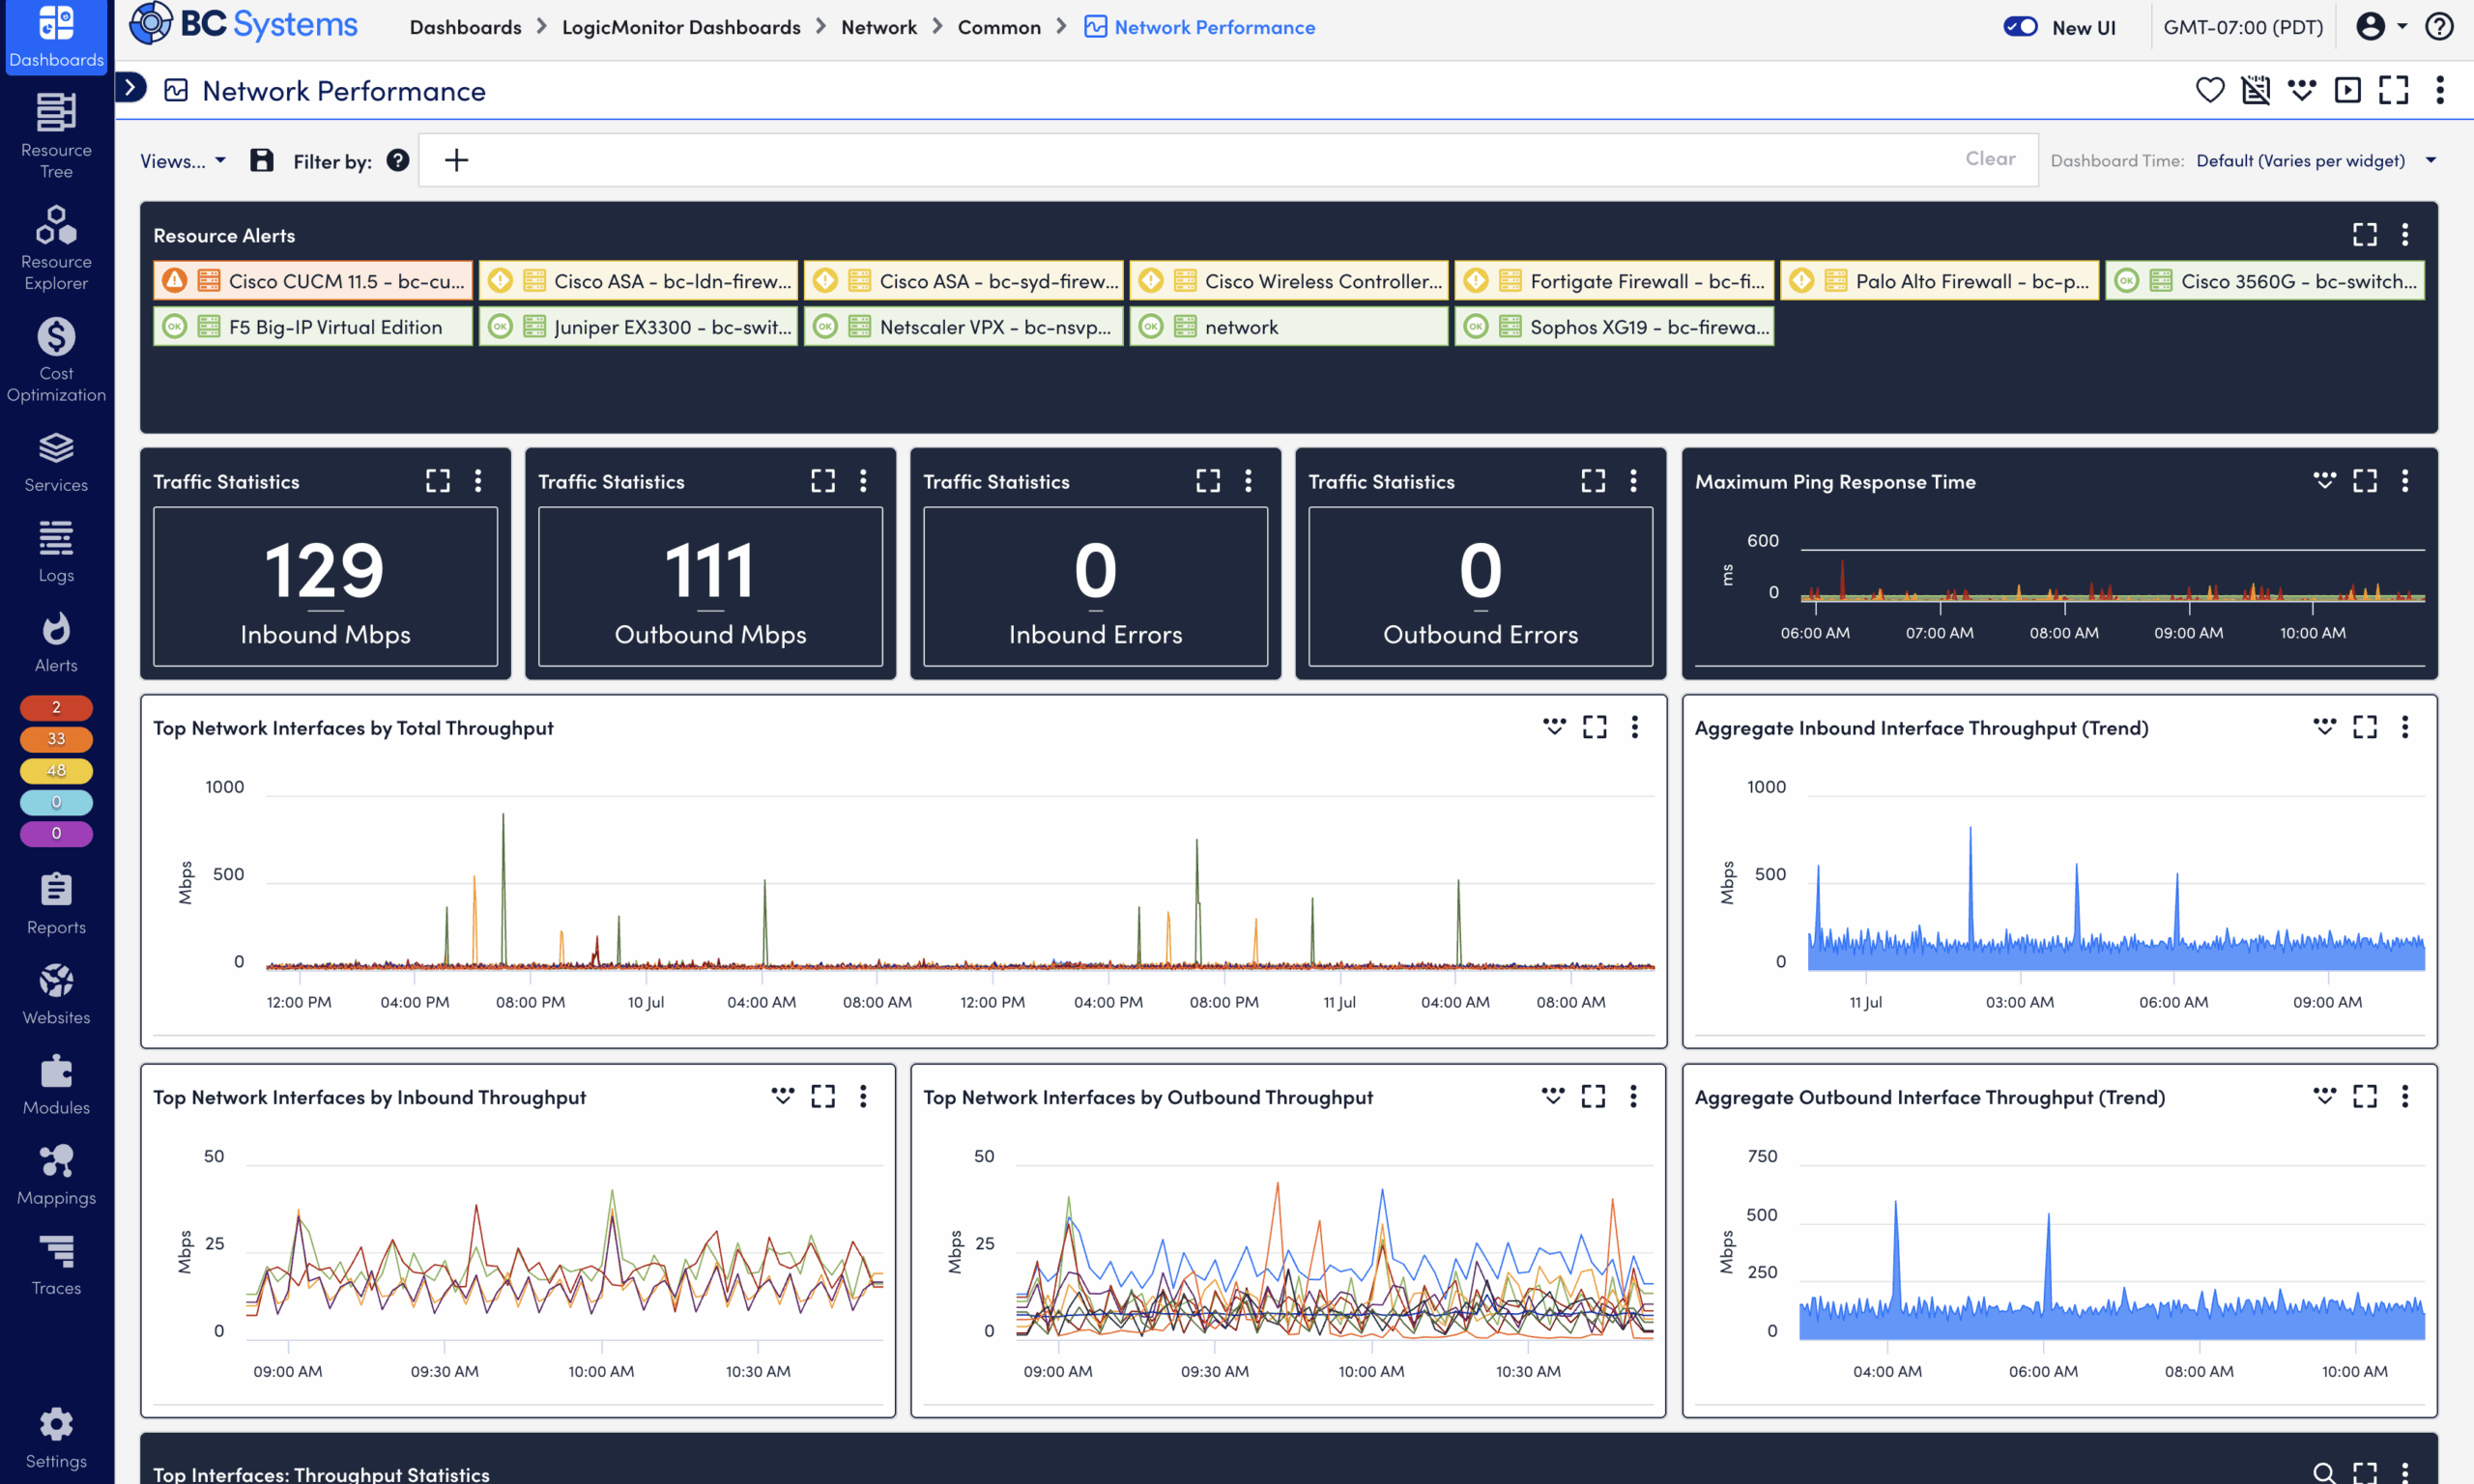
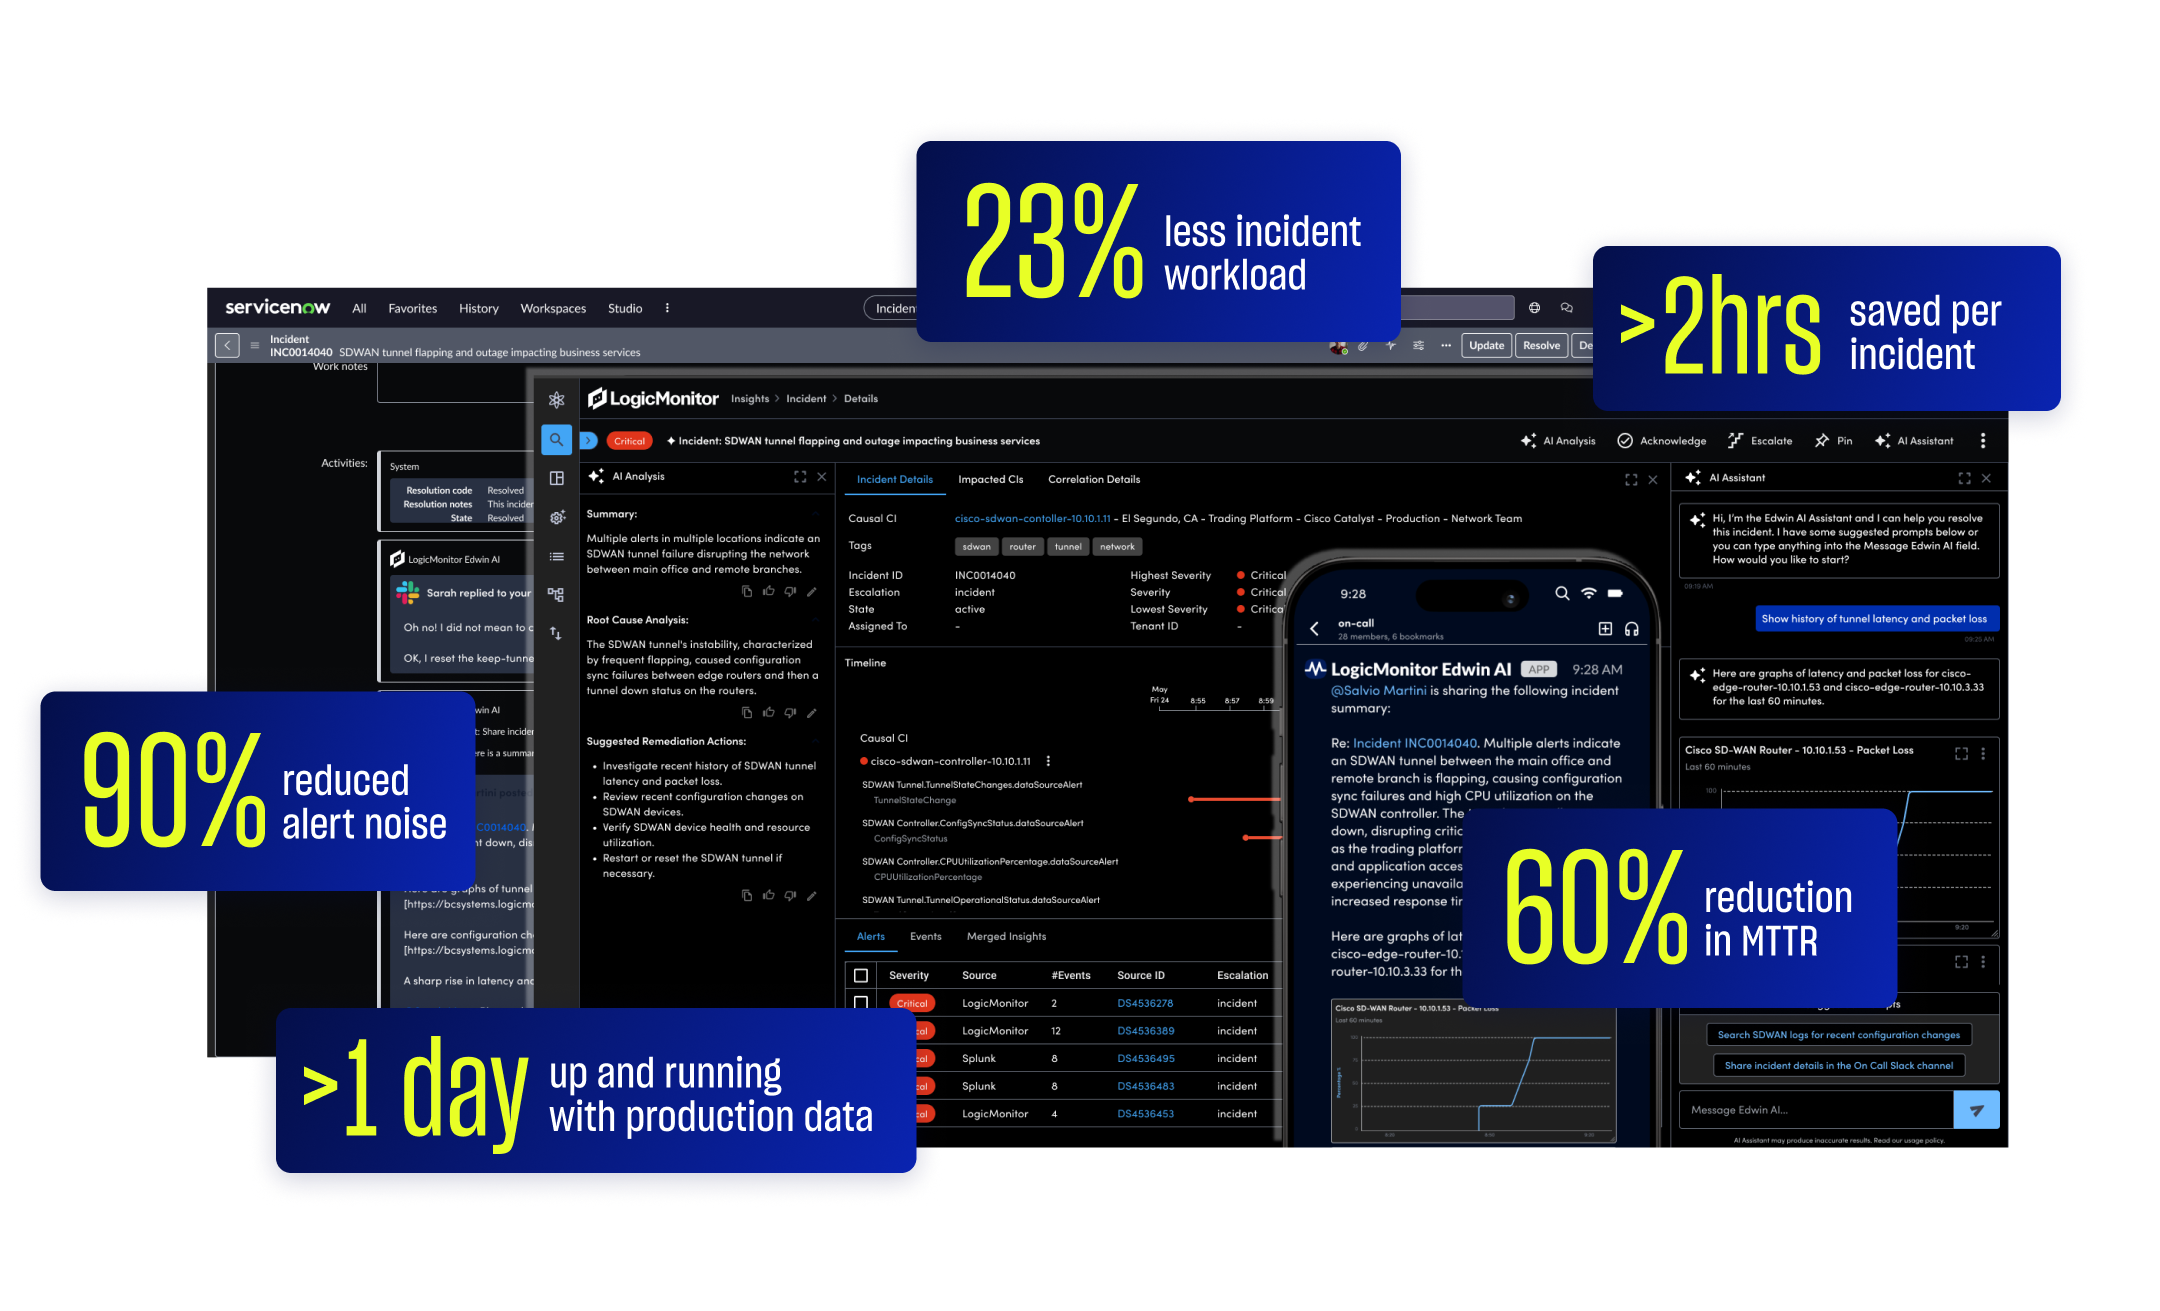
TRUSTED BY LEADING COMPANIES

Schneider electric logo
topgolf logo
Columbia Sportswear logo
Coca Cola Bottling Distributed logo

Network Observability Platform

Total Visibility and Control Across Every Layer

LogicMonitor Envision gives you AI-powered observability into traffic, dependencies, and performance in real time across hybrid environments. You can spot issues early, resolve root causes quickly, and keep your business running smoothly.

BY THE NUMBERS

Network monitoring that makes an impact

0 %
fewer tickets
0 %
fewer monitoring tools
0 %
faster MTTR
0 %
time savings

See every connection, everywhere

Get full visibility into routers, switches, firewalls, SD-WAN, and cloud-based devices, all from a single platform with no blind spots.

Catch issues fast. Fix them faster.

Correlate metrics, logs, and alerts in real time to pinpoint root causes before users or services ever feel the impact.

Connect network health to business outcomes

Show how performance drives revenue, SLA adherence, and customer experience so IT stays aligned with what matters most.

Spot anomalies early. Keep downtime rare.

Leverage log-based alerts, dynamic thresholds, and real-time traffic insights without toggling between tools.

Bring clarity to chaos

Edwin AI: Agentic AIOps for Incident Management

Edwin AI helps you catch issues early, cut through noise, and resolve incidents fast. With built-in generative AI, it auto-correlates alerts, surfaces root cause, and gives step-by-step guidance to fix problems before customers ever notice.

One platform for complete network observability

Everything you need to monitor, manage, and optimize your network

Monitoring
Dashboards
Alerts
Data Correlation
Cost & Capacity

See everything, everywhere, in real time.

  • Device Auto-Discovery Detect routers, switches, firewalls, and more automatically with scheduled IP range scans.
  • Real-Time Polling Collect metrics every 30 seconds using SNMP, WMI, or APIs to continuously track performance.
  • Topology Mapping Visualize Layer 3 device relationships and dependencies across hybrid and cloud networks.

Turn data into decisions fast.

  • Role-Based Dashboards Build views tailored to NOC teams, executives, or customer-facing reports.
  • Visual Correlation Surface patterns and anomalies with real-time metrics, logs, and flow data in one view.
  • Automated Reporting Send scheduled PDF or CSV reports with uptime, availability, and usage metrics.

Act before users notice.

  • Anomaly Detection with AI Identify abnormal behavior without relying on static thresholds.
  • Intelligent Alert Routing Automatically notify the right team with alerts enriched by logs and metrics.
  • Dynamic Thresholding Reduce noise with baselines that adjust to your environment in real time.

Know what happened and why.

  • Event and Metric Correlation Link flow data, logs, and device health to uncover root causes in one place.
  • Hop-by-Hop Analysis Trace packet loss and latency at every step of the path.
  • Dependency Mapping Visualize how network issues affect applications and services.

Stay efficient as your network grow

  • Bandwidth and Capacity Planning Track usage trends to avoid saturation and plan capacity with confidence.
  • Idle Resource Detection Find underused links and interfaces to cut costs and improve efficiency.
  • Scalable, Cloud-Ready Architecture Extend visibility automatically as new cloud regions, edge devices, or SD-WAN sites come online.

We couldn’t see the whole picture. Since deploying LogicMonitor, we have one tool and one location where we can see across all our infrastructure. The time savings are huge. I can’t even calculate them, but I would say hundreds of hours.

Idan L.
US Operations, Optimal+

Integrations

One Platform. Total Network Insight.

Monitor everything in one place. Stay ahead of issues and keep performance smooth—with no surprises.

GET ANSWERS

FAQs

Get the answers to the top network monitoring questions.

What is network observability, and how is it different from network monitoring?

Network observability goes beyond device monitoring. It correlates metrics, traffic flow, and topology data to give you deep insight into what’s happening and why across your entire network.

How does LogicMonitor help troubleshoot network issues faster?

With real-time path analysis, AI-powered anomaly detection, and correlated insights, LM Envision surfaces the root cause so you can fix latency, packet loss, or outages before they escalate.

Can LogicMonitor handle hybrid, multi-cloud, and SD-WAN networks?

Yes. LM Envision automatically discovers and monitors on-premises devices, cloud infrastructure, and distributed environments such as SD-WAN and edge sites. No manual setup is required.

Can LogicMonitor help reduce alert noise?

Definitely. With AI-powered anomaly detection and dynamic thresholds, LM Envision filters out the noise and flags only what truly matters—so your team can focus.

How much data and context do I get?

End-to-end visibility. LM Envision collects metrics every 30 seconds and correlates them with logs and flow data—giving you full situational awareness in a single view.

Can different teams create their own dashboards and alert rules?

Absolutely. You can customize dashboards by role, region, or service, and tailor alerts based on thresholds, behavior patterns, or business criticality.

How does AI actually help with network operations?

AI detects unusual patterns, reduces alert noise, and intelligently groups related events so your teams can focus on the right problems instead of chasing false positives.